Abstract
DNA methylation is involved in development and in human diseases. Genomic DNA derived from lymphoblastoid cell lines (LCLs) is commonly used to study DNA methylation. There are potential confounding factors regarding the use of LCL-derived DNA, however, such as Epstein-Barr (EB) viral infection and artifacts induced during cell culture. Recently, several groups compared the DNA methylation status of peripheral blood leukocytes (PBLs) and LCLs and concluded that the DNA methylation profiles between them might be consistent. To confirm and extend theses results, we performed a comprehensive DNA methylation analysis using both PBLs and LCLs derived from the same individuals. Using the luminometric methylation assay, we revealed that the global DNA methylation level was different between PBLs and LCLs. Furthermore, the direction of change was not consistent. Comparisons of genome-wide DNA methylation patterns of promoter regions revealed that methylation profiles were largely conserved between PBLs and LCLs. A preliminary analysis in a small number of samples suggested that the methylation status of an LCL may be better correlated with PBLs from the same individual than with LCLs from other individuals. Expectedly, DNA methylation in promoter regions overlapping with CpG islands was associated with gene silencing in both PBLs and LCLs. With regard to methylation differences, we found that hypermethylation was more predominant than hypomethylation in LCLs compared with PBLs. These findings suggest that LCLs should be used for DNA methylation studies with caution as the methylation patterns of promoter regions in LCLs are not always the same as those in PBLs.
Keywords: :
Introduction
In medical genetics, the main sources of genomic DNA are peripheral blood leukocytes (PBLs) and Epstein-Barr (EB) virus-transformed lymphoblastoid cell lines (LCLs). LCLs have a great advantage in that they provide an unlimited source of DNA, though some studies report that LCLs are susceptible to genomic instability.Citation1–Citation4
In addition to DNA variations and mutations, DNA modifications are an important factor in disease development and progression.Citation5 DNA methylation at the cytosine residue of the CpG site, the main DNA modification in mammals, is involved in gene silencing, tissue differentiation, genomic imprinting and X chromosome inactivation. Aberrant DNA methylation is related to various diseases and developmental disabilities such as cancer and mental retardation.Citation6
Genomic DNA derived from LCLs is most useful for studying DNA methylation, because studying DNA methylation generally requires a large amount of DNA. LCLs are not a simple alternative for PBLs, however, because LCLs comprise infected B lymphocytes, whereas PBLs contain various types of blood cells. In addition, several factors potentially affect DNA methylation patterns in LCLs compared to the original B lymphocytes, including EB virus infection, immortalization, cell culture conditions and freezing cycles. Grafodatskaya et al. reported that methylation alterations in LCLs are more profound in highly passaged cells, but freezing cells that have been passaged only a few times does not significantly affect DNA methylation.
Here, we performed a comprehensive DNA methylation analysis using both PBLs and LCL genomic DNA derived from the same individuals to identify the altered methylation patterns in LCLs. The goal of this study was to determine the utility of LCLs for DNA methylation analysis associated with human diseases. In previous studies, Brennan et al. compared DNA methylation profiles in the promoter regions of a subset of genes, and Grafodatskaya et al. and Sun et al. compared genome-wide CpG site DNA methylation by obtaining snapshots or signatures of samples.
To our knowledge, however, there are no comprehensive DNA methylation analyses that focused on whole genome promoter regions using an ample number of samples. In the present study, we first compared global DNA methylation levels with three sets of PBLs and LCLs using a luminometric methylation assay (LUMA).Citation10,Citation11 We then performed a promoter tiling array analysis to compare genome-wide DNA methylation patterns of promoter regions between four sets of PBLs and LCLs.
Results
Global DNA methylation levels between PBLs and LCLs.
We examined the global DNA methylation levels of three sets of PBLs and LCLs by the LUMA method. All LCLs were low-passage without freezing. The accuracy and linearity of this assay were verified by inclusion of standard samples containing different proportions of methylated DNA. An inverse correlation between the CpG methylation level and the HpaII/MspI ratio was observed (R2 = 0.999, ), demonstrating the applicability of the assay to detect subtle changes in DNA methylation in our experiments. The LUMA revealed alterations of HpaII/MspI ratios ranging from 0.57–0.21 (C1), 0.35–0.44 (C3) and 0.32–0.52 (C4), demonstrating a difference in the global DNA methylation level between PBLs and LCLs and the direction of the change was not consistent ().
Comparison of genome-wide promoter methylation patterns between PBLs and LCLs.
We examined the genome-wide promoter methylation patterns of four sets of PBLs and LCLs. Correlation coefficients (R) of the signal intensity of all probes between any two samples are shown in . The average R value among PBLs and LCLs was 0.85 and 0.69, respectively, and there was a significant difference between them (p value = 0.007, unpaired t-test; ). Among the sets of PBLs and LCLs from the same individuals, the mean R value was 0.77. This was not significantly different from the R values among PBLs (p value = 0.125, unpaired t-test). The methylation pattern in LCLs of an individual tended to be more similar to that of their own PBLs than to the LCLs of others (Sup. Fig. 1), although the number of samples is too small to draw a conclusion.
Features of methylated regions in PBLs (PBL MRs) and LCLs (LCL MRs).
We detected methylated regions (MRs) in PBLs and LCLs using MAT software,Citation12 and extracted 1,510 regions as PBL MRs and 2,587 regions as LCL MRs (). The common MRs between PBL MRs and LCL MRs comprised 1,379 regions, indicating that the methylation profiles were largely conserved between PBLs and LCLs. In addition, through rigorous data analysis, we detected specifically methylated regions in the PBLs (PBL-specific MRs; Sup. Table 1) and LCLs (LCL-specific MRs; Sup. Table 2). We performed bisulfite sequencing to validate the results of tiling array. The methylation patterns in each candidate region of PBL-specific MRs and LCL-specific MRs were confirmed using the samples used for tiling array (Sup. Fig. 2). The number of LCL-specific MRs was about eight times greater than that of PBL-specific MRs (). The number of genes located within 3 kb of the MRs is summarized in .
Ontology analysis of the methylation-associated genes.
We performed a PANTHER ontology analysis using the gene lists of the PBL MRs and LCL MRs (). It seems that genes related to LCL MRs are more diverse compared with those related to PBL MRs (). However, when we closely examined the ontologies enriched in the genes related to LCL-specific MRs, most of the ontologies enriched in the LCL-specific MRs were included in those enriched in PBL MRs (Sup. Table 3). This is paradoxical; however, it would be reasonable to ascribe the apparently large number ontologies enriched in LCL MRs to the large number of genes within 3 kb of LCL MRs (N = 1,477) compared with PBL MRs (N = 768).
Correlation between DNA methylation and gene expression.
Methylation of the CpG islands in promoter regions contributes to silencing gene expression.Citation13 Using the GEO database, we retrieved gene expression datasets for the PBLs (GSE6613, N = 22 controlsCitation14 and GSE10041, N = 23 controlsCitation15), and LCLs (GSE12408, N = 17 controlsCitation16 and GSE13122, N = 13 controlsCitation17), derived from control subjects. We selected the probe sets whose promoter regions were associated with the PBL MRs overlapping with CpG islands and examined their expression status based on flag analysis. In both datasets for PBLs, genes with promoters on PBL MRs were significantly more silenced in PBLs compared with all genes (p = 3.54E-03 for GSE6613 and 1.99E-03 for GSE10041; Fisher's exact test; and B). Similarly, the genes with promoters on LCL MRs were significantly more silenced in LCLs compared with all genes (p = 2.98E-03 for GSE12408 and p = 4.10E-05 for GSE13122; and B). These results are consistent with current knowledge that DNA methylation of CpG islands in promoter regions is relevant to gene silencing.
Individual alteration of DNA methylation pattern in LCLs.
We then analyzed the methylated regions in individual subjects and detected specific methylated regions in the PBLs or LCLs in each of the four subjects separately (). The number of LCL-specific MRs was greater than that of PBL-specific MRs in three of the four sets, consistent with the finding of a previous study in reference Citation7. However, we also observed the opposite case (C4), suggesting that the direction of the methylation changes is possibly stochastic at the cell line level. The fact that there was few number of MRs overlapping among all four cell lines is consistent with this possibility.
Discussion
LCLs are widely used for many aspects of genetic and epigenetic studies. In an individual, the DNA sequence is generally common to most cell types and is fixed through life. In contrast, the DNA methylation pattern changes during the course of development. LCLs are generated by transforming peripheral B lymphocytes with EB viral infection. This could affect the DNA methylation patterns. If these changes in the DNA methylation pattern in LCLs occur in a small proportion or at specific regions, LCLs could be used for DNA methylation analysis with cautious interpretation of the results. In this study, we performed a comprehensive DNA methylation analysis using PBL and LCL sets from the same individuals. A comparison of the global methylation level by LUMA revealed that the direction of the changes was not consistent across samples. These results suggest that LCLs are not a suitable alternative for PBLs for measuring global DNA methylation levels.
The global DNA methylation level of PBLs is also altered in both directions with aging.Citation18,Citation19 Thus, global methylation levels in the peripheral tissues are likely to be unstable upon changes in the internal or external environment.
In the comparison of genome-wide methylation patterns using the Affymetrix Human promoter array, the correlation coefficients among LCLs were significantly lower than those among PBLs. This result was consistent with the results of a previous study in reference Citation7, and indicated that the DNA methylation profile was not completely conserved in LCLs. This study showed that methylation status in LCLs was correlated with that in PBLs from the same individuals. Although this finding should be confirmed in a larger sample set, DNA methylation profiles could be at least partly maintained after EB virus transformation. In addition, among the 1,510 methylated regions in PBLs, 1,379 regions were also detected as methylated regions in LCLs. Thus, most of the promoter methylation regions in PBLs were maintained in LCLs.
We expectedly found an association between DNA methylation in promoter regions overlapping with CpG islands and gene silencing in both PBLs and LCLs. Grafodatskaya et al. hypothesized that random methylation occurs in LCLs preferentially in genes that are not important for cell survival. However, the present results of gene ontology analysis in LCL-specific MRs showed that methylation in LCLs occurs in similar genes to those methylated in PBLs.
Although the direction of promoter methylation changes in individual LCL samples was not consistent, hypermethylation was overall more predominant than hypomethylation in LCLs. In any case, it should be cautioned that methylation patterns in LCLs do not always reflect that in PBLs in the study of human diseases.
Limitation
Although we used PBLs and LCLs to identify changes in the methylation patterns in LCLs, B lymphocytes are more suitable than PBLs because their use avoids the effect of cellular heterogeneity within PBLs. In addition, LCLs constitute a subset of B lymphocytes selected by the EB virus as a host, and methylation patterns might depend on the B lymphocyte subset. Further studies are required to exclude these confounding factors. Because we used only low-passage LCLs without freezing, the effects of passage number and freezing cycles on changes in the methylation pattern in LCLs were not evaluated. We could perform LUMA assay only in three of four sets of PBL because of the limited amount of DNA left. Analysis of larger number of DNA samples would be helpful to elucidate global methylation change in LCLs in the future. In addition, larger number of samples is needed to test the validity of a LCL as a representative of PBL in an individual.
Materials and Methods
Samples.
For the LUMA, we used three sets of PBLs and LCLs obtained from the same unrelated healthy Japanese individuals, 29-(C1) and 52-(C4) year old males and a 25 year-old female (C3). The LCL DNA derived from a healthy 27 year-old Japanese male was used to prepare standard DNA samples as described below. For methylation analysis using promoter tiling arrays, we used one additional set of PBLs and LCL from a 25 year-old healthy Japanese female (C2). We used another one set of PBLs and LCLs from a 45-year-old healthy Japanese male for bisulfite sequencing. This study was approved by the Research Ethics Committee of RIKEN. Informed consent was obtained from all participants.
Sample preparation.
LCLs were previously established by transforming lymphocytes with EB virus using standard techniques.Citation20 Briefly, lymphocytes were separated from peripheral blood and cultured with RPMI 1640 medium containing 20% fetal bovine serum (GIBCO, Carlsbad, CA), penicillin and streptomycin (50 µg/ml each) and supernatant of the B95-8 cell culture infected with EB virus. The cells were passaged every week until stable growth was exhibited. Thereafter, the cells were passaged two or three times a week using similar medium, except for the addition of 10% fetal bovine serum. DNA was extracted using standard protocols.
Luminometric methylation assay.
The LUMA was performed as initially described by Karimi et al.Citation10,Citation11 with slight modifications. Each genomic DNA (200 ng) was digested with EcoRI (New England Biolabs, Beverly, MA) in two separate 20 µl reactions containing 20 mM Tris-acetate, 10 mM Mg-acetate, 50 mM K-acetate pH 7.9, 1 mM dithiothreitol and 10 U restriction enzyme. After incubation at 37°C for 4 h, one of the digests was cleaved with 15 U HpaII (New England Biolabs) and the other digest was cleaved with 15 U MspI (New England Biolabs) at 37°C overnight. Then, 20 µl of annealing buffer (20 mM Tris-acetate, 2 mM Mg-acetate pH 7.6) was added to the cleavage reactions, and the samples were placed in a PSQ96™ MA system (Biotage AB, Uppsala, Sweden). Using PyroMark Gold Q96 Reagents for pyrosequencing (QIAGEN, Crawley UK), the instrument was programmed to add dNTPs in four consecutive steps including Step 1: dATPαS (the derivative of dATP, used because it does not directly react with luciferase and prevents non-specific signals); Step 2: a mixture of dGTP + dCTP; Step 3: dTTP and Step 4: a mixture of dGTP + dCTP. Peak heights were calculated using the PSQ96™MA software. The HpaII/EcoRI and MspI/EcoRI ratios were calculated as (dGTP + dCTP)/dATP for the respective reactions. The HpaII/MspI ratio was defined as (HpaII/EcoRI)/(MspI/EcoRI).
Using LCL DNA derived from a Japanese male, we prepared unmethylated DNA by whole genome amplification using a Genomiphi DNA Amplification kit (GE Healthcare Life Science). Methylated DNA was then obtained by treating unmethylated DNA with SssI methylase (New England Biolabs). Methylated and unmethylated DNAs were mixed in different proportions to obtain samples with 0, 25, 50, 75 or 100% methylated DNA and used as standard samples for the LUMA.
Each assay was replicated, and the results were plotted as mean value ± SEM for a given concentration.
Enrichment of methylated DNA.
We used a MethylCollector Ultra Kit (Active Motif, Carlsbad, CA) to enrich the methylated DNA according to the manufacturer's protocol. In this method, His-tagged recombinant MBD2b and its binding partner MBD3L1 were combined together to increase the affinity of MBD2b for CpG-methylated DNA. The sensitivity is such that it can enrich methylated DNA fragments with as few as five methylated CpG sites. A total of 100 ng DNA fragments, which were sonicated to produce 100–300 bp fragments using a sonicator (Covaris, Inc., Woburn, MA) were incubated with a His-tagged recombinant MBD2b/MBD3L1 protein complex. These protein-DNA complexes were captured with nickel-coated magnetic beads. After stringent washing, methylated DNA was eluted. Eluted DNA was further purified using the MiniElute PCR purification kit (QIAGEN).
Promoter tiling array.
We used a GeneChip Human Promoter 1.0R array (Affymetrix, Santa Clara, CA), which contains 4.6 million probes tiled to cover over 25,500 human promoter regions. The probes are 25 bp long and are spaced 35 bp from the middle of each probe to the next, leaving a gap of approximately 10 bp between probes. Sample preparation for the tiling array using the eluted methylated DNA fraction was performed according to the Affymetrix chromatin immunoprecipitation assay protocol provided by the manufacturer (Affymetrix). Briefly, after amplification, DNA samples were labeled using a GeneChip WT Double-Stranded DNA Terminal Labeling Kit (Affymetrix). The samples were hybridized with Affymetrix GeneChip Human Promoter 1.0R arrays. The arrays were stained and washed with GeneChip Fluidics Station 450 and scanned with the GeneChip 3000 7G Scanner. We prepared fully CpG unmethylated DNA obtained by whole genome amplification and used this DNA as a reference sample. The reference sample was also prepared using a Methyl Collector Ultra kit, and the promoter array analyses were replicated.
Tiling array data analysis.
Calculation of correlation coefficients (R). We used Affymetrix Tiling Array Software to obtain signal intensities of individual probes. Pearson's correlation coefficients between samples were calculated using R script (www.r-project.org).
Detection of methylated regions. MRs were detected using model-based analysis of tiling-arrays (MAT) software.Citation12 In MAT, probe sequence and copy number on each array is considered for the standardization of the probe value. This can eliminate the need for normalization. Using MAT, we can score enrichment regions with robust p value, and detect enrichment regions from single samples, multiple samples or multiple samples with controls.Citation12 For all comparisons, we used MAT with a p value of 1e-4, and all other parameters were the defaults. We performed both group and individual analyses with R script using the following steps. Scripts are available upon request.
In the group analysis, we first compared all PBL (N = 4) and LCL (N = 4) samples to a reference sample (i.e., unmethylated DNA) respectively to detect the regions showing the significantly methylated signal compared with a reference sample. These MRs were named PBL MRs and LCL MRs. Only those regions containing six or more CpG sites were further selected because the MethylCollector can collect the DNA fragments that contain five or more CpG sites. We then directly compared all PBL samples to all LCL samples to detect the regions showing significant differences between PBLs and LCLs. These MRs were named PBL-dominant MRs and LCL-dominant MRs. Among the PBL-dominant MRs, the regions overlapping with PBL MRs but not LCL MRs were selected. The selected regions were named PBL-specific MRs. LCL-specific MRs were determined vice versa. These steps highlighted the methylation difference between PBLs and LCLs, and eliminated significant but subtle differences to maximize the chance for successful confirmation by other methods.
In the individual analysis, we compared the PBL or the LCL sample to a reference sample separately to identify PBL MRs or LCL MRs in each of the four subjects, and only those regions containing six or more CpG sites were further selected. We then identified PBL-dominant MRs and LCL-dominant MRs from the direct comparison of the PBLs and LCLs from the same individual. To identify PBL-specific MRs, the regions overlapping with PBL MRs but not LCL MRs were selected among the PBL-dominant MRs. These steps were performed separately for each subject. The PBL-specific MRs were similarly determined. We further identified the number of each PBL- or LCL-specific MRs overlapping among all four, three or two cell lines.
Bisulfite sequencing. Each 500 ng of genomic DNA was converted for methylation sequencing using Epitect bisulfite kits (Qiagen), according to the manufacturer's standard protocol. Completion of sodium bisulfite conversion was confirmed during sequencing by ensuring that known lone cytosines were read as thymines.
Primer pairs were determined using MethPrimer software.Citation21 PCR products were digested with Thermostable β-Agarase (NIPPON GENE CO., LTD., Tokyo, Japan) and cloned using a TOPO TA cloning kit (Invitrogen, Carlsbad, CA). Single bacterial colonies were subjected to sequencing analysis. Each bisulfite sequencing data was quantified by quantification tool for methylation analysis.Citation22
Gene ontology analysis. We collected the genes located within 3 kb of the MRs using the Build 36.1 finished human genome assembly (hg18, Mar 2006) with R script. Ontology analysis was performed using the PANTHER classification system.Citation23,Citation24 The significantly enriched terms were identified using the Bonferroni correction for multiple comparisons with a cutoff of p < 0.05.
Public expression data analysis. We examined the correlation between MRs overlapping with CpG islands in promoter regions and the gene expression status using a public database. We searched PBL expression datasets from the Gene Expression Omnibus (GEO) using the terms “Homo sapiens, whole blood and Affymetrix” and selected the two datasets with a large number of control samples (GSE6613Citation14 and GSE10041,Citation15). In the same way, we searched LCL expression datasets using the terms “Homo sapiens, lymphoblastoid cell and Affymetrix” and selected two datasets (GSE12408Citation16 and GSE13122,Citation17). In each dataset, only control subjects were used for data analysis.
First, we examined the expression status of all genes (probe sets). The number of genes with one or more transcripts with present or marginal flag was counted. The number of genes whose all probes were called as absent was also counted. Next, we examined the expression status of the genes with promoter regions (within 10 kb of exon 1) on the PBL or LCL_MRs overlapping with CpG islands.
For statistical analysis, Fisher's exact test was used.
Conclusion
In summary, we performed a comprehensive DNA methylation analysis using both PBL and LCL genomic DNA derived from the same individuals. Our findings indicate that the methylation patterns of promoter regions were largely conserved between PBLs and LCLs. In addition, methylation in promoter regions overlapping with CpG islands was associated with gene silencing in LCLs similarly to PBLs. However, there are some methylation differences between PBLs and LCLs and hypermethylation might be more predominant than hypomethylation in LCLs. LCLs should be used with caution for DNA methylation analysis associated with human diseases, as the methylation patterns of promoter regions in LCLs is not always the same as in PBLs.
Figures and Tables
Figure 1 Global DNA methylation analysis using luminometric methylation assay (LUMA). (A) The linearity of the LUMA, assessed using standard DNA samples. Unmethylated DNA generated by whole genome amplification, as well as methylated DNA generated by treating the unmethylated DNA with SssI methylase were mixed in different proportions to obtain samples with 0, 25, 50, 75 or 100% methylated DNA. (B) Methylation levels of three sets of PBLs and LCLs derived from the same individual. All LCLs were low-passage without freezing.
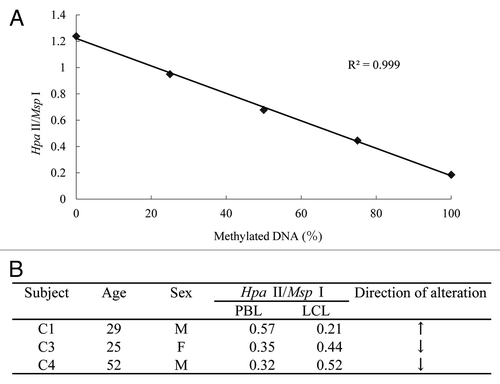
Figure 2 Correlation coefficients. (A) Correlation coefficients between all pair-wise comparisons. (B) Comparison of average correlation between PBLs or LCLs from four individuals. Student's t-test p value is given.
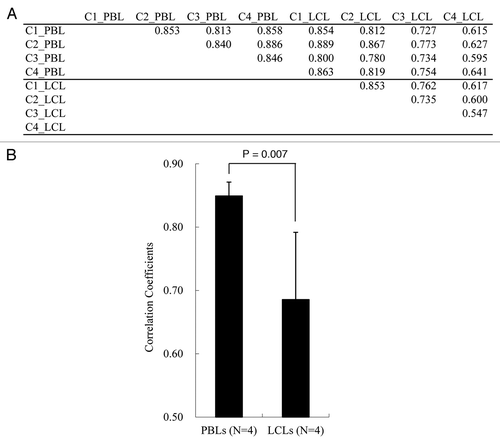
Figure 3 Effect of methylation in promoter regions overlapping with CpG islands on gene expression in PBLs. The numbers of genes containing at least one probe with present or marginal flags, as well as that of genes whose all probes were called as absent, are indicated. If all samples across the chosen study showed absent flags with respect to a certain probe set, we considered this “absent,” and “present” probes were determined similarly. If one gene had both probe sets of present/marginal and absent, the gene was classified as an expressed gene. (A) HGU133A platform (GSE6613 (the number of control samples N = 22)Citation14), (B) HGU133plus2.0 platform (GSE10041 (N = 23)Citation15). Fisher's exact test p values are given. A: genes with absent probes, P/M: genes with present or marginal probes, N = number of control samples.
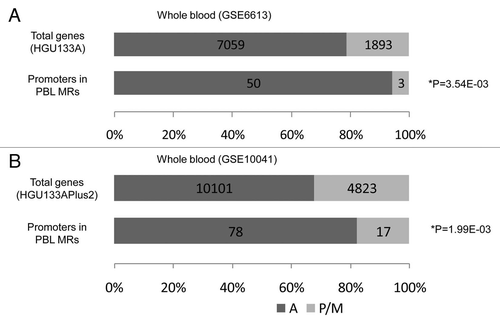
Figure 4 Effect of methylation in promoter regions overlapping with CpG islands on gene expression in LCLs. The numbers of genes with containing at least one probe with present or marginal flags, as well as that of genes whose all probes were called as absent, are indicated. If all samples across the chosen study showed absent flags with respect to a certain probe set, we considered this “absent” and “present” probes were determined similarly. If one gene had both probe sets of present/marginal and absent, the gene was classified as an expressed gene. (A) HGU133plus2.0 platform data set from GEO (GSE12408 (N = 17)Citation16), (B) HGU133plus2.0 platform data set from GEO (GSE13122 (N = 13)Citation17). Fisher's exact test p values are given. A: genes with absent probes, P/M: genes with present or marginal probes, N = number of control samples.

Table 1 Summary of number of MRs and genes located within 3 kb from MRs
Table 2 Ontology analysis of the genes related to PBL MRs and LCL MRs
Table 3 The number of specifically methylated regions in individual subjects
Additional material
Download Zip (358.2 KB)Acknowledgements
We are grateful to the Research Resource Center of our institute for performing the microarray analysis.
References
- Mohyuddin A, Ayub Q, Siddiqi S, Carvalho-Silva DR, Mazhar K, Rehman S, et al. Genetic instability in EBV-transformed lymphoblastoid cell lines. Biochim Biophys Acta 2004; 1670:81 - 83
- Redon R, Ishikawa S, Fitch KR, Feuk L, Perry GH, Andrews TD, et al. Global variation in copy number in the human genome. Nature 2006; 444:444 - 454
- Jeon JP, Shim SM, Nam HY, Baik SY, Kim JW, Han BG. Copy number increase of 1p36.33 and mitochondrial genome amplification in Epstein-Barr virus-transformed lymphoblastoid cell lines. Cancer Genet Cytogenet 2007; 173:122 - 130
- Sugawara H, Iwamoto K, Bundo M, Kazuno AA, Nakano Y, Ishigooka J, et al. A 3-bp deletion of mitochondrial DNA tRNALys observed in lymphoblastoid cells. J Hum Genet 2009; 54:612 - 613
- Jones PA, Baylin SB. The epigenomics of cancer. Cell 2007; 128:683 - 692
- Bird A. DNA methylation patterns and epigenetic memory. Genes Dev 2002; 16:6 - 21
- Grafodatskaya D, Choufani S, Ferreira JC, Butcher DT, Lou Y, Zhao C, et al. EBV transformation and cell culturing destabilizes DNA methylation in human lymphoblastoid cell lines. Genomics 95:73 - 83
- Brennan EP, Ehrich M, Brazil DP, Crean JK, Murphy M, Sadlier DM, et al. Comparative analysis of DNA methylation profiles in peripheral blood leukocytes versus lymphoblastoid cell lines. Epigenetics 2009; 4:159 - 164
- Sun YV, Turner ST, Smith JA, Hammond PI, Lazarus A, Van De Rostyne JL, et al. Comparison of the DNA methylation profiles of human peripheral blood cells and transformed B-lymphocytes. Hum Genet 2010; 127:651 - 658
- Karimi M, Johansson S, Ekstrom TJ. Using LUMA: a Luminometric-based assay for global DNA-methylation. Epigenetics 2006; 1:45 - 48
- Karimi M, Johansson S, Stach D, Corcoran M, Grander D, Schalling M, et al. LUMA (LUminometric Methylation Assay)—a high throughput method to the analysis of genomic DNA methylation. Exp Cell Res 2006; 312:1989 - 1995
- Johnson WE, Li W, Meyer CA, Gottardo R, Carroll JS, Brown M, et al. Model-based analysis of tiling-arrays for ChIP-chip. Proc Natl Acad Sci USA 2006; 103:12457 - 12462
- Momparler RL. Cancer epigenetics. Oncogene 2003; 22:6479 - 6483
- Scherzer CR, Eklund AC, Morse LJ, Liao Z, Locascio JJ, Fefer D, et al. Molecular markers of early Parkinson's disease based on gene expression in blood. Proc Natl Acad Sci USA 2007; 104:955 - 960
- Dusek JA, Otu HH, Wohlhueter AL, Bhasin M, Zerbini LF, Joseph MG, et al. Genomic counter-stress changes induced by the relaxation response. PLoS One 2008; 3:2576
- Liu J, Zhang Z, Bando M, Itoh T, Deardorff MA, Clark D, et al. Transcriptional dysregulation in NIPBL and cohesin mutant human cells. PLoS Biol 2009; 7:1000119
- Harewood L, Schutz F, Boyle S, Perry P, Delorenzi M, Bickmore WA, et al. The effect of translocation-induced nuclear reorganization on gene expression. Genome Res 20:554 - 564
- Fraga MF, Ballestar E, Paz MF, Ropero S, Setien F, Ballestar ML, et al. Epigenetic differences arise during the lifetime of monozygotic twins. Proc Natl Acad Sci USA 2005; 102:10604 - 10609
- Ushijima T, Okochi-Takada E. Aberrant methylations in cancer cells: where do they come from?. Cancer Sci 2005; 96:206 - 211
- Kato T, Ishiwata M, Mori K, Washizuka S, Tajima O, Akiyama T, et al. Mechanisms of altered Ca2+ signalling in transformed lymphoblastoid cells from patients with bipolar disorder. Int J Neuropsychopharmacol 2003; 6:379 - 389
- Li LC, Dahiya R. MethPrimer: designing primers for methylation PCRs. Bioinformatics 2002; 18:1427 - 1431
- Kumaki Y, Oda M, Okano M. QUMA: quantification tool for methylation analysis. Nucleic Acids Res 2008; 36:170 - 175
- Thomas PD, Campbell MJ, Kejariwal A, Mi H, Karlak B, Daverman R, et al. PANTHER: a library of protein families and subfamilies indexed by function. Genome Res 2003; 13:2129 - 2141
- Thomas PD, Kejariwal A, Guo N, Mi H, Campbell MJ, Muruganujan A, et al. Applications for protein sequence-function evolution data: mRNA/protein expression analysis and coding SNP scoring tools. Nucleic Acids Res 2006; 34:645 - 650