Abstract
Protein glycosylation is a ubiquitous modification that affects the structure and function of proteins. Our recent genome wide association study identified transcription factor HNF1A as an important regulator of plasma protein glycosylation. To evaluate the potential impact of epigenetic regulation of HNF1A on protein glycosylation we analyzed CpG methylation in 810 individuals. The association between methylation of four CpG sites and the composition of plasma and IgG glycomes was analyzed. Several statistically significant associations were observed between HNF1A methylation and plasma glycans, while there were no significant associations with IgG glycans. The most consistent association with HNF1A methylation was observed with the increase in the proportion of highly branched glycans in the plasma N-glycome. The hypothesis that inactivation of HNF1A promotes branching of glycans was supported by the analysis of plasma N-glycomes in 61 patients with inactivating mutations in HNF1A, where the increase in plasma glycan branching was also observed. This study represents the first demonstration of epigenetic regulation of plasma glycome composition, suggesting a potential mechanism by which epigenetic deregulation of the glycome may contribute to disease development.
Introduction
While genes unequivocally determine the structure of proteins, the expression of these genes and, consequently, the majority of all molecular processes that occur in our cells are regulated by various epigenetic mechanisms, the major components of which are DNA methylation, histone modifications and the action of small non-coding RNAs. Unlike DNA sequence, which is generally quite stable and does not change during lifetime, epigenetic patterns can substantially change with advancing age and, moreover, are sensitive to environmental influences.Citation1–Citation4 This is particularly important for genes that participate in the process of protein glycosylation since, by altering the activity of “glyco-genes,” the epigenetic information tailored by the environment can modify biological structures, which then play important roles in the adaptation to specific environmental conditions.Citation5
Over a half of all known eukaryotic proteins are N-glycosylated by the covalent addition of branched oligosaccharides (glycans) to asparagine residues within a sequence Asn-X-Ser/Thr.Citation6 N-glycosylation is essential for multicellular life and its complete absence is embryonically lethal.Citation7 Variations in glycosylation are of great physiological significance since it has been demonstrated that changes in glycans significantly change the structure and function of polypeptide parts of glycoproteins.Citation8 Proper glycosylation of membrane receptors is particularly important as it modulates adaptive properties of the cell membrane and affects communication between the cell and its environment.Citation9 Dysregulation of glycosylation is associated with a wide range of diseases, including cancer, diabetes, cardiovascular, congenital, immunological and infectious disorders.Citation10–Citation12 Nevertheless, knowledge of the structure and function of glycans still significantly lags behind the knowledge of other macromolecules due to experimental difficulties in analyzing complex glycan structures.Citation13
Polypeptide parts of glycoproteins are defined by their corresponding genes, but there are no genetic templates for glycan parts of glycoproteins. Instead, a complex dynamic network of hundreds of genes code for enzymes involved in the synthesis of glycans;Citation14 over 600 “glyco-genes” (genes coding for various glycosyltransferases, glycosidases, enzymes for sugar nucleotide biosynthesis, transporters, etc.,) are currently identified.Citation15,Citation16 The expression of “glyco-genes” and the activity of corresponding enzymes are affected by various transcription factors, Golgi organizers, proton pumps and other proteins, further increasing the number of genes and protein products that are directly or indirectly involved in the synthesis of glycans. The majority of studies on the role of genetic factors on glycosylation are limited to a group of rare congenital disorders of glycosylationCitation17 and studies on genetics of glycosylation in normal populations. Studies of epigenetic regulation of glycosylation are particularly scarce (reviewed in ref. Citation18). However, recent technological advances have made possible reliable, high-throughput quantification of N-glycans,Citation19–Citation21 which now makes large-scale studies aimed at understanding the complexity of protein glycosylation feasible and affordable.
Recently, we completed a comprehensive analysis of plasma glycans in over 3,000 individuals from four European populations. This study revealed that the median difference between minimal and maximal levels of individual plasma glycans is over 6-fold, and for some glycans over 20-fold.Citation22 This level of variability in a population-based study is much greater than that found with any other classes of macromolecules. A large proportion of this variability appears to be under genetic control since the heritability of glycome composition was generally in the range of 50%.Citation22 Despite the absence of a genetic template, the composition of the individual plasma N-glycome was found to be virtually constant over a period of weeks and relatively stable even after one year.Citation23 This suggests the presence of regulatory elements that enable the long-term stability in the control of hundreds of different enzymes that participate in glycan biosynthesis. Individual environmental and lifestyle factors generally explained less than 5% of the variance in the majority of studied glycans, but for some glycan structures more pronounced effects were also observed,Citation24 indicating that some environmental stimuli can exert specific modifications in the glycosylation machinery.
Our recent genome wide association study (GWAS) of the plasma N-glycome identified transcription factor HNF1A as a master-regulator of plasma protein fucosylation.Citation25 Aiming to evaluate the importance of epigenetic regulation of HNF1A for protein glycosylation we analyzed CpG methylation in the HNF1A gene in 810 individuals and its association with the composition of both plasma and IgG N-glycomes.
Results
Analysis of CpG methylation at the HNF1A gene.
Aiming to evaluate the influence of CpG methylation in the promoter region of HNF1A on the composition of the human plasma N-glycome we analyzed methylation in DNA isolated from peripheral blood nucleated cells (PBNC) of 810 inhabitants of the Croatian island Korćula. The variably methylated CpG sites at +172 (Position 1), +175 (Position 2), +178 (Position 3) and +182 (Position 4) from the transcription start site in exon 1 of HNF1A (NCBI Reference Sequence: NG_011731.2) were analyzed. DNA methylation was expressed as the percentage of methylated cytosine at each of the four positions. Position 4 was found to be nearly 100% methylated in all individuals, while the degree of methylation in other sites was lower, with significant variability of individual methylation levels in the population (). Individual methylation values for the four cytosine sites are given in Table S1.
Methylation of LINE s and expression analysis.
Methylation of LINE1 sequences was analyzed in 200 individuals to evaluate whether the observed individual differences in HNF1A methylation reflect general methylation status of the individual, or tissue specific regulation effects. LINE1 methylation was found to be very constant in all individuals (75, 81, 56, 65, 93 and 69% for positions 1–6, respectively) with nearly negligible standard deviations (1.1, 2.4, 1.7, 1.7, 2.1 and 2.5 for positions 1–6, respectively). There was no correlation between the extent of HNF1A methylation and LINE1 methylation, indicating that the observed individual differences in HNF1A methylation in PBNC are not a reflection of the global DNA methylation status of an individual. The relevance of CpG methylation at the four analyzed sites for the expression of HNF1A was evaluated by quantifying both expression levels of HNF1A and HNF1A methylation in seven different cell lines. Cell lines with high methylation at these four sites had very low levels of HNF1A expression, while cell lines in which HNF1A was less methylated had much higher expression of HNF1A (), indicating that the analyzed four CpG sites either directly affect expression of HNF1A, or reliably reflect methylation of some neighboring functionally important methylation sites.
Analysis of the plasma N-glycome.
Plasma N-glycome was analyzed in the same individuals using hydrophilic interaction liquid chromatography (HILIC) and weak anion exchange (WAX) HPLC as described in the Materials and methods section. Total glycome was divided into 16 groups (chromatographic peaks) of sialylated glycans, 13 groups of desialylated glycans, and four groups of differentially charged glycans (mono-, di-, tri- and tetrasialylated). Relative quantification was performed, i.e., each chromatographic peak (group of glycans) was expressed as the percentage of the total glycome. An example of the chromatogram with main structures present in each of the peaks is shown in . Full list of all structures is shown in Table S2. IgG N-glycome was analyzed by UPLC of glycans released from isolated IgG as described in the Materials and methods section. Derived IgG glycosylation traits were calculated as reported previously in reference Citation27. Structures of glycans in individual UPLC peaks are shown in Table S3.
Association analysis.
Association analysis revealed a number of small, but statistically significant correlations between HNF1A methylation and different groups of plasma N-glycans. In total, 810 individuals were analyzed, but since some of the study participants were related, two different statistical approaches were used. Only unrelated people (singletons, n = 495) were included in the first analysis. This reduced the number of individuals, but removed all effects of relatedness. In the second analysis the entire population was included, but the results were corrected for relatedness estimated by the analysis of their genetic data. Only statistically significant associations are shown in , while the complete list of associations is available in Table S4. Interestingly, contrary to common polymorphisms in HNF1A, which were generally associated with changes in antennary fucosylation,Citation25 methylation of HNF1A mostly affected glycan branching. Positive correlations with cytosine methylation in HNF1A were observed for GP15 and GP16, both of which contain exclusively tetraantennary glycans. The analysis of derived glycan traits also revealed a positive correlation between HNF1A methylation and tetragalactosylated glycans (G4, ). Further support for the association between HNF1A methylation and highly branched glycans was provided by analysis of glycan sialylation (using weak anion exchange chromatography), which revealed a positive correlation between HNF1A methylation and trisialylated glycans ().
There was no statistically significant correlation between HNF1A methylation and any of the 75 analyzed IgG glycosylation traits. This was in good accordance with the above described associations because all IgG glycans are bi-antennary and do not contain antennary fucose. The absence of significant associations in IgG glycans provided further support for the biological relevance of associations observed in plasma since random associations would be as likely to occur in plasma and in IgG glycan data sets.
Analysis of HNF1A methylation in individuals with HNF1A-MODY subtype of diabetes.
Inactivating mutations in HNF1A are known to cause a rare subtype of diabetes called Maturity Onset Diabetes of the Young type 3 (HNF1A-MODY).Citation28 To confirm causative relation between inactivation of HNF1A and the increase in highly branched glycans we analyzed glycosylation of plasma proteins in 61 patients with HNF1A-MODY and compared it to “normal” glycan levels (determined in our laboratory by analyzing 4,123 individuals from four European populations). The results presented in clearly show that GP15 and GP16, which positively correlate with cytosine methylation of HNF1A, were also significantly elevated (p = 7.4E-27 and 2.7E-24, respectively) in HNF1A-MODY patients.
Discussion
HNF1A is a transcription factor that influences the expression of a number of different genes, including fucosyltransferases 3, 6 and 8Citation29 and N-acetylglucosaminyltransferase 4a,Citation30 which are relevant for protein glycosylation. Coding mutations in HNF1A cause the HNF1A-MODY subtype of diabetes. By performing GWAS of the plasma N-glycome we recently identified HNF1A as the master regulator of plasma protein fucosylation.Citation25 To examine the effects of CpG methylation of HNF1A on plasma glycans we performed an association analysis between methylation levels on four individual CpG sites, which affect HNF1A expression and the plasma N-glycome in 810 individuals. We identified four CpG methylation sites in HNF1A with variable levels of methylation () and, by concurrent analysis of their methylation and the expression of HNF1A in different cell lines, provided evidence for the functional importance of these four sites for the expression of HNF1A ().
While polymorphisms in HNF1A significantly affect fucosylation of plasma proteins,Citation25 contrary to our expectations, we did not observe any association between HNF1A methylation and antennary fucosylation of plasma proteins. We were aware that the majority of plasma glycans originate from proteins produced in the liver, while we were studying methylation of HNF1A in DNA isolated only from peripheral blood nucleated cells (PBNC). However, increasing evidence argues that DNA methylation changes in peripheral blood cells can be a useful proxy for biological endpoints in different tissues and various health outcomes.Citation30 In addition, it was recently reported that some patterns of DNA methylation highly correlate between different human tissues,Citation31 thus we hoped to be able to infer patterns of protein glycosylation in liver from our methylation data measured in PBNC. However, it appears that this is not the case, as we did not observe any association between methylation of HNF1A in PNBC with antennary fucosylation of the major plasma proteins.
Since HNF1A clearly influences fucosylation of plasma proteins,Citation25 we interpret the absence of this association to indicate that the methylation of HNF1A in PBNC differs from methylation of HNF1A in hepatocytes and that it does not follow some general pattern of DNA methylation in the organism. To evaluate this hypothesis further we analyzed LINE-1 methylation in a subset (n = 200) of studied individuals. Since methylation of LINE-1 elements is considered to reflect the level of global methylation,Citation32 the absence of correlation between methylation of HNF1A and LINE-1 confirmed our conclusion that the methylation levels of HNF1A gene in PBNC are established independently of the global DNA methylation patterns and that analysis of methylation in the four analyzed CpG sites in HNF1A in PNBC cannot be used as a proxy for methylation of the same four CpG sites in the liver, which is consistent with tissuespecific action of HNF1A in liver and pancreatic islets.Citation33
The highest statistically significant associations observed were between HNF1A methylation and the highly branched glycan groups GP15 and GP16. This observation was further supported by the association between HNF1A methylation and a derived measure of tetragalactosylated glycans (G4). Although GP15 and GP16 did not show association with HNF1A polymorphisms in our initial study,Citation25 the extended study (comprising samples from two additional populations) found GP15 to be associated with HNF1A,Citation29 which provided further evidence for the association between HNF1A and glycan branching. Other glycan groups for which we observed associations with HNF1A methylation also associated with polymorphisms in HNF1A in that study, although they did not reach genome wide significance (p values of 3.35E-3 and 2.47E-5 for GP16 and G4, respectively, were observed; G. Lauc, unpublished observation). Very recently, a molecular mechanism that could explain this association was identified when it was shown that HNF1A regulates the expression of GnT-4a glycosyltransferase in pancreatic β cells.Citation34 This glycosyltransferase generates the core β1–4 GlcNAc linkage among the N-glycan structures of some glycoproteins and is thus relevant for branching of glycans, which is consistent with our observations. The decrease of HNF1A expression in pancreatic β cells was observed in diabetic mice and humansCitation34 and epigenetic silencing of HNF1A by CpG methylation could be one of the mechanisms leading to the decreased expression of HNF1A in pancreatic β cells.
We then studied the association between HNF1A methylation in PBNC and IgG N-glycan levels. Our a priori expectation was that we would find stronger associations since IgG is produced by B-lymphocytes. However, we observed no statistically significant associations between HNF1A methylation and IgG N-glycans. Since IgG contains only bi-antennary glycans, this finding is not inconsistent with the association between HNF1A and highly branched glycans observed in the plasma glycome. The absence of association with core-fucosylation of IgG was somewhat surprising because we previously reported that HNF1A regulates expression of FUT8 (which codes fucosyltransferase responsible for the addition of core-fucose) in liver and pancreas cell lines.Citation25 The absence of association in this study indicated that this regulatory mechanism does not affect IgG glycosylation. In parallel to these studies we also completed IgG glycome GWAS, which revealed a number of significant associations (manuscript in preparation), but not including HNF1A—again supporting our observation that HNF1A does not influence IgG glycosylation.
The majority of N-glycans in plasma originate from the liver, but the majority of liver glycoproteins do not have tetraantennary glycans,Citation35,Citation36 thus the liver may not be the principal source of tetraantennary glycans in plasma. One possible source of these highly branched glycans in plasma are cells of the immune system, where highly branched glycans are commonly found.Citation37 Recently, we demonstrated that some highly branched N-glycans in plasma contain glucuronic acid.Citation29 This unusual monosaccharide has previously been reported on a subset of human lymphocytesCitation38 and so its appearance in plasma corroborates a lymphocyte origin for these glycoproteins.
To provide further evidence for causal association between epigenetic silencing of HNF1A and glycan branching, we analyzed plasma glycans in patients with HNF1A-MODY. This rare subtype of monogenic diabetes is caused by the presence of inactivating mutations in the HNF1A gene.Citation28 Since one copy of the defective allele is sufficient to cause diabetes, we hypothesized that in these patients the expression of HNF1A should be sufficiently decreased to induce the same type of changes in the plasma glycome composition as in people with higher levels of HNF1A methylation (which suppresses expression of HNF1A). Indeed, a significant increase in highly branched glycans (GP15 and GP16) was observed in HNF1A-MODY patients ().
This study provided the first evidence that epigenetic silencing of HNF1A by CpG methylation is associated with the composition of the plasma glycome. The importance of methylation at the four cytosine sites for the expression of HNF1A was demonstrated by the analysis of cytosine methylation of different cell lines, and the impact of decreased HNF1A transcriptional activity on plasma N-glycome composition was demonstrated by analyzing HNF1A-MODY patients. The observed associations between plasma N-glycans and HNF1A methylation are not very strong, but since plasma glycans originate from different tissues and since we showed that methylation patterns in PBNC do not follow general methylation pattern of an organism, it would be unrealistic to expect strong associations since methylation of HNF1A in PBNC can affect only a small subset of plasma glycans. The absence of association between HNF1A methylation and plasma protein fucosylation indicated that methylation in PBNC is not a good proxy for liver cell methylation in this specific case, and therefore cannot associate with glycosylation of those plasma proteins which originate from the liver, therefore glycoproteins from cells of the immune system are probably the primary source of the observed associations. The combination of (1) consistent statistically significant associations between methylation of HNF1A in PNBC and branching of glycans on plasma glycoproteins consistent with the role of HNF1A in the regulation of GnT-4a glycosyltransferase with (2) strong correlation between HNF1A methylation and expression in different cell lines and (3) the same type of changes in plasma glycome in HNF1A-MODY patients suggest that the observed associations reflect the biologically relevant role of epigenetic regulation of HNF1A in protein glycosylation.
Materials and Methods
Sample population and study design.
Blood samples were collected from unselected examinees from the Croatian Adriatic island Korčula as part of a larger genetic epidemiology program.Citation39–Citation41 Participants were recruited on the basis of the official voting registers and contacts with the local stakeholders and religious communities. Sampling took place in 2007. All examinees were given detailed study information prior to the enrolment, and they had to sign the informed consent to enter the study. The study was approved by the appropriate Ethical Committees in both Croatia and Scotland. Subjects with HNF1A-MODY mutation (confirmed by sequencing in a certified UK diagnostic center) were ascertained from the South of England. The study was approved by the Oxfordshire Local Research Ethics Committee and all subjects gave informed consent.
Simultaneous extraction of DNA and RNA from HepG2, Huh7, HeLa, MCF7, TE1, TE11 and TE13 cell lines for pyrosequencing and expression analysis by quantitative RT-PCR was performed by using an AllPrep DNA/RNA Mini Kit (QIAGEN).
CpG methylation analysis.
Pyrosequencing assays were established for the quantitative measurement of DNA methylation levels in HNF1A gene and LINE-1 elements. Sodium bisulfite modification was performed on 500 ng of extracted DNA using the EZ DNA Methylation-Gold Kit (Zymo Research). The eluted DNA was at a final concentration of 25 ng/µl. Hot-start PCR was performed with HotStartTaq Master Mix kit (Qiagen) using the following primers for HNF1A: 5′-GGA TAA GGG GGA GTT TTG-3′; 5′-CCC CTC TAA ACT CTC CTA-3′ (biotinylated) and LINE1: 5′-TAG GGA GTG TTA GAT AGT GG-3′ (biotinylated); 5′-AAC TCC CTA ACC CCT TAC-3′. Cycling conditions were as follows: an initial denaturation of 15 min at 95°C followed by 50 cycles of 30 sec at 95°C, 30 sec at 54.4°C (HNF1A) or 58°C (LINE1) and 30 sec at 72°C, with a final extension of 10 min at 72°C. To quantify the percentage of methylated cytosine in individual CpG sites, bisulfite-converted DNA was sequenced using a pyrosequencing system (PSQTM 96MA, Biotage, Sweden) in accordance with the manufacturer's protocol (Biotage). This method treats each individual CpG site as a C/T polymorphism and generates quantitative data for the relative proportion of the methylated vs. the unmethylated allele. The following pyrosequencing primers were used: 5′-AAG GGG GAG TTT-3′ (for HNF1A) and 5′-CAA ATA AAA CAA TAC CTC-3′ (for LINE1). The target CpGs were evaluated by converting the resulting pyrograms into numerical values for peak heights and calculating the average of all CpG sites analyzed.
Quantitative RT-PCR.
Reverse transcription reaction of RNA extracted from various cell lines was performed using MMLV-RT (Invitrogen) and random hexamers, according to the manufacturer's protocol. Quantitative real-time PCR (qRTPCR) was performed in triplicates of each condition, using MESA Green qPCR MasterMix Plus Sybr Assay (Eurogentec) and a Mx3000P realtime PCR system (Stratagene). The cycling conditions were as follows: 95°C for 1 min, 40 cycles for 10 sec at 95°C, for 30 sec at 55°C and for 30 sec at 72°C. The relative quantification of HNF1α mRNA was analyzed using the comparative CT method and normalized to that of GAPDH. For amplification, the following primers were used: HNF1qRT1, 5′-AGT GAG TCC GGG CTT CAC AC-3′; HNF1qRT2, 5′-TGA AGG TCT CGA TGA CGC TG-3′; GAPDHqRT1, 5′-AAC GGG AAG CTT GTC ATC AA-3′; GAPDHqRT2, 5′-TGG ACT CCA CGA CGT ACT CA-3′.
Glycan release and labeling.
Glycan release and labeling was performed as reported previously in reference Citation22. Plasma proteins were immobilized in a block of SDS-polyacrylamide gel and N-glycans were released by digestion with recombinant N-glycosidase F. This was done in a 96-well microtiter plate to achieve the best throughput of sample preparation. After extraction, glycans were fluorescently labeled with 2-aminobenzamide.
Hydrophilic interaction high performance liquid chromatography (HILIC).
Glycans released from plasma proteins were subjected to hydrophilic interaction high performance liquid chromatography (HILIC) on a 250 × 4.6 mm i.d. 5 µm particle packed TSKgel Amide 80 column (Tosoh Bioscience, Stuttgart, Germany) at 30°C with 50 mM formic acid adjusted to pH 4.4 with ammonia solution as solvent A and acetonitrile as solvent B. Sixty minute runs were performed with fluorescence detector set with excitation and emission wavelengths of 330 and 420 nm, respectively. The system was calibrated using an external standard of hydrolyzed and 2-AB-labeled glucose oligomers from which the retention times for the individual glycans were converted to glucose units (GU). The chromatograms obtained were all separated in the same manner into 16 chromatographic areas (peaks) for initial profile and into 13 peaks for desialylated glycans, regarding the peak resolutions and similarity of glycan structures present as described before. The amounts of glycans present in each area were expressed as % of total integrated chromatogram (amount of total glycan structures/total serum N-glycome).
Weak anion exchange (WAX)-HPLC.
Glycans were separated according to the number of sialic acids by weak anion exchange HPLC. The analysis was performed using a Prozyme GlycoSep C 75 mm × 7.5 mm column (Prozyme, Leandro, CA) at 30°C with 20% (v/v) acetonitrile in water as solvent A and 0.1 M acetic acid adjusted to pH 7.0 with ammonia solution in 20% (v/v) acetonitrile as solvent B. Compounds were retained on the column according to their charge density, the higher charged compounds being retained the longest. A fetuin N-glycan standard was used for calibration.
Sialidase digestion.
Aliquots of the 2AB-labeled glycan samples were dried down in 96-well PCR plates. To these, the following was added: 1 µl of 250 mM sodium phosphate incubation buffer (pH 6.0), 0.5 µl (0.0025 U) of ABS, Arthrobacter ureafaciens sialidase (releases α2-3,6,8 sialic acid, Prozyme) and H2O to make up to 5 µl. This was incubated overnight (16–18 h) at 37°C and then passed through AcroPrep™ 96 Filter Plates, 350 µL well, 10K (Pall Corporation, Port Washington, NY) before applying to the HPLC.
Isolation of IgG.
Prior to use, the monolithic plate was washed with 10 column volumes (CV) of ultra pure water and then equilibrated with 10 CV of binding buffer (1x PBS, pH 7.4). Plasma samples (50 µl) were diluted 10x with the binding buffer and applied to the Protein G plate. The filtration of the samples was completed in approximately 5 min. The plate was then washed five times with 5 CV of binding buffer to remove unbound proteins. IgG was released from the protein G monoliths using 5 CV of elution solvent (0.1 M formic acid, pH 2.5). Eluates were collected in a 96 deep well plate and immediately neutralized to pH 7.0 with neutralization buffer (1 M ammonium bicarbonate) to maintain the IgG stability. After each sample application, the monoliths were regenerated with the following buffers: 10 CV of 10x PBS, followed by 10 CV of 0.1 M formic acid and afterwards 10 CV of 1x PBS to re-equilibrate the monoliths. Each step of the chromatographic procedure was done under vacuum (cca. 60 mmHg pressure reduction while applying the samples, 500 mmHg during elution and washing steps) using a manual set-up consisting of a multichannel pipette, a vacuum manifold (Beckman Coulter, Brea, CA) and a vacuum pump (Pall Life Sciences, Ann Arbor, MI). If the plate was not used for a short period, it was stored in 20% ethanol (v/v) at 4°C.
The purity of the isolated IgG was verified by SDS-PAGE with NuPAGE Novex 4–12% Bis-Tris gels in an Xcell SureLock Mini-Cell (Invitrogen) according to the manufacturer. Precision Plus Protein All Blue Standards (BioRad, Hercules, CA) was used as the molecular weight marker. The gels were run at 180 V for 45 min, stained with GelCode Blue (Pierce) and visualized by a VersaDoc Imaging System (BioRad).
UPLC analysis of IgG glycans.
Fluorescently labeled N-glycans were separated by ultra performance liquid chromatography on a Waters Acquity UPLC instrument consisting of a quaternary solvent manager, sample manager and a FLR fluorescence detector set with excitation and emission wavelengths of 330 and 420 nm, respectively. The instrument was under the control of Empower 2 software, build 2145 (Waters, Milford, MA). Labeled N-glycans were separated on a Waters BEH Glycan chromatography column, 100 × 2.1 mm i.d., 1.7 µm BEH particles, with 100 mM ammonium formate, pH 4.4, as solvent A and acetonitrile as solvent B. Recently reported methods for UPLC profiling of glycansCitation42,Citation43 were used as a starting point for the development of the separation method which used linear gradient of 75–62% acetonitrile at flow rate of 0.4 mL/min in a 20 min analytical run. Samples were maintained at 5°C prior to injection, and the separation temperature was 60°C. The system was calibrated using an external standard of hydrolyzed and 2-AB labeled glucose oligomers from which the retention times for the individual glycans were converted to glucose units (GU). Data processing was performed using an automatic processing method with a traditional integration algorithm after which each chromatogram was manually corrected to maintain the same intervals of integration for all the samples. The chromatograms obtained were all separated in the same manner into 24 peaks and the amount of glycans in each peak was expressed as % of total integrated area.
Statistical analysis.
The descriptive part of this study was based on non-parametric methods since deviations from normal distribution were observed. Correlations were performed with Spearman's rank test and gender differences were tested with the Mann-Whitney test. The basic analysis was performed in genealogy-unlinked individuals, in order not to bias the results with sample relatedness. SPSS version 13 was used in the analysis (SPSS Inc., Chicago, IL). Significance was set at p < 0.001 to account for simultaneous testing of multiple glycan structures. For the second analysis glycan traits were adjusted for age, sex and pc1–3 (accounts for relatedness). Pearson correlation coefficients calculated for adjusted glycan measures vs. each methylation position.
Disclosure of Potential Conflicts of Interest
No potential conflicts of interest were disclosed.
Author Contributions
V.Z. and G.L. designed the study and led writing of the manuscript; H.C., C.H., A.F.W., I.R., K.O., M.I.M. and Z.H. designed the study and helped with data interpretation and writing of the manuscript; T.H., M.N., C.C., A.K., M.P. and O.G. performed laboratory analysis and checked the manuscript for intellectual contact; J.H. and O.P. performed statistical analysis and checked the manuscript for intellectual contact.
Figures and Tables
Figure 1 Distribution of CpG methylation at four sites in HNF1A in a population. Central box represents the methylation values (the percentage of methylated cytosines at a specific site) from the lower to upper quartile (25 to 75 percentile). The middle line represents the median. The vertical line extends from the minimum to the maximum value, excluding “outside” and “far out” values which are displayed as separate points.
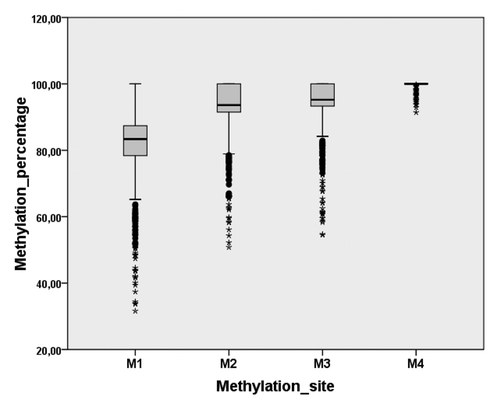
Figure 2 CpG methylation and expression of HNF1A in different cell lines. CpG methylation and expression of HNF1A were quantified in seven cell lines. Expression levels are normalized to expression in Huh7 cell line. Methylation levels are shown as average percentage of methylation on four analyzed CPG sites.
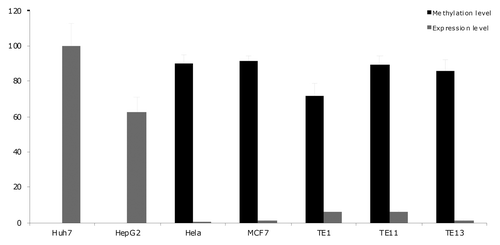
Figure 3 Structures of glycans separated by HP LC-HILIC analysis of the plasma glycome. Individual glycan structures in each HP LC peak were reported previously in reference Citation22, and are given using Oxford notation.Citation26
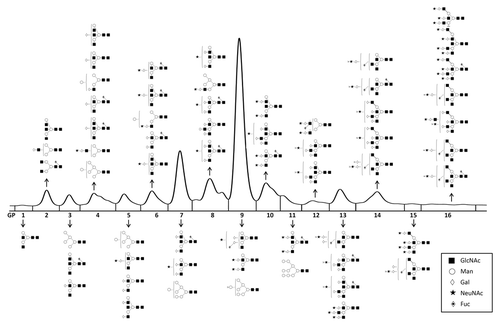
Figure 4 Highly branched N-glycans on plasma proteins (GP15 and GP16) are significantly increased in individuals with HNF1A-MODY subtype of diabetes. Central box represents the values from the lower to upper quartile (25–75th percentile). The middle line represents the median. The horizontal line extends from the minimum to the maximum value, excluding “outside” and “far out” values which are displayed as separate points. For GP15 p = 1.3E-14 and for GP16 p = 1.2E-3.
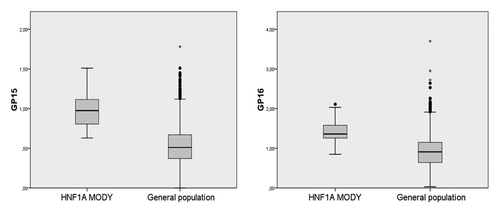
Table 1 Associations between HNF1A methylation and plasma N-glycans
Additional material
Download Zip (299.8 KB)Acknowledgments
This work was supported by the Croatian Ministry of Science, Education and Sport grant #309-0061194-2023 (to G.L.) and #119-1191196-1224 (to V.Z.), by the Croatian Science Foundation grant #04-47 to I.R., by grants from la Ligue Nationale (Française) Contre le Cancer (France) and the Association pour la Recherche sur le Cancer (ARC, France) to ZH, by the European Commission grants EuroGlycoArrays, GlycoBioM, HighGlycan and CEED3, and by AUF PSCI Grant. Plasma and DNA samples from the inhabitants of Korcula island were collected with support of the FP6 EuroSpan project, the Royal Society, and the Chief Scientist Office of the Scottish Government.
Related Research Data
References
- Lister R, Pelizzola M, Dowen RH, Hawkins RD, Hon G, Tonti-Filippini J, et al. Human DNA methylomes at base resolution show widespread epigenomic differences. Nature 2009; 462:315 - 322; PMID: 19829295; http://dx.doi.org/10.1038/nature08514
- Aguilera O, Fernández AF, Muñoz A, Fraga MF. Epigenetics and environment: a complex relationship. J Appl Physiol 2010; 109:243 - 251; PMID: 20378707; http://dx.doi.org/10.1152/japplphysiol.00068.2010
- Vaissière T, Hung RJ, Zaridze D, Moukeria A, Cuenin C, Fasolo V, et al. Quantitative analysis of DNA methylation profiles in lung cancer identifies aberrant DNA methylation of specific genes and its association with gender and cancer risk factors. Cancer Res 2009; 69:243 - 252; PMID: 19118009; http://dx.doi.org/10.1158/0008-5472.CAN-08-2489
- Fraga MF, Ballestar E, Paz MF, Ropero S, Setien F, Ballestar ML, et al. Epigenetic differences arise during the lifetime of monozygotic twins. Proc Natl Acad Sci USA 2005; 102:10604 - 10609; PMID: 16009939; http://dx.doi.org/10.1073/pnas.0500398102
- Lauc G, Zoldoš V. Protein glycosylation—an evolutionary crossroad between genes and environment. Mol Biosyst 2010; 6:2373 - 2379; PMID: 20957246; http://dx.doi.org/10.1039/c0mb00067a
- Apweiler R, Hermjakob H, Sharon N. On the frequency of protein glycosylation, as deduced from analysis of the SWISS-PROT database. Biochim Biophys Acta 1999; 1473:4 - 8; PMID: 10580125; http://dx.doi.org/10.1016/S0304-4165(99)00165-8
- Marek KW, Vijay IK, Marth JD. A recessive deletion in the GlcNAc-1-phosphotransferase gene results in peri-implantation embryonic lethality. Glycobiology 1999; 9:1263 - 1271; PMID: 10536042; http://dx.doi.org/10.1093/glycob/9.11.1263
- Skropeta D. The effect of individual N-glycans on enzyme activity. Bioorg Med Chem 2009; 17:2645 - 2653; PMID: 19285412; http://dx.doi.org/10.1016/j.bmc.2009.02.037
- Dennis JW, Nabi IR, Demetriou M. Metabolism, cell surface organization and disease. Cell 2009; 139:1229 - 1241; PMID: 20064370; http://dx.doi.org/10.1016/j.cell.2009.12.008
- Crocker PR, Paulson JC, Varki A. Siglecs and their roles in the immune system. Nat Rev Immunol 2007; 7:255 - 266; PMID: 17380156; http://dx.doi.org/10.1038/nri2056
- Marth JD, Grewal PK. Mammalian glycosylation in immunity. Nat Rev Immunol 2008; 8:874 - 887; PMID: 18846099; http://dx.doi.org/10.1038/nri2417
- Ohtsubo K, Marth JD. Glycosylation in cellular mechanisms of health and disease. Cell 2006; 126:855 - 867; PMID: 16959566; http://dx.doi.org/10.1016/j.cell.2006.08.019
- Lauc G. Sweet secret of the multicellular life. Biochim Biophys Acta 2006; 1760:525 - 526; PMID: 16431025
- Taniguchi N, Honke K, Fukuda M. Handbook of glycosyltransferases and related genes 2002; Tokyo Springer Verlag
- Abbott KL, Nairn AV, Hall EM, Horton MB, McDonald JF, Moremen KW, et al. Focused glycomic analysis of the N-linked glycan biosynthetic pathway in ovarian cancer. Proteomics 2008; 8:3210 - 3220; PMID: 18690643; http://dx.doi.org/10.1002/pmic.200800157
- Nairn AV, York WS, Harris K, Hall EM, Pierce JM, Moremen KW. Regulation of glycan structures in animal tissues: transcript profiling of glycan-related genes. J Biol Chem 2008; 283:17298 - 17313; PMID: 18411279; http://dx.doi.org/10.1074/jbc.M801964200
- Freeze HH. Genetic defects in the human glycome. Nat Rev Genet 2006; 7:537 - 551; PMID: 16755287; http://dx.doi.org/10.1038/nrg1894
- Zoldoš V, Grgurevic S, Lauc G. Epigenetic regulation of protein glycosylation. Biomol Concepts 2010; 1:253 - 261; http://dx.doi.org/10.1515/BMC.2010.027
- Royle L, Campbell MP, Radcliffe CM, White DM, Harvey DJ, Abrahams JL, et al. HPLC-based analysis of serum N-glycans on a 96-well plate platform with dedicated database software. Anal Biochem 2008; 376:1 - 12; PMID: 18194658; http://dx.doi.org/10.1016/j.ab.2007.12.012
- Huhn C, Selman MH, Ruhaak LR, Deelder AM, Wuhrer M. IgG glycosylation analysis. Proteomics 2009; 9:882 - 913; PMID: 19212958; http://dx.doi.org/10.1002/pmic.200800715
- Selman MH, McDonnell LA, Palmblad M, Ruhaak LR, Deelder AM, Wuhrer M. Immunoglobulin G glycopeptide profiling by matrix-assisted laser desorption ionization Fourier transform ion cyclotron resonance mass spectrometry. Anal Chem 2010; 82:1073 - 1081; PMID: 20058878; http://dx.doi.org/10.1021/ac9024413
- Knezevic A, Polašek O, Gornik O, Rudan I, Campbell H, Hayward C, et al. Variability, heritability and environmental determinants of human plasma N-glycome. J Proteome Res 2009; 8:694 - 701; PMID: 19035662; http://dx.doi.org/10.1021/pr800737u
- Gornik O, Wagner J, Pucic M, Knezevic A, Redžic I, Lauc G. Stability of N-glycan profiles in human plasma. Glycobiology 2009; 19:1547 - 1553; PMID: 19726492; http://dx.doi.org/10.1093/glycob/cwp134
- Kneževic A, Gornik O, Polašek O, Pucic M, Redzic I, Novokmet M, et al. Effects of aging, body mass index, plasma lipid profiles and smoking on human plasma N-glycans. Glycobiology 2010; 20:959 - 969; PMID: 20356825; http://dx.doi.org/10.1093/glycob/cwq051
- Lauc G, Essafi A, Huffman JE, Hayward C, Kneževic A, Kattla JJ, et al. Genomics meets glycomics-the first GWAS study of human N-Glycome identifies HNF1α as a master regulator of plasma protein fucosylation. PLoS Genet 2010; 6:1001256; PMID: 21203500; http://dx.doi.org/10.1371/journal.pgen.1001256
- Harvey DJ, Merry AH, Royle L, Campbell MP, Dwek RA, Rudd PM. Proposal for a standard system for drawing structural diagrams of N- and O-linked carbohydrates and related compounds. Proteomics 2009; 9:3796 - 3801; PMID: 19670245; http://dx.doi.org/10.1002/pmic.200900096
- Pucic M, Knezevic A, Vidic J, Adamczyk B, Novokmet M, Polasek O, et al. High throughput isolation and glycosylation analysis of IgG-variability and heritability of the IgG glycome in three isolated human populations. Mol Cell Proteomics 2011; 10:111 - 10090; PMID: 21653738; http://dx.doi.org/10.1074/mcp.M111.010090
- Molven A, Njølstad PR. Role of molecular genetics in transforming diagnosis of diabetes mellitus. Expert Rev Mol Diagn 2011; 11:313 - 320; PMID: 21463240
- Huffman JE, Knezevic A, Vitart V, Kattla J, Adamczyk B, Novokmet M, et al. Polymorphisms in B3GAT1, SLC9A9 and MGAT5 are associated with variation within the human plasma N-glycome of 3533 European adults. Hum Mol Genet 2011; 20:5000 - 5011; PMID: 21908519; http://dx.doi.org/10.1093/hmg/ddr414
- Terry MB, Delgado-Cruzata L, Vin-Raviv N, Wu HC, Santella RM. DNA methylation in white blood cells: association with risk factors in epidemiologic studies. Epigenetics 2011; 6:828 - 837; PMID: 21636973; http://dx.doi.org/10.4161/epi.6.7.16500
- Byun HM, Siegmund KD, Pan F, Weisenberger DJ, Kanel G, Laird PW, et al. Epigenetic profiling of somatic tissues from human autopsy specimens identifies tissue- and individual-specific DNA methylation patterns. Hum Mol Genet 2009; 18:4808 - 4817; PMID: 19776032; http://dx.doi.org/10.1093/hmg/ddp445
- Chalitchagorn K, Shuangshoti S, Hourpai N, Kongruttanachok N, Tangkijvanich P, Thong-ngam D, et al. Distinctive pattern of LINE-1 methylation level in normal tissues and the association with carcinogenesis. Oncogene 2004; 23:8841 - 8846; PMID: 15480421; http://dx.doi.org/10.1038/sj.onc.1208137
- Servitja JM, Pignatelli M, Maestro MA, Cardalda C, Boj SF, Lozano J, et al. Hnf1alpha (MODY3) controls tissue-specific transcriptional programs and exerts opposed effects on cell growth in pancreatic islets and liver. Mol Cell Biol 2009; 29:2945 - 2959; PMID: 19289501; http://dx.doi.org/10.1128/MCB.01389-08
- Ohtsubo K, Chen MZ, Olefski JM, Marth JD. Pathway to diabetes through attenuation of pancreatic beta cell glycosylation and glucose transport. Nat Med 2011; 17:1067 - 1075; PMID: 21841783
- Klein A. Human total serum N-glycome. Adv Clin Chem 2008; 46:51 - 85; PMID: 19004187; http://dx.doi.org/10.1016/S0065-2423(08)00402-2
- Stumpo KA, Reinhold VN. The N-glycome of human plasma. J Proteome Res 2010; 9:4823 - 4830; PMID: 20690605; http://dx.doi.org/10.1021/pr100528k
- Haslam SM, Julien S, Burchell JM, Monk CR, Ceroni A, Garden OA, et al. Characterizing the glycome of the mammalian immune system. Immunol Cell Biol 2008; 86:564 - 573; PMID: 18725885; http://dx.doi.org/10.1038/icb.2008.54
- Morita I, Kizuka Y, Kakuda S, Oka S. Expression and function of the HNK-1 carbohydrate. J Biochem 2008; 143:719 - 724; PMID: 18024472; http://dx.doi.org/10.1093/jb/mvm221
- Rudan I, Biloglav Z, Vorko-Jovic A, Kujundzic-Tiljak M, Stevanovic R, Ropac D, et al. Effects of inbreeding, endogamy, genetic admixture and outbreeding on human health: a (1001 Dalmatians) study. Croat Med J 2006; 47:601 - 610; PMID: 16909458
- Rudan I, Campbell H, Rudan P. Genetic epidemiological studies of eastern Adriatic Island isolates, Croatia: objective and strategies. Coll Antropol 1999; 23:531 - 546; PMID: 10646227
- Rudan I, Marusic A, Jankovic S, Rotim K, Boban M, Lauc G, et al. “10001 Dalmatians:” Croatia launches its national biobank. Croat Med J 2009; 50:4 - 6; PMID: 19260138; http://dx.doi.org/10.3325/cmj.2009.50.4
- Ahn J, Bones J, Yu YQ, Rudd PM, Gilar M. Separation of 2-aminobenzamide labeled glycans using hydrophilic interaction chromatography columns packed with 1.7 microm sorbent. J Chromatogr B Analyt Technol Biomed Life Sci 2010; 878:403 - 408; PMID: 20036624; http://dx.doi.org/10.1016/j.jchromb.2009.12.013
- Bones J, Mittermayr S, O'Donoghue N, Guttman A, Rudd PM. Ultra performance liquid chromatographic profiling of serum N-glycans for fast and efficient identification of cancer associated alterations in glycosylation. Anal Chem 2010; 82:10208 - 10215; PMID: 21073175; http://dx.doi.org/10.1021/ac102860w