Abstract
5-Hydroxymethyl-cytosine (5-hmC) is a form of modified cytosine, which has recently attracted a considerable attention due to its potential role in transcriptional regulation. According to several reports 5-hydroxymethyl-cytosine distribution is tissue-specific in mammals. Thus, 5-hmC is enriched in embryonic cell populations and in adult neuronal tissue. Here, we describe a novel method of semi-quantitative immunohistochemical detection of 5-hmC and utilize it to assess the levels of this modification in amphibian tissues. We show that, similar to mammalian embryos, 5-hmC is enriched in axolotl tadpoles compared with adult tissues. Our data demonstrate that 5-hmC distribution is tissue-specific in amphibians, and that strong 5-hmC enrichment in neuronal cells is conserved between amphibians and mammals. In addition, we identify 5-hmC-enriched cell populations that are distributed in amphibian skin and connective tissue in a mosaic manner. Our results illustrate that immunochemistry can be successfully used not only for spatial identification of cells enriched with 5-hmC, but also for the semi-quantitative assessment of the levels of this epigenetic modification in single cells of different tissues.
5-Hydroxymethyl-cytosine (5-hmC) is a form of modified cytosine, which has recently attracted a considerable attention due to its potential role in transcriptional regulation and its possible involvement in embryonic stem cells (ESCs) maintenance and differentiation.Citation1,Citation2 The conversion of 5-mC to 5-hmC is catalyzed by Tet (Ten-11 translocation) oncogene family member proteins.Citation3 According to several recent reports 5-hydroxymethyl-cytosine distribution is tissue-specific in mammals.Citation3–Citation6 Thus 5-hmC is highly enriched in mouse and human embryonic cell populations and in adult neuronal tissue.Citation3–Citation6 A number of approaches to 5-hmC detection have been employed. Several of them include a range of biochemical methods based on thin layer chromatography (TLC),Citation4 liquid chromatography coupled with mass-spectrometry,Citation6 capillary electrophoresis coupled with laser induced fluorescence,Citation7 enzymaticCitation8,Citation9 or immunologicalCitation10 quantification of 5-hmC levels. These techniques are quantitative but do not supply information concerning the spatial distribution of 5-hmC in different cell types. In contrast, immunocytochemistry and immunohistochemistry provide spatial data, but are not generally considered quantitative.
Here we describe a novel method of semi-quantitative immunohistochemical detection of 5-hmC and utilize it to assess the levels of this modification in a range of amphibian (axolotl, Ambystoma mexicanum) tissues. Our data demonstrate that 5-hmC distribution is tissue-specific in amphibians, and that strong 5-hmC enrichment in neuronal cells is conserved between amphibians and mammals. In addition, we identify cell populations containing high levels of 5-hmC that are distributed in amphibian skin and connective tissue in a mosaic manner.
Previously we characterized the 5-hmC distribution in mammalian development employing a standard non-quantitative immunochemical staining procedure based on the use of peroxidase-conjugated secondary antibody coupled with a tyramide signal enhancement system.Citation5 Using this method we were able to detect 5-hmC in a range of mouse embryonic tissues.Citation5 Thus immunostaining of 17.5 d post coitum (dpc) mouse embryonic skin reveals a 5-hmC signal in the majority of embryonic epithelial and fibroblast cells (Fig. S1A). Since the amount of peroxidase-conjugated secondary antibody in such an immunostaining reaction is expected to be proportional to the amount of primary antibody and ultimately to the amount of antigen (5-hmC) in the specimen, we decided to assess the kinetics of peroxidase reaction with its fluorescent substrate by quantifying the staining intensity on serial adjacent embryonic sections at different times of incubation with tyramide. Assuming that we could detect the rate of peroxidase reaction in its initial linear phase, this would allow us to semi-quantitatively assess the levels of 5-hmC in different specimens, which would be proportional to the velocities of corresponding peroxidase reactions (Δ Intensity/Δ Time, visually represented by a slope of a reaction progress curve).Citation11 At 1:5,000 dilution of primary antibody, which we used initially, the progress curve of the reaction became saturated at very short times of incubation with tyramide (Fig. S1C and upper part). In order to detect the linear initial rate period of the reaction's progress curve, we decreased the amount of peroxidase enzyme in the immunostaining by diluting the primary (anti-5-hmC) antibody. We performed the same staining experiment with primary antibody diluted at 1:50,000 and 1:500,000 (Fig. S1B and C). Immunostaining with primary antibody at 1:500,000 dilution did not produce detectable signal at any time of incubation (data not shown), but at 1:50,000 primary antibody dilution the progress curve of the reaction was very close to linear (Fig. S1C and lower part). Based on these data we concluded that primary antibody at 1:5,000 dilution can be used exclusively for qualitative experiments. By contrast, the progress curve observed using a 1:50,000 dilution of primary antibody suggests that the levels of 5-hmC can be assessed semi-quantitatively at this reduced antibody level. Therefore, to test if we could evaluate the 5-hmC levels in tissues semi-quantitatively using this technique, we performed the immunostaining of serial adjacent sections of mouse brain and heart, since strong differences in the 5-hmC levels of these organs have been reported by several independent studies.Citation4–Citation8 Indeed, the progress curves obtained from these tissues were significantly different, with reaction velocities values 0.62 and 0.17 for brain and heart, respectively (Fig. S2). These results are in agreement with published data, which show enriched 5-hmC in brain neuronal tissue compared with heart and other adult murine cell types.Citation4,Citation5,Citation7,Citation10
The distribution of 5-hmC has been studied only in mammalian tissues to date; therefore whether it plays a conserved function is unknown. Amphibian genomes contain orthologs of at least two Tet genes, Tet2 and Tet3 () and transcripts of the Tet3 homolog are expressed from gastrulation onwards as well as in a wide range of adult Xenopus tropicalis tissues (). To test if 5-hmC is conserved in vertebrates we decided to look at its distribution in axolotl and Xenopus. Evaluating the levels of 5-hmC qualitatively, using 1:5,000 dilution of primary antibody, we performed an immunostaining of axolotl tadpole sections and adult tissues from Xenopus laevis and axolotl (Ambystoma mexicanum). Similar to mammalian embryosCitation5 most of axolotl tadpole tissues were strongly enriched in 5-hmC with lower levels of this epigenetic mark in tadpole epithelial cells (). High levels of 5-hmC were detected in the neural tissue of Xenopus spinal cord but not in intestine, skeletal or heart muscle (). Both axolotl neural tissue ( and brain, spinal cord) and skeletal muscle ( and muscle) exhibited high levels of 5-hmC. At the same time this modification was undetectable in the overwhelming majority of gut, liver and cartilage cells ( and S3 and data not shown). Interestingly, although most of axolotl skin and connective tissue cells did not exhibit any 5-hydroxymethyl-cytosine signal we identified a population of 5-hmC enriched cells distributed in a mosaic pattern throughout these tissues ( and S3). These cells were particularly abundant in gills, the epithelial layer of axolotl skin, and in connective tissue adjacent to the cartilage formations. A similar mosaic distribution of 5-hmC enriched cells was observed in Xenopus laevis adult skin ( and S4). As expected, 5-methyl-cytosine was present at equally high levels in all the tested Xenopus and axolotl tissues ().
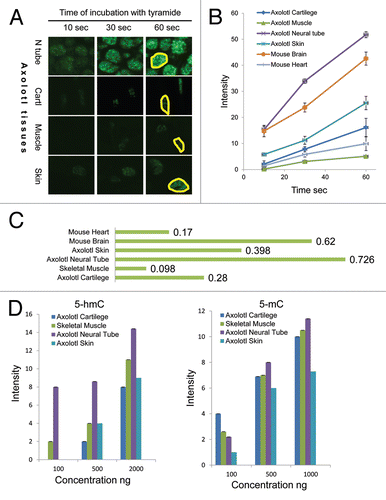
Since we detected a strong 5-hmC signal in both axolotl neural tube and skeletal muscle cells, which was different to our results with mammalian tissues,Citation5 we decided to evaluate 5-hmC levels in these tissues semi-quantitatively. Quantification of our staining results in experiments with 1:50,000 primary antibody dilution revealed that axolotl neural cells were strongly 5-hmC enriched compared with skeletal muscle cells ( and S5). Thus 5-hmC signal was detectable in neural tube at the shortest times of incubation with tyramide (10 sec). The neural tube reaction progress curve was significantly different from that of skeletal muscle; however, it was similar to the progress curve obtained by quantification of mouse brain staining, with respective reaction velocities of 0.726 and 0.62 ( and S5). In contrast, progress curves generated from axolotl skeletal muscle and mouse heart contained slopes that were again similar, but much less steep than neural tissue (reaction velocities 0.098 and 0.17, respectively) ( and S5). Based on the reaction velocities' calculation we estimate that axolotl neural tissue contains approximately 7 times more 5-hmC than skeletal muscle. Further, experiments with the 1:50,000 antibody dilution showed that reaction velocities indicating relative levels of 5-hmC in axolotl skin (0.398) and connective tissue (0.28) were intermediate between these two groups, (), thus these cells also exhibit relatively high 5-hmC content compared with skeletal muscle. However, in the majority of skin and connective tissue cells, we were not able to detect 5-hydroxymethylcytosine using any dilution of anti-5-hmC antibody. To ensure that our staining results were not affected by tissue-embedding procedures we assessed the 5-hmC and 5-mC contents of total DNA extracted from axolotl neural tissue, muscle, cartilage and skin using a dot-blot assay. While 5-mC was present in all the tested axolotl tissues at similar levels, the 5-hmC signal was significantly higher in axolotl neural tissue compared with skin, cartilage and skeletal muscle (). These results agree with our immunohistochemical data, since, according to them, only a proportion of axolotl skin and cartilage cells exhibit high levels of 5-hmC, whereas it cannot be detected in the rest of the cells in these tissues. Thus the quantification of our results shows that 5-hmC distribution is tissue-specific in amphibians. Among the tissues tested, axolotl neural tube cells have the highest 5-hmC content, comparable with that of mammalian neuronal cells.
Our data show that tissue specificity of 5-hmC distribution is conserved between amphibians and mammals. Neuronal cells are strongly enriched with 5-hmC compared with the rest of tissues in both groups of vertebrates. At the same time, the presence of 5-hmC-enriched cell populations in amphibian skin and connective tissue represents an important difference in patterns of tissue distribution of this modification between the two vertebrate groups. In conclusion, our results illustrate that immunochemistry can be successfully used not only for spatial identification of cells enriched with 5-hmC, but also for the semi-quantitative assessment of the levels of this epigenetic modification in single cells of different tissues.
Disclosure of Potential Conflicts of Interest
No potential conflicts of interest were disclosed.
Figures and Tables
Figure 1 (A) A bootstrap consensus tree inferred using Neighbor-Joining from 100 replicates showing the relationships between Xenopus, zebrafish, chick, mouse and human Tet protein sequences. Although the tree gives the appearance of rooting, it is essentially unrooted. The root is placed at the midpoint of the tree to simplify the presentation. The percentages of replicate trees in which the associated taxa clustered together are shown next to the branches. (B) The developmental stage and tissue distribution of Xenopus tropicalis Tet2 and 3 transcripts is determined from NCBI UniGene EST profiles (Tet2:Str.52041 Tet3:Str.53063). Transcript counts are reported in TPM (transcripts per million). (C–G) Immunohistochemical detection of 5-hmC and 5-mC in the tissues of axolotl tadpole. Immunostaining for 5-hmC, 5-mC and merge views are shown. The locations of (D–G) views are indicated with dotted squares on (C).
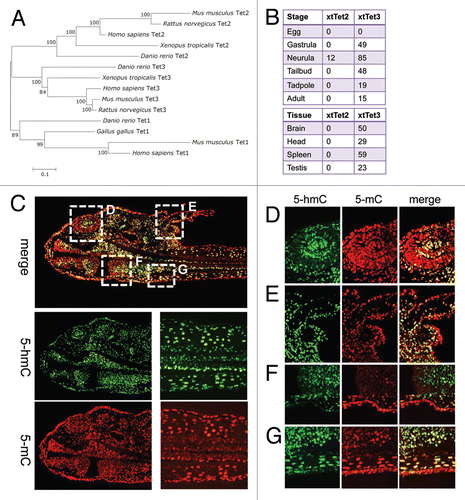
Figure 2 The distribution of 5-hydroxymethyl-cytosine in adult Xenopus (A) and axolotl (B and C) tissues. 5-hydroxymethylcytsoine and 5-methyl-cytosine have been detected in indicated tissues using 1:5,000 dilution of anti-5-hmC antibody. Immunostaining for 5-hmC, 5-mC and merge views are shown. Skel muscle-skeletal muscle. Scale bars are 20 µm.
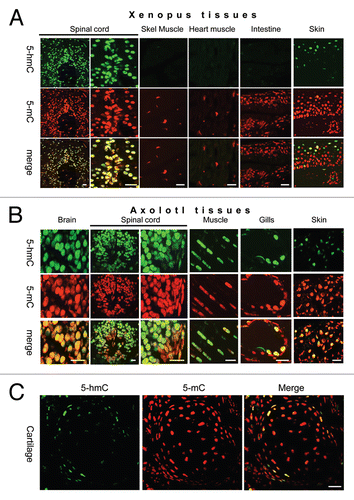
Figure 3 The semi-quantitative assessment of 5-hmC distribution in adult axolotl tissues. (A) 5-hmC immunostaining signal using 1:50,000 dilution of primary antibody at indicated times of incubation with tyramide on sections of axolotl spinal cord (neural tube, N tube), skeletal muscle (Muscle), skin and connective tissue adjacent to cartilage (Cartl). Adjacent sections were stained in parallel at identical conditions with different times of incubation with tyramide. The exposures are identical for all the presented pictures. Examples of regions, which were used for signal quantification, are shown with yellow-line shapes. (B) The progress curves of peroxidase reactions produced by quantification of immunostaining data for different axolotl and mouse tissues. “Skin” and “cartilage” refers to 5-hmC enriched cells found in these tissues. Most of skin and cartilage cells do not exhibit any detectable staining at any times of incubation with tyramide (A). (C) The velocities of peroxidase reactions for different axolotl and mouse tissues (indicated). (D) The quantification of the dot-blot results performed with a total DNA derived from the indicated axolotl tissues using anti-5-hmC (5-hmC) and anti-5-mC (5-mC) antibodies. The graphs show the dependence of the dot-blot signal intensity of different concentrations of total DNA (indicated).
Additional material
Download Zip (608.3 KB)Acknowledgments
We thank Lorraine Young (STEM, University of Nottingham) for supporting this study and Alexander Kondrashev (University of Nottingham) for help. The authors declare no conflict of interest.
Related Research Data
References
- Ito S, D'Alessio AC, Taranova OV, Hong K, Sowers LC, Zhang Y. Role of Tet proteins in 5mC to 5 hmC conversion, ES-cell self-renewal and inner cell mass specification. Nature 2010; 466:1129 - 1133; PMID: 20639862; http://dx.doi.org/10.1038/nature09303
- Ficz G, Branco MR, Seisenberger S, Santos F, Krueger F, Hore TA, et al. Dynamic regulation of 5-hydroxymethyl-cytosine in mouse ES cells and during differentiation. Nature 2011; 473:398 - 402; http://dx.doi.org/10.1038/nature10008
- Tahiliani M, Koh KP, Shen Y, Pastor WA, Bandukwala H, Brudno Y, et al. Conversion of 5-methylcytosine to 5-hydroxymethylcytosine in mammalian DNA by MLL partner TET1. Science 2009; 324:930 - 935; PMID: 19372391; http://dx.doi.org/10.1126/science.1170116
- Kriaucionis S, Heintz N. The nuclear DNA base 5-hydroxymethylcytosine is present in Purkinje neurons and the brain. Science 2009; 324:929 - 930; PMID: 19372393; http://dx.doi.org/10.1126/science.1169786
- Ruzov A, Tsenkina Y, Serio A, Dudnakova T, Fletcher J, Bai Y, et al. Lineage-specific distribution of high levels of genomic 5-hydroxymethylcytosine in mammalian development. Cell Res 2011; 21:1332 - 1342; PMID: 21747414; http://dx.doi.org/10.1038/cr.2011.113
- Globisch D, Münzel M, Müller M, Michalakis S, Wagner M, Koch S, et al. Tissue distribution of 5-hydroxymethyl-cytosine and search for active demethylation intermediates. PLoS One 2010; 5:15367; http://dx.doi.org/10.1371/journal.pone.0015367
- Krais AM, Park YJ, Plass C, Schmeiser HH. Determination of genomic 5-hydroxymethyl-2′-deoxycytidine in human DNA by capillary electrophoresis with laser induced fluorescence. Epigenetics 2011; 6:560 - 565; PMID: 21593596; http://dx.doi.org/10.4161/epi.6.5.15678
- Szwagierczak A, Bultmann S, Schmidt CS, Spada F, Leonhardt H. Sensitive enzymatic quantification of 5-hydroxymenthyl-cytosine in genomic DNA. Nucleic Acids Res 2010; 38:181; http://dx.doi.org/10.1093/nar/gkq684
- Song CX, Szulwach KE, Fu Y, Dai Q, Yi C, Li X, et al. Selective chemical labeling reveals the genome-wide distribution of 5-hydroxymethylcytosine. Nat Biotechnol 2011; 29:68 - 72; PMID: 21151123; http://dx.doi.org/10.1038/nbt.1732
- Li W, Liu M. Distribution of 5-hydroxymethylcytosine in different human tissues. J Nucleic Acids 2011; 2011:870726; PMID: 21772996; http://dx.doi.org/10.4061/2011/870726
- Danson M, Eisenthal R. Enzyme assays: a practical approach 2002; Oxford [Oxfordshire] Oxford University Press