Abstract
Gnotobiotic rodents provide an important technique to study the functional roles of commensal bacteria in host physiology and pathophysiology. To ensure sterility, these animals must be screened frequently for contamination. The traditional screening approaches of culturing and Gram staining feces have inherent limitations, as many bacteria are uncultivable and fecal Gram stains are difficult to interpret. Thus, we developed and validated molecular methods to definitively detect and identify contamination in germ-free (GF) and selectively colonized animals. Fresh fecal pellets were collected from rodents housed in GF isolators, spontaneously contaminated ex-GF isolators, selectively colonized isolators and specific pathogen-free (SPF) conditions. DNA isolated from mouse and rat fecal samples was amplified by polymerase chain reaction (PCR) and subjected to quantitative PCR (qPCR) using universal primers that amplify the 16S rRNA gene from all bacterial groups. PCR products were sequenced to identify contaminating bacterial species. Random amplification of polymorphic DNA (RAPD) PCR profiles verified bacterial inoculation of selectively colonized animals. These PCR techniques more accurately detected and identified GF isolator contamination than current standard approaches. These molecular techniques can be utilized to more definitively screen GF and selectively colonized animals for bacterial contamination when Gram stain and/or culture results are un-interpretable or inconsistent.
Introduction
The role of the indigenous microbiota in human health and disease has received a great deal of attention in the last decade. Gnotobiotic (from the Greek roots gnotos, “known,” and bios, “life”) rodents, reared under germ-free (GF) conditions, with or without subsequent exposure during postnatal life or adulthood to single or combinations of microbial species, provide an excellent system for controlling microbial community composition and housing conditions. Gnotobiology has greatly facilitated our understanding of the contribution of commensal bacteria to host developmental, physiologic and pathophysiologic processes.Citation1 It has revealed some of the operating principles that underlie host-microbial and microbial-microbial relationships, including the discoveries that commensal bacteria affect the structure of mucosal surfaces and contribute to the development, organization and function of the immune system.Citation2-Citation5
It is now known that individual bacterial members and bacterial products of the commensal microbiotaCitation6-Citation8 have the potential to carry out striking immunomodulatory functions. Perhaps not unsurprisingly then, the microbiota also heavily contributes to inflammatory,Citation9-Citation13 autoimmune,Citation14 metabolic,Citation11,Citation15,Citation16 neoplastic,Citation17 functionalCitation18-Citation20 and treatment-inducedCitation21,Citation22 disorders.
GF rodents, which possess no bacteria, yeast, molds, parasites or viruses, except retroviruses, are the foundation of gnotobiology and provide a critical approach for characterizing the properties of the human gut microbiota. GF animals are derived by sterile caesarian section or embryo transfer and maintained in sterile isolators. These animals can be selectively inoculated with various microbial species, either singly (monoassociation) or in combination, to study their effects on the host. Once colonized, these rodents must be maintained in barrier intact isolators with positive pressure filtered air and sterilized bedding, food and water to avoid contamination with bacteria, as occurs rapidly in rodents maintained in conventional filter top cages. Maintaining these animals requires compulsively maintained sterile technique, with periodic monitoring for contamination.
The accuracy and reproducibility of gnotobiotic experimental results depend on maintaining precise microbial conditions within each isolator with exclusion of undesired external organisms. This is achieved with double-sided entry ports, sleeved gloves, a continuous flow of filtered air and complete sterilization of all materials entering the isolator. However, this unique system is highly labor intensive and vulnerable to contamination. Any interruption in air flow, incomplete sterilization of food, water or bedding, (due to an undetected autoclave malfunction, for example), or breach in the integrity of the isolator walls, entry ports, filters, sleeves or gloves that are used to manipulate the animals will jeopardize isolator sterility.
Hence, screening of gnotobiotic units for contamination must be performed on a routine basis. The traditional approach to screening relies on aerobic and anaerobic bacterial and fungal culturing with or without Gram staining.Citation23-Citation26 However, these methods have considerable limitations. First, many bacteria in the mammalian gut microbiota are not easily cultured in a laboratory, mainly owing to the lack of appropriate culture media and methods.Citation27 Second, identifying contaminating organisms can be quite tedious and difficult by culture techniques. Finally, the interpretation of fecal Gram stains, which is often complicated by the presence of distracters such as dietary vegetable fibers, fecal matter and dead bacteria present in autoclaved or irradiated chow, can be extremely challenging even to experienced observers.
Consequently, we have optimized molecular polymerase chain reaction (PCR)-based techniques for the specific purpose of screening for and identifying bacterial contamination of gnotobiotic animals with maximal sensitivity and specificity. 16S rRNA (rRNA) sequencing has been utilized to survey bacterial species within the microbiota and the potential for using 16S rRNA PCR to verify GF status was recently mentioned in the literature for the first time.Citation28 However, the methods to carry out 16S rRNA PCR and quantitative PCR (qPCR) screening of gnotobiotic isolators for contamination have not been described to date.
In this study, we outline techniques, programs and conditions that we optimized for screening gnotobiotic isolators for contamination utilizing PCR and qPCR assays with templates of murine fecal DNA and universal 16S rRNA primers that detect a broad range of bacterial species, as well as molecular sequencing of the 16S rRNA amplicons to identify contaminating bacterial species. Our PCR protocol is able to detect contamination in GF animals, but not in animals that have been deliberately colonized with selected microorganisms, as amplification of the 16S rRNA gene results in one band when the PCR products are run on a polyacrylamide gel.
Therefore, to screen selectively colonized animals for bacterial contamination, we utilized random amplification of polymorphic DNA (RAPD) PCR. It has been suggested that with meticulous optimization of DNA concentrations, PCR conditions and reagents, RAPD PCR can be a reliable, sensitive and reproducible assay to generate high quality genomic DNA profiles from various bacterial strains.Citation29 Recently, RAPD PCR has been used to profile and discriminate different strains of Staphylococcus aureus,Citation30 Bacillus cereus,Citation31 Klebsiella pneumoniae,Citation32 Lactobacillus paraplantarum,Citation33 and Enterococcus species.Citation34 However, there are only a few reports of RAPD PCR being conducted on bacteria isolated from fecal samples,Citation35 with two studies reporting the typing of Bacillus subtilisCitation36 and Lactobacillus speciesCitation37 from the human gastrointestinal (GI) tract using RAPD PCR.
Here we describe our application of RAPD PCR, in addition to more classic PCR methods to evaluate the gnotobiotic and GF status respectively of our experimental rodents. Gnotobiotic facilities may use these techniques to screen isolators for bacterial contamination at their own institutions, as we currently do at the National Gnotobiotic Rodent Resource Center (NGRRC) at UNC-Chapel Hill (UNC).
Results
Spectrophotometry
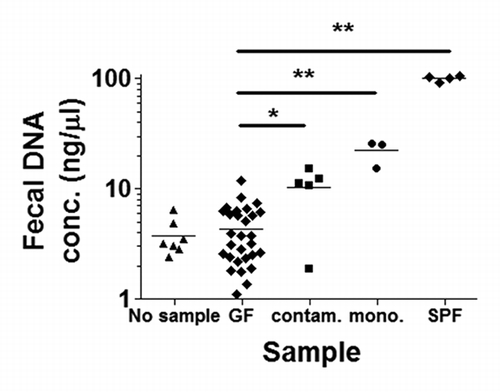
Following isolation of DNA from rodent fecal samples, total fecal DNA concentrations were measured using spectrophotometry (). While there were significant differences between DNA concentrations in putative GF fecal samples and spontaneously contaminated ex-GF fecal samples (p = 0.0002), an overlap in DNA concentrations between these two groups rendered spectrophotometry insufficient for sterility screening. Differences between fecal DNA concentrations from putative GF and monoassociated or SPF mice were also statistically significant (p < 0.0001), and we did not observe any overlap with DNA concentrations obtained from GF mouse feces. When the DNA extraction protocol was run using sterile water or no sample, DNA concentrations were between 2–7 ng/µl.
Figure 1. Fecal DNA concentrations as measured by spectrophotometry. The fecal DNA concentrations in putative germ-free (GF) rodents, represented by diamonds in the second lane from the left, are significantly different from fecal DNA concentrations in spontaneously contaminated ex-GF rodents (squares; middle lane). However, there was slight overlap in the respective fecal DNA concentrations between these two groups. This rendered spectrophotometry insufficient as a screening tool for bacterial GF contamination. Differences in fecal DNA concentrations between putative GF and monoassociated (circles; second from right) and specific pathogen-free (SPF) (diamonds; far right) mice were also significant. No sample, DNA extraction protocol run without sample present; contam., spontaneously contaminated, ex-GF; mono., monoassociated; *p = 0.0002; **p = 0.0001.
Detection of bacterial contamination of GF animals using 16S rRNA PCR
DNA isolated from GF, gnotobiotic and SPF fecal samples served as templates in PCR assays amplifying the 16S rRNA gene. We blindly screened samples obtained from nine isolators at the NGRRC with PCR. The PCR results after gel electrophoresis revealed contamination in an isolator previously thought to be GF, (, isolator 200; lane marked with a “C” for “contaminated”), because microbial culturing techniques and Gram stains of fecal samples derived from mice in this isolator did not reveal the contamination. The prominent PCR band from the fecal sample DNA from the contaminated isolator was approximately the same size and at least as dense as those from the positive control mice that were dual-associated with E. coli NC101 and E. faecalis OG1RF, (, isolator 158; lane marked “D” for “dual-associated”), or from mice colonized with specific pathogen-free (SPF) bacteria. The seven remaining fecal DNA samples collected from mice housed in putative GF isolators did not reveal 16S rRNA sequence amplification (, isolators 124, 136, 166, 168, 180, 186 and 198; lanes marked by asterisks for GF) and Gram stain and cultures of feces from animals in these isolators likewise revealed no bacterial growth. It should be noted that there is a larger, much less intense band from isolator #200 as well, although we are unsure of its origin. We speculate that it could be random amplification of bacterial or mammalian DNA. We did not see this second amplicon from any other samples shown in or in any samples not included in this study.
Figure 2. Agarose gel electrophoresis of PCR products of DNA isolated from rodent feces. (A) 8 National Gnotobiotic Rodent Resource Center (NGRRC) isolators that were thought to be GF were screened with 16S rRNA (rRNA) polymerase chain reaction (PCR) of mouse fecal DNA. Bacterial contamination was detected in isolator 200. Dual-associated mouse fecal DNA from isolator 158, SPF mouse fecal DNA and Escherichia coli genomic DNA served as positive controls for these PCR assays. (B) 12 NGRRC gnotobiotic isolators were blindly screened with 16S rRNA PCR of mouse fecal DNA. Fecal DNA isolated from mice from four isolators amplified: Fecal DNA from mice in isolators 106 and 112, which were subsequently revealed to be monoassociated and fecal DNA from mice in isolators 100 and 196, which were ex-GF isolators that had been recently determined to be spontaneously contaminated. SPF mouse fecal DNA and E. coli genomic DNA served as positive controls for these PCR assays. (C) 14 mouse (lanes marked 1–14) and two rat (lanes marked Rat1 and Rat2) isolators at the Gnotobiotic Animal Core (GAC) of the Center for Gastrointestinal Biology and Disease (CGIBD) at North Carolina State University were blindly screened with 16S rRNA PCR of rodent fecal DNA. The GF status of 15 of these isolators was confirmed, as was the recently-contaminated status of ex-GF isolator #4. E. coli genomic DNA served as positive controls for these PCR assays. STD, 100 base pair ladder; *, GF; C, spontaneously contaminated ex-GF; D, dual-associated; E. coli, E. coli genomic DNA; H20, water negative control template; M, monoassociated.
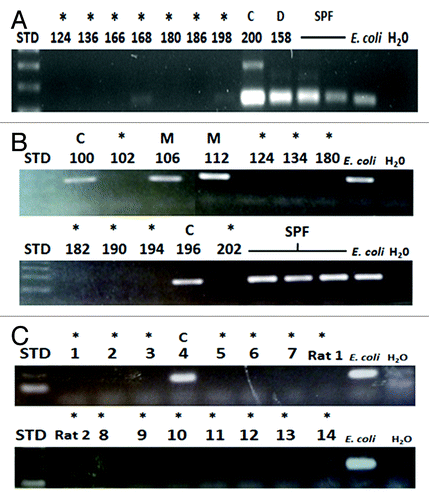
We then blindly screened 10 additional NGRRC isolators using PCR and included samples in our assay from isolators 124 and 180 that had previously been shown with PCR to be GF, in order to show that our screening results were reproducible and also to serve as negative controls. Fecal DNA samples derived from mice housed in four gnotobiotic isolators produced detectable amplicons using the 16S rRNA PCR assay, including two isolators that contained experimentally monoassociated mice, (, isolators 106 and 112; lanes marked “M” for “mono-associated”) and two ex-GF isolators that had been recently determined to be contaminated by traditional culture and Gram staining (, isolators 100 and 196; lanes marked “C” for “contaminated”). The eight remaining fecal DNA samples collected from mice housed in putative GF isolators did not reveal visually detectable 16S rRNA amplification (, isolators 102, 124, 134, 180, 182, 190, 194 and 202; lanes marked by asterisks for GF), and Gram stain and cultures of feces from mice in these isolators verified the lack of presence of bacteria in these animals.
Next, we blindly screened 14 mouse and two rat isolators at the Gnotobiotic Animal Core (GAC) at North Carolina State University (NCSU). Using 16S rRNA PCR, we confirmed the GF status of 15 of these isolators, (, mouse isolators 1–3 and 5–14 and rat isolators 1–2; lanes marked by asterisks for GF), as well as the contaminated status of a known spontaneously contaminated ex-GF isolator (, mouse isolator 4; lane marked by “C” for “contamination”). Cultures of fecal samples taken from mice in these isolators provided the same results as PCR.
qPCR quantitation of bacterial levels in experimental mice
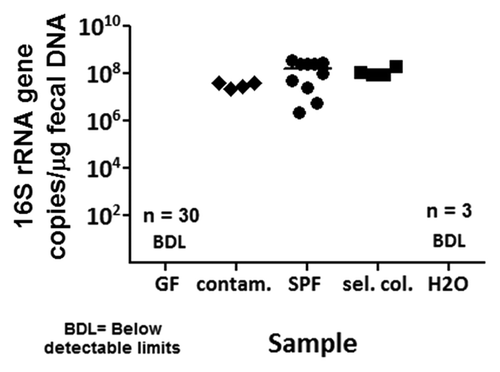
To validate our PCR assay, we also used a qPCR assay to determine levels of bacteria in NGRRC and GAC gnotobiotic fecal samples by quantifying copies of the 16S rRNA gene per microgram of fecal DNA. We found that the 16S rRNA gene was not amplified to detectable levels in the 30 GF fecal samples that were also screened with PCR (). Meanwhile, spontaneously contaminated ex-GF samples identified by PCR, (from isolators #200, #100 and #196 from UNC and isolator #4 at NC State), SPF samples (5 samples included in PCR screening plus 5 additional samples) and selectively colonized samples (samples from dual-associated isolator #158 and monoassociated isolators #106 and #112 at UNC shown in PCR gels, along with a sample from a fourth monoassociated isolator at UNC not screened with PCR) contained 107–108 copies of the 16S rRNA gene per microgram of fecal DNA ().
Figure 3. Bacterial levels in gnotobiotic rodent fecal samples determined by qPCR. Quantitative PCR (qPCR) assays were utilized to determine bacterial levels in gnotobiotic fecal samples by quantitating copies of the 16S rRNA gene per microgram of fecal DNA. The 16S rRNA gene was not amplified to detectable levels in GF mice (n = 30). There were on the order of 10Citation7–10Citation8 copies of the 16S rRNA gene per microgram of fecal DNA in spontaneously contaminated ex-GF mice (n = 4), SPF mice (n = 10) and selectively colonized mice (n = 4). BDL, below detectable limits; contam., contaminated ex-GF; sel. col., selectively colonized; H20, water negative control template.
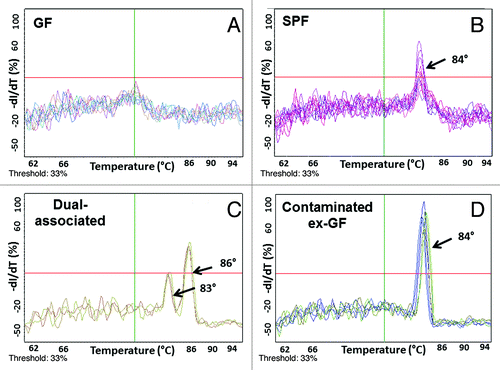
Melting curves from qPCR assays provide valuable information about the specificity of the qPCR assay. Melting curves from our qPCR assays revealed that true amplification of the 16S rRNA gene occurred at melting temperatures of 83° to 87°C (). No melting curve from GF samples is seen at these melting temperatures (). Finally, the two peaks seen in the melting curves of dual-associated fecal DNA samples () most likely represent the individual melting curves of the 16S rRNA PCR products of DNA from the two organisms that were deliberately introduced to GF mice, E. coli NC101 and E. faecalis OG1RF. While melting curves provide information about qPCR assay specificity, they are not a reliable method to determine the number of bacterial species colonizing an animal.
Figure 4. 16S rRNA qPCR melting curves from gnotobiotic and SPF mouse fecal DNA. Melting curves from qPCR assays reveal that true amplification of the 16S rRNA gene occurs at melting temperatures of 83° to 87°C (B-D). No amplification from GF mouse fecal DNA is seen at these melting temperatures (A).
Chow PCR
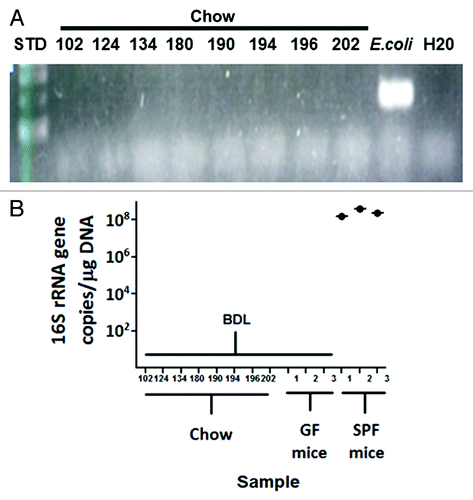
To address the possibility that dead bacteria from autoclaved or irradiated chow may pass through the GI tract of GF animals and cause false positives when screening these animals for bacterial contamination using 16S rRNA PCR of fecal DNA, we sought to determine whether or not bacterial DNA that may or may not be present in food sources might be detectable by PCR. We tested several types of chow used in various NGRRC isolators using PCR. We did not detect the 16S rRNA gene from these samples with PCR () or qPCR () assays.
Figure 5. PCR and qPCR screening of animal chow for bacterial DNA. DNA was isolated from several types of chow used in various NGRRC isolators, and there was no detectable amplification from these samples with 16S rRNA PCR (A) or qPCR (B).E. coli genomic DNA served as a positive control for the PCR assay.
Identification of contaminating bacterial species by 16S rRNA sequencing
The bacterial species contaminating GF mice were identified by sequencing 16S rRNA gene PCR products (). We were able to identify Staphylococcus lentus as the organism contaminating formerly GF isolator 4 and Paenibacillus glucanolyticus as the organism contaminating formerly GF isolator 100. We also identified what may be the aerobic Gram positive rod Bacillus simplex as the contaminant in ex-GF isolator 196, which is included in and in isolator 184, which was not included in our molecular screening. However, as shown in , the percent homology for these two sequences were only 94% and 95%, and coupled with the fact that one of the sequences is relatively short, we are unable to identify this particular organism with a high degree of confidence. By base pair (bp) match length, we refer to the number of bases that are shared between the sequence from the given DNA sample and the known 16S rRNA sequence of a bacterial species of note. Though weight of fecal samples and DNA concentrations are normalized and the DNA extractions are performed the same way each time with the same reagents, volumes, storage procedures, etc. we frequently see slight differences in read lengths that are probably related to the protocol and the quality of the DNA that remains at the end of purification. This explains the slightly different bp match lengths and percent homology that we see for the two samples that are both presumed to be B. simplex. Monoassociated mice were confirmed to be exclusively colonized with E. coli.
Table 1. Bacterial species contaminating GF isolators were identified by sequencing 16S rRNA PCR products. Amplicons of PCR primers that detect 16S rRNA from all bacterial species (universal primers; see methods section) were sequenced using Sanger sequencing
Detection of bacterial contamination in selectively colonized animals using RAPD PCR
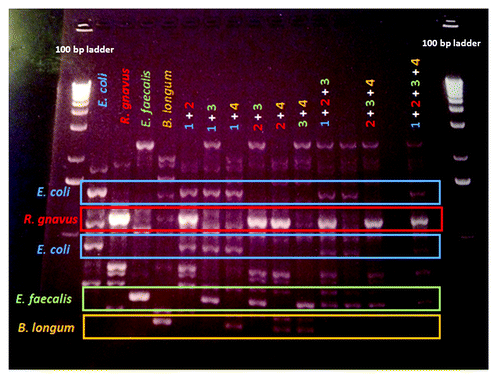
RAPD fingerprinting revealed unique, reproducible fingerprints for DNA isolated from pure cultures of several strains of E. coli, as well as from several Lactobacillus, Pseudomonas and Staphylococcus species, Klebsiella pneumoniae, Listeria monocytogenes and Salmonella typhimurium (not shown). Unique RAPD fingerprints of DNA isolated from pure cultures of E. coli NC101, E. coli K12, E. faecalis OG1RF and Bacteroides vulgatus exhibited a high degree of similarity to fingerprints of fecal DNA from rodents monoassociated with each of these bacterial strains (). Inoculation of E. coli NC101 monoassociated mice with E. faecalis OG1RF (and vice versa) was easily determined using this fingerprinting technique. The RAPD PCR profile of DNA isolated from E. coli NC101/E. faecalis OG1RF dual-associated mice was similar to that of DNA isolated from 50/50 and 75/25 mixtures of pure cultures of E. coli NC101 and E. faecalis OG1RF (). The 7 bacterial strains belonging to the simplified humanized microbiota (SIHUMI) cocktail demonstrated unique fingerprints. Each of these fingerprints was clearly identifiable when up to 4 constituent strains were mixed. RAPD PCR fingerprints of mixtures of E. coli LF82, R. gnavus ATCC 29149, E. faecalis OG1RF and B. longum ATCC 15707 are shown in .
Figure 6. Distinguishing different individual bacterial strains by RAPD PCR fingerprints. (A) Unique rapid amplification of polymorphic DNA (RAPD) fingerprints of DNA isolated from pure cultures of E. coli NC101, E. coli K12, Enterococcus faecalis OG1RF and Bacteroides vulgatus exhibited a high degree of similarity to fingerprints of fecal DNA from rodents monoassociated with each of these bacterial strains. (B) Inoculation of E. coli NC101 monoassociated mice with E. faecalis OG1RF (and vice versa) was easily determined using RAPD PCR. The 2nd lane from the left shows RAPD PCR products from DNA isolated from pure culture of E. faecalis. The second lane from the right shows RAPD PCR products from DNA isolated from pure culture of E. coli. Lanes 3, 4 and 5 show mixtures of RAPD PCR products of E. faecalis and E. coli pure culture DNA. The 50/50 mixture of E. faecalis and E. coli DNA RAPD PCR products in lane 4 matches the fingerprint of DNA isolated from E. faecalis/E. coli dual-associated mice, shown in the far right lane. Lanes 3 and 5 show RAPD PCR profiles of DNA isolated from 75/25 mixtures of E. faecalis/E. coli and E. coli/E. faecalis, respectively. Cult, pure culture DNA; fec, fecal DNA; Ef, Enteroccous faecalis pure culture DNA; Ec, E. coli pure culture DNA.
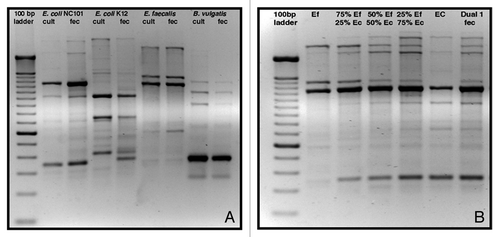
Figure 7. Distinguishing different bacterial strains in complex microbial communities using RAPD PCR. The 7 bacterial strains belonging to the SIHUMI cocktail demonstrated unique fingerprints. Each of these fingerprints was clearly identifiable when up to 4 constituent strains were mixed. From left to right after the ladder on the left side, E. coli (blue), Ruminococcus gnavus (red), E. faecalis (green) and Bifidobacterium longum (orange) are shown, followed by combinations of two, three or four of the respective strains. Unique bands for each bacterium are highlighted by appropriately colored boxes, including two bands that are unique to E. coli.
Discussion
The current primary methods of screening at most gnotobiotic facilities are culture and Gram staining, and while the advantages of these methods are that they are fairly inexpensive and provide instantaneous results in the case of Gram staining, more objective and sensitive molecular methods of detecting gnotobiotic contamination are needed. In this study, we describe methods to isolate DNA from fecal samples of gnotobiotic rodents and screen for contamination using PCR and qPCR assays. The strategies we have developed use PCR assays with universal 16S rRNA primers as an initial screen for gnotobiotic contamination and 16S rRNA qPCR as a means to confirm contamination by determining fecal bacterial concentrations in gnotobiotic animals. We have optimized conditions for these PCR and qPCR assays, including 10 ng DNA loading used in conjunction with 25-cycle PCR assays. Importantly, DNA isolated from chow did not amplify with these conditions nor did documented GF feces show positive results.
Using 16S rRNA PCR product sequencing, we identified an organism that may be Bacillus simplex contaminating two isolators previously judged to be GF. These discordant results illustrate the insensitivity and difficulty in interpretation of traditional culture and Gram stain screening methods. We validated our PCR method by blindly identifying E. coli that had been deliberately introduced into ex-GF isolators to monoassociate mice and also by identifying bacterial species in two isolators determined by Gram stain and/or culture results to be contaminated. Identifying contaminating species can be useful in determining the source of contamination, potentially preventing future breaches in sterility and in investigating the biological effects or pathogenicity of a contaminating bacterial species. For example, we postulate that contamination in isolator 4 by Staphylococcus lentus, a common skin organism, arose from a leak in a glove, while the contamination by spore formers B. simplex and Paenibacillus glucanolyticus originated from an autoclave malfunction. If multiple, unknown contaminants exist in a previously GF or selectively colonized isolator, cloning and sequencing of animal fecal DNA should be performed to determine the identity of the contaminating microbes.
RAPD PCR can also assist in the more difficult detection of contamination in selectively colonized isolators. Detection of contamination in GF isolators is relatively straightforward with our proposed PCR and qPCR techniques. However, our study reveals that in mice colonized with one or two bacterial species, the microorganism(s) reach densities in the GI tract approaching that of the complex microbiota in SPF mice. Therefore, quantifying levels of fecal bacteria alone is not sufficient to determine whether or not contamination of a selectively colonized isolator has occurred. However, we have shown that RAPD PCR can be used to screen selectively colonized animals for contamination. RAPD PCR gels showing DNA from several bacterial species can be quite complex, but we are confident that based on careful scrutiny, one can discriminate between 4 bacterial strains that are mixed together based on their unique RAPD fingerprints.
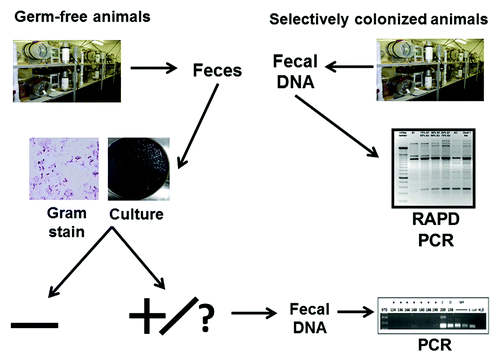
The advantages of using these molecular techniques compared with traditional culture and Gram stain approaches used to screen for contamination are many, including increased sensitivity in detecting anaerobic or uncultivable contaminants and more objective results that do not depend on Gram stain interpretation. These techniques also provide a definitive determination of the presence or absence of contamination, thereby preventing use of contaminated animals in scientific studies with subsequent wasted resources and results that cannot be interpreted. Finally, these methods permit the identification of contaminating bacterial species. The major disadvantages of these molecular methods are that they do not provide instantaneous results and they are performed at an increased cost compared with traditional, non-molecular methods. Because of these limitations, we recommend the continued use of Gram staining and culturing for frequent, first-line screening in gnotobiotic facilities. However, in the case of un-interpretable or inconsistent results, in a situation of high suspicion of contamination despite negative results with traditional techniques, or perhaps before conducting large or lengthy experiments, we recommend using these PCR, qPCR and/or RAPD PCR techniques to definitively determine the presence or absence of contamination in gnotobiotic units ().
Figure 8. Gnotobiotic unit contamination screening algorithm. The continued use of inexpensive Gram staining and culturing for frequent screening of bacterial contamination of GF animals is recommended. However, when Gram stain or culture results are difficult to interpret or inconsistent, a compromise in a glove, sleeve, or isolator wall occurs, an autoclave malfunction is diagnosed, or a large scale experiment is planned, it is recommended that these PCR and qPCR techniques be used to definitively determine the presence or absence of contamination in GF units. RAPD PCR can be used to screen selectively colonized animals for contamination.
We are currently using the PCR assay described herein at the NGRRC at UNC to routinely screen gnotobiotic isolators for contamination, with increased sensitivity and specificity compared with Gram staining and culturing performed concurrently. We screen stable breeding isolators at NGRRC every 2–4 weeks with Gram stain and culture and slightly less frequently with PCR. However, as a general rule, the more frequently an isolator is being opened, the greater the risk of bacterial contamination. When active investigations are ongoing, ports are being opened, animals, food, water or bedding are being imported, or investigative materials are being injected, PCR screening should be performed. In addition, it should be kept in mind that some mucosally-associated intestinal bacteria are not shed continuously in feces, with resultant insensitive monitoring of feces for bacterial contamination. Thus, sampling frequency absolutely plays an important role in detecting contamination, whether conventional or molecular techniques are utilized for screening.
While most microorganisms in the intestine are bacteria, members of Eukarya and Archaea are also present.Citation38 Abundant and diverse fungi have been identified in the murine intestine,Citation39 and 0.8% of 536,112 unique genes identified in a metagenomic analysis of fecal samples taken from 124 healthy Europeans were archaeal.Citation40 Our bacterial-specific 16S rRNA primers screened only for bacterial contamination. It may be possible to screen for eukaryotic microorganisms as well, however. Recently, methods were described for detecting fungi in complex microbial communities using specialized DNA extraction techniques and qPCR.Citation41 Primer pairs that amplify rRNA from Archaea have also been described,Citation42 but this is beyond the scope of this study.
In summary, we describe PCR techniques and conditions using universal 16S rRNA primers to screen for bacterial contamination of GF animals. qPCR assays with the same primers can be used to determine bacterial concentrations in respective GF animal fecal samples. Sequencing of 16S rRNA PCR products can be used to identify contaminating bacterial species to potentially determine the source of a GF contamination, or to investigate the biological effects or pathogenicity of a contaminating species. We have developed an optimal RAPD protocol that can serve as a highly sensitive and reproducible method to screen selectively colonized gnotobiotic animals for contamination that does not require the use of specialized or expensive equipment. Finally, we suggest a cost-effective strategy to screen gnotobiotic animals for contamination by a combination of traditional and molecular methods.
Materials and Methods
Experimental design ()
Figure 9. Experimental design. DNA was isolated from GF rodent fecal samples and used as templates for PCR assays using universal bacterial 16S rRNA primers. DNA was similarly isolated from selectively colonized rodent fecal samples and used as templates for RAPD PCR assays.
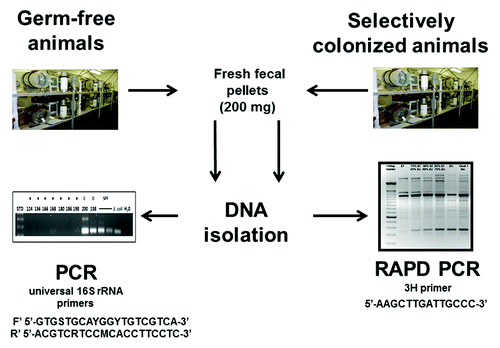
Fresh fecal pellets were collected from rodents housed in GF, spontaneously contaminated ex-GF and selectively colonized isolators at the NGRRC at UNC and the GAC of the Center for Gastrointestinal Biology and Diseases (CGIBD) at NCSU and SPF rooms. The respective colonization status of each sample was not revealed to the investigator performing the analyses until after completion of the testing. Samples from all known contaminated isolators were purposefully included in the study. DNA was isolated from fecal samples and used as templates for 16S rRNA PCR and qPCR assays. Selected 16S rRNA PCR products were sequenced to identify contaminating bacterial species.
Extraction of DNA from fecal samples
DNA was extracted from fecal samples using a phenol/chloroform extraction method combined with physical disruption of bacterial cells and a DNA clean-up kit (Qiagen DNeasy Blood and Tissue Kit). Briefly, fresh fecal pellets were collected from mice and rats. Stool was weighed, normalized to 200 mg per sample, suspended in 750 μl of sterile bacterial lysis buffer (200 mM NaCl, 100 mM Tris [pH 8.0], 20 mM EDTA, 20 mg/ml lysozyme) and incubated at 37°C for 30 min. Next, 85 μl of 10% sodium dodecyl sulfate (Gibco) and 40 μl of 20 mg/ml proteinase K (Qiagen) were added to the mixture, which was then incubated at 65°C for 30 min. 300 mg of 0.1 mm zirconium beads (BioSpec Products) were added and the mixture was homogenized in a bead beater (BioSpec Products) for two minutes. The homogenized mixture was cooled on ice and then centrifuged at 14,000 rpm for five minutes at 4°C. The supernatant was transferred to a new 1.5 ml microfuge tube and fecal DNA was further extracted by phenol/chloroform/iso-amyl alcohol and chloroform/iso-amyl alcohol. Following extraction, the supernatant was precipitated by ethanol at -20°C for one hour. Precipitated DNA was suspended in DNase-free H2O and then cleaned using the Qiagen DNeasy Blood and Tissue Kit per the manufacturer’s instructions. Purified fecal DNA was eluted in 50 μl volumes. The concentration of each DNA extract was determined by spectrophotometric measurement using a Nanodrop 1000 spectrophotometer (Thermo Fisher Scientific).
Chow was removed from several gnotobiotic isolators, placed in sterile plastic bags, crushed with a hammer, weighed and normalized to approximately 200 mg per sample. DNA was then extracted using the above methods.
PCR amplification
Ten nanograms of fecal/chow DNA templates in conjunction with the following PCR conditions resulted in optimal specificity and sensitivity: 95°C for 5 min, then 25 cycles of 95°C for 30 sec, 52°C for 30 sec and 72°C for 45 sec. These cycles were followed by 72°C for seven minutes. Reactions were performed in a final volume of 25 μl containing 1 μl of DNA template, 1.5 μl MgCl2, 1 μl of each primer, 2.5 U Taq polymerase (Invitrogen), 80 μM each of dATP, dCTP, dGTP and dTTP in 10 mM Tris/HCl buffer (pH 8.3), 50 mM KCl and 0.001% (w/v) gelatin. “Universal” primers were used to amplify the genes encoding 16S rRNA from all bacterial groups: Forward primer, UniF (5′-GTGSTGCAYGGYTGTCGTCA-3′) and reverse primer, UniR (5′-ACGTCRTCCMCACCTTCCTC-3′).Citation18 These Universal primer sequences are complementary to highly conserved sequences within the E. coli 16S rRNA gene, which is 1542 nucleotides. UniF is complementary to nucleotides 1047 through 1067, while UniR is complementary to nucleotides 1174 through 1194. Amplicons generated using these primers are 147 base pairs. PCR assays were performed in a GeneAmp PCR system 9700 thermocycler (Applied Biosystems) under various conditions to optimize results. Reaction products were stored at 4°C. Amplified products were separated on a 1% (m/v) agarose (Invitrogen) gel in Tris/acetate/EDTA buffer (40 mM Tris/acetate, 1 mM EDTA, pH 8.0) containing 0.5 μg 1% ethidium bromide. PCR products were then visualized under UV light.
qPCR assays
qPCR assays were performed using universal primers that amplify the genes encoding 16S rRNA from all bacterial groups (see above) to quantitate copies of the 16S rRNA gene per μg of fecal DNA. qPCR assays were conducted in 96-well plates on a Realplex Mastercycler thermocycler (Eppendorf). Each qPCR assay was performed in a final volume of 12 μl and contained: 6 μl SYBR Green qPCR Master Mix (Qiagen), 0.5 μl of each primer and 1 μl of DNA template. qPCR conditions were as follows: 95°C for ten minutes, followed by 40 cycles of 95°C for 15 sec, 60°C for 20 sec and 72°C for one minute. Each plate included triplicate reactions per DNA sample and the appropriate set of standards. qPCR standards were generated by PCR amplification of the purified target 16S rRNA genes from a positive control Escherichia coli NC101 strain used in our monoassociation studies.Citation43 Melting curve analysis of PCR product amplification was conducted following each assay to confirm that each fluorescence signal originated from specific PCR products and not from primer-dimers or other artifacts. All qPCR plates included a “no template” negative control for each primer set.
Bacterial identification by 16S rRNA gene sequencing
We identified contaminating bacterial species by sequencing the 16S rRNA PCR products obtained from positive reactions using primers that amplify the genes encoding 16S rRNA from all bacterial groups to generate longer products for sequencing, 8F (5′-AGAGTTTGATCCTGGCTCAG-3′) and 1391R (5′-GACGGGCGGTGWGTRCA-3′).Citation18 After purifying the resulting 16S rRNA PCR products with a Qiagen clean-up kit, the products were sequenced by the UNC Automated DNA Sequencing Facility using Sanger sequencing, and the results were cross-referenced with The National Center for Biotechnology Information (NCBI) Reference Sequence (RefSeq) database.Citation44
RAPD PCR assays
We used a single random oligonucleotide 3H primer (5′-AAGCTTGATTGCCC-3′) and optimized RAPD PCR conditions. RAPD PCR reactions were performed in a final volume of 25 μL containing 10 ng of DNA template, 2 U of Taq Polymerase (Invitrogen, Carlsbad, CA), 1.5 μL MgCl2 (50 mM), 2.5 μL primer (20 μM) and 2 μL dNTPs (Promega, 10 mM). The PCR reactions were performed in a GeneAmp PCR system 9700 thermocycler (Applied Biosystems, Foster City, CA) using the following conditions: 95°C for 5 min, 36 cycles of 95°C for 1 min, 36°C for 1 min and 72°C for 2 min followed by one cycle of 72°C for 7 min for completion of DNA extension. PCR products were stored at 4°C. Finally, 10 μL of each amplified product was separated on a 2% (w/v) agarose (Invitrogen, Carlsbad, CA) gel in Tris/acetate/EDTA buffer (40 mM Tris/acetate, 1 mM EDTA, pH 8.0) containing 0.5 μg 1% ethidium bromide. The products were then visualized under UV light.
We generated fingerprints from cultures of 30 relevant bacterial strains. To test applicability to gnotobiotic screening, we conducted RAPD PCR assays on DNA isolated from cultures of defined intestinal bacterial species as well as fecal samples of mice monoassociated with the same respective bacterial strains. We performed RAPD PCR on fecal DNA from monoassociated mice before and after inoculation with a second bacterium. Finally, we tested RAPD PCR’s ability to discern between combinations of the 7 members of the SIHUMI cocktail, E. coli LF82, Ruminococcus gnavus ATCC 29149, Enterococcus faecalis OG1RF, Bifidobacterium longum ATCC 15707, Faecalibacterium prausnitzii A2–165, Lactobacillus plantarum WCFS1 and Bacteroides vulgatus ATCC 8482.
| Abbreviations: | ||
| DNA | = | deoxyribonucleic acid |
| PCR | = | polymerase chain reaction |
| qPCR | = | quantitative polymerase chain reaction |
| rRNA | = | ribosomal ribonucleic acid |
| GI | = | gastrointestinal |
| GF | = | germ-free |
| SPF | = | specific pathogen free |
| IL-10 | = | interleukin-10 |
Acknowledgments
The authors thank Susie May and Nancy Rohr for expert secretarial support. These studies were funded by UPHS grants P40 OD010995 (National Gnotobiotic Rodent Resource Center), P30 DK34987 (Center for Gastrointestinal Biology and Disease, Gnotobiotic Animal Core), T32 DK07737 (CDP) and T35 DK007386 (SM) and Crohn’s and Colitis Foundation of America Research Fellowship Award (CDP) and support for the Gnotobiotic Animal Facility.
Submitted
03/15/2013
Revised
06/25/2013
Accepted
07/21/2013
Disclosure of Potential Conflicts of Interest
No potential conflict of interest was disclosed.
References
- Packey CD, Sartor RB. Commensal bacteria, traditional and opportunistic pathogens, dysbiosis and bacterial killing in inflammatory bowel diseases. Curr Opin Infect Dis 2009; 22:292 - 301; http://dx.doi.org/10.1097/QCO.0b013e32832a8a5d; PMID: 19352175
- Ivanov II, Frutos RdeL, Manel N, Yoshinaga K, Rifkin DB, Sartor RB, et al. Specific microbiota direct the differentiation of IL-17-producing T-helper cells in the mucosa of the small intestine. Cell Host Microbe 2008; 4:337 - 49; http://dx.doi.org/10.1016/j.chom.2008.09.009; PMID: 18854238
- Ferreira RB, Gill N, Willing BP, Antunes LC, Russell SL, Croxen MA, et al. The intestinal microbiota plays a role in Salmonella-induced colitis independent of pathogen colonization. PLoS One 2011; 6:e20338; http://dx.doi.org/10.1371/journal.pone.0020338; PMID: 21633507
- Willing BP, Vacharaksa A, Croxen M, Thanachayanont T, Finlay BB. Altering host resistance to infections through microbial transplantation. PLoS One 2011; 6:e26988; http://dx.doi.org/10.1371/journal.pone.0026988; PMID: 22046427
- Reeves AE, Theriot CM, Bergin IL, Huffnagle GB, Schloss PD, Young VB. The interplay between microbiome dynamics and pathogen dynamics in a murine model of Clostridium difficile Infection. Gut Microbes 2011; 2:145 - 58; http://dx.doi.org/10.4161/gmic.2.3.16333; PMID: 21804357
- Ivanov II, Atarashi K, Manel N, Brodie EL, Shima T, Karaoz U, et al. Induction of intestinal Th17 cells by segmented filamentous bacteria. Cell 2009; 139:485 - 98; http://dx.doi.org/10.1016/j.cell.2009.09.033; PMID: 19836068
- Atarashi K, Tanoue T, Shima T, Imaoka A, Kuwahara T, Momose Y, et al. Induction of colonic regulatory T cells by indigenous Clostridium species. Science 2011; 331:337 - 41; http://dx.doi.org/10.1126/science.1198469; PMID: 21205640
- Round JL, Lee SM, Li J, Tran G, Jabri B, Chatila TA, et al. The Toll-like receptor 2 pathway establishes colonization by a commensal of the human microbiota. Science 2011; 332:974 - 7; http://dx.doi.org/10.1126/science.1206095; PMID: 21512004
- Sartor RB. Microbial influences in inflammatory bowel diseases. Gastroenterology 2008; 134:577 - 94; http://dx.doi.org/10.1053/j.gastro.2007.11.059; PMID: 18242222
- Sartor RB. Genetics and environmental interactions shape the intestinal microbiome to promote inflammatory bowel disease versus mucosal homeostasis. Gastroenterology 2010; 139:1816 - 9; http://dx.doi.org/10.1053/j.gastro.2010.10.036; PMID: 21029802
- Greenblum S, Turnbaugh PJ, Borenstein E. Metagenomic systems biology of the human gut microbiome reveals topological shifts associated with obesity and inflammatory bowel disease. Proc Natl Acad Sci U S A 2012; 109:594 - 9; http://dx.doi.org/10.1073/pnas.1116053109; PMID: 22184244
- Wang Z, Klipfell E, Bennett BJ, Koeth R, Levison BS, Dugar B, et al. Gut flora metabolism of phosphatidylcholine promotes cardiovascular disease. Nature 2011; 472:57 - 63; http://dx.doi.org/10.1038/nature09922; PMID: 21475195
- Devkota S, Wang Y, Musch MW, Leone V, Fehlner-Peach H, Nadimpalli A, et al. Dietary-fat-induced taurocholic acid promotes pathobiont expansion and colitis in Il10-/- mice. Nature 2012; 487:104 - 8; PMID: 22722865
- Giongo A, Gano KA, Crabb DB, Mukherjee N, Novelo LL, Casella G, et al. Toward defining the autoimmune microbiome for type 1 diabetes. ISME J 2011; 5:82 - 91; http://dx.doi.org/10.1038/ismej.2010.92; PMID: 20613793
- Zupancic ML, Cantarel BL, Liu Z, Drabek EF, Ryan KA, Cirimotich S, et al. Analysis of the gut microbiota in the old order Amish and its relation to the metabolic syndrome. PLoS One 2012; 7:e43052; http://dx.doi.org/10.1371/journal.pone.0043052; PMID: 22905200
- Turnbaugh PJ, Hamady M, Yatsunenko T, Cantarel BL, Duncan A, Ley RE, et al. A core gut microbiome in obese and lean twins. Nature 2009; 457:480 - 4; http://dx.doi.org/10.1038/nature07540; PMID: 19043404
- Wallace BD, Wang H, Lane KT, Scott JE, Orans J, Koo JS, et al. Alleviating cancer drug toxicity by inhibiting a bacterial enzyme. Science 2010; 330:831 - 5; http://dx.doi.org/10.1126/science.1191175; PMID: 21051639
- Carroll IM, Ringel-Kulka T, Keku TO, Chang YH, Packey CD, Sartor RB, et al. Molecular analysis of the luminal- and mucosal-associated intestinal microbiota in diarrhea-predominant irritable bowel syndrome. Am J Physiol Gastrointest Liver Physiol 2011; 301:G799 - 807; http://dx.doi.org/10.1152/ajpgi.00154.2011; PMID: 21737778
- Ringel Y, Carroll IM. Alterations in the intestinal microbiota and functional bowel symptoms. Gastrointest Endosc Clin N Am 2009; 19:141 - 50, vii; http://dx.doi.org/10.1016/j.giec.2008.12.004; PMID: 19232285
- Carroll IM, Ringel-Kulka T, Siddle JP, Ringel Y. Alterations in composition and diversity of the intestinal microbiota in patients with diarrhea-predominant irritable bowel syndrome. Neurogastroenterol Motil 2012; 24:521 - 30, e248; http://dx.doi.org/10.1111/j.1365-2982.2012.01891.x; PMID: 22339879
- Packey CD, Ciorba MA. Microbial influences on the small intestinal response to radiation injury. Curr Opin Gastroenterol 2010; 26:88 - 94; http://dx.doi.org/10.1097/MOG.0b013e3283361927; PMID: 20040865
- Crawford PA, Gordon JI. Microbial regulation of intestinal radiosensitivity. Proc Natl Acad Sci U S A 2005; 102:13254 - 9; http://dx.doi.org/10.1073/pnas.0504830102; PMID: 16129828
- Nishino R, Mikami K, Takahashi H, Tomonaga S, Furuse M, Hiramoto T, et al. Commensal microbiota modulate murine behaviors in a strictly contamination-free environment confirmed by culture-based methods. Neurogastroenterol Motil 2013; 25:521 - 8; http://dx.doi.org/10.1111/nmo.12110; PMID: 23480302
- Asano Y, Hiramoto T, Nishino R, Aiba Y, Kimura T, Yoshihara K, et al. Critical role of gut microbiota in the production of biologically active, free catecholamines in the gut lumen of mice. Am J Physiol Gastrointest Liver Physiol 2012; 303:G1288 - 95; http://dx.doi.org/10.1152/ajpgi.00341.2012; PMID: 23064760
- Fagundes CT, Amaral FA, Vieira AT, Soares AC, Pinho V, Nicoli JR, et al. Transient TLR activation restores inflammatory response and ability to control pulmonary bacterial infection in germfree mice. J Immunol 2012; 188:1411 - 20; http://dx.doi.org/10.4049/jimmunol.1101682; PMID: 22210917
- Patwa LG, Fan TJ, Tchaptchet S, Liu Y, Lussier YA, Sartor RB, et al. Chronic intestinal inflammation induces stress-response genes in commensal Escherichia coli.. Gastroenterology 2011; 141:1842 - 51, e1-10; http://dx.doi.org/10.1053/j.gastro.2011.06.064; PMID: 21726510
- Manichanh C, Borruel N, Casellas F, Guarner F. The gut microbiota in IBD. Nat Rev Gastroenterol Hepatol 2012; 9:599 - 608; http://dx.doi.org/10.1038/nrgastro.2012.152; PMID: 22907164
- Faith JJ, Rey FE, O’Donnell D, Karlsson M, McNulty NP, Kallstrom G, et al. Creating and characterizing communities of human gut microbes in gnotobiotic mice. ISME J 2010; 4:1094 - 8; http://dx.doi.org/10.1038/ismej.2010.110; PMID: 20664551
- Atienzar FA, Jha AN. The random amplified polymorphic DNA (RAPD) assay and related techniques applied to genotoxicity and carcinogenesis studies: a critical review. Mutat Res 2006; 613:76 - 102; http://dx.doi.org/10.1016/j.mrrev.2006.06.001; PMID: 16979375
- Gutiérrez D, Delgado S, Vázquez-Sánchez D, Martínez B, Cabo ML, Rodríguez A, et al. Incidence of Staphylococcus aureus and analysis of associated bacterial communities on food industry surfaces. Appl Environ Microbiol 2012; 78:8547 - 54; http://dx.doi.org/10.1128/AEM.02045-12; PMID: 23023749
- Kuwana R, Imamura D, Takamatsu H, Watabe K. Discrimination of the Bacillus cereus group members by pattern analysis of random amplified polymorphic DNA-PCR. Biocontrol Sci 2012; 17:83 - 6; http://dx.doi.org/10.4265/bio.17.83; PMID: 22790844
- Ashayeri-Panah M, Eftekhar F, Feizabadi MM. Development of an optimized random amplified polymorphic DNA protocol for fingerprinting of Klebsiella pneumoniae.. Lett Appl Microbiol 2012; 54:272 - 9; http://dx.doi.org/10.1111/j.1472-765X.2012.03203.x; PMID: 22220979
- Saito S, Kobayashi M, Kimoto-Nira H, Aoki R, Mizumachi K, Miyata S, et al. Intraspecies discrimination of Lactobacillus paraplantarum by PCR. FEMS Microbiol Lett 2011; 316:70 - 6; http://dx.doi.org/10.1111/j.1574-6968.2010.02193.x; PMID: 21204929
- Martín B, Corominas L, Garriga M, Aymerich T. Identification and tracing of Enterococcus spp. by RAPD-PCR in traditional fermented sausages and meat environment. J Appl Microbiol 2009; 106:66 - 77; http://dx.doi.org/10.1111/j.1365-2672.2008.03976.x; PMID: 19120623
- Martín V, Maldonado-Barragán A, Moles L, Rodriguez-Baños M, Campo RD, Fernández L, et al. Sharing of bacterial strains between breast milk and infant feces. J Hum Lact 2012; 28:36 - 44; http://dx.doi.org/10.1177/0890334411424729; PMID: 22267318
- Hong HA, Khaneja R, Tam NMK, Cazzato A, Tan S, Urdaci M, et al. Bacillus subtilis isolated from the human gastrointestinal tract. Res Microbiol 2009; 160:134 - 43; http://dx.doi.org/10.1016/j.resmic.2008.11.002; PMID: 19068230
- Ahlroos T, Tynkkynen S. Quantitative strain-specific detection of Lactobacillus rhamnosus GG in human faecal samples by real-time PCR. J Appl Microbiol 2009; 106:506 - 14; http://dx.doi.org/10.1111/j.1365-2672.2008.04018.x; PMID: 19200317
- Samuel BS, Gordon JI. A humanized gnotobiotic mouse model of host-archaeal-bacterial mutualism. Proc Natl Acad Sci U S A 2006; 103:10011 - 6; http://dx.doi.org/10.1073/pnas.0602187103; PMID: 16782812
- Scupham AJ, Presley LL, Wei B, Bent E, Griffith N, McPherson M, et al. Abundant and diverse fungal microbiota in the murine intestine. Appl Environ Microbiol 2006; 72:793 - 801; http://dx.doi.org/10.1128/AEM.72.1.793-801.2006; PMID: 16391120
- Virgin HW, Todd JA. Metagenomics and personalized medicine. Cell 2011; 147:44 - 56; http://dx.doi.org/10.1016/j.cell.2011.09.009; PMID: 21962506
- Iliev ID, Funari VA, Taylor KD, Nguyen Q, Reyes CN, Strom SP, et al. Interactions between commensal fungi and the C-type lectin receptor Dectin-1 influence colitis. Science 2012; 336:1314 - 7; http://dx.doi.org/10.1126/science.1221789; PMID: 22674328
- Chachkhiani M, Dabert P, Abzianidze T, Partskhaladze G, Tsiklauri L, Dudauri T, et al. 16S rDNA characterisation of bacterial and archaeal communities during start-up of anaerobic thermophilic digestion of cattle manure. Bioresour Technol 2004; 93:227 - 32; http://dx.doi.org/10.1016/j.biortech.2003.11.005; PMID: 15062816
- Kim SC, Tonkonogy SL, Albright CA, Tsang J, Balish EJ, Braun J, et al. Variable phenotypes of enterocolitis in interleukin 10-deficient mice monoassociated with two different commensal bacteria. Gastroenterology 2005; 128:891 - 906; http://dx.doi.org/10.1053/j.gastro.2005.02.009; PMID: 15825073
- Pruitt KD, Tatusova T, Brown GR, Maglott DR. NCBI Reference Sequences (RefSeq): current status, new features and genome annotation policy. Nucleic Acids Res 2012; 40:Database issue D130 - 5; http://dx.doi.org/10.1093/nar/gkr1079; PMID: 22121212