Abstract
JC virus (JCV) is a polyomavirus that infects approximately 75% of the population and encodes a T antigen (T-Ag) gene, which is oncogenic and inactivates the p53 and pRb/p107/p130 protein families. Previous work in our lab has identified the presence of T-Ag in colorectal neoplasms. While JCV remains in a latent state for the majority of those infected, we hypothesized that a disturbance in immunological control may permit JCV to reactivate, which may be involved in the development of colorectal neoplasia. Our aim was to determine the cell mediated immune response to JCV T-Ag, and determine if it is altered in patients with colorectal adenomatous polyps (AP) or cancers (CRC). Peripheral blood mononuclear cells (PBMCs) isolated from the blood of patients undergoing colonoscopy or colorectal surgery were stimulated by a peptide library covering the entire T-Ag protein of JCV. Cytokine production and T cell proliferation were evaluated following T-Ag stimulation using Luminex and flow cytometry assays. JCV T-Ag peptides stimulated secretion of IL-2, which induced T cell expansion in all three groups. However, stronger IL-10 and IL-13 production was seen in patients without colorectal neoplasms. IP-10 was produced at very high levels in all groups, but not significantly differently between groups. Most patients exhibited CD4+ and CD8+ T cells in response to stimulation by the T-Ag clusters. The combination of IL-2 and IP-10 secretion indicates the presence of T-Ag-specific Th1 cells in all patients, which is higher in patients without carcinoma.
Introduction
JC virus (JCV) is a polyomavirus that was first identified in 1971 as the causative agent of progressive multifocal leukoencephalopathy (PML) in a patient with Hodgkin lymphoma.Citation1 Infection with the virus is ubiquitous in humans and 75% of most adult populations have antibodies to the virus including—although at lower rates—remote native South American populations.Citation2,Citation3 Transmission appears to take place within families and close community members.Citation4,Citation5 Most children produce antibodies to JCV by their early teenage years.Citation6 The initial infection by JCV is asymptomatic and the virus is capable of entering a latent stage in several possible reservoirs in the body. JCV has been found in the kidneys, tonsils, bone marrow, and gut, indicating these as possible reservoirs for the latent virus.Citation7-Citation9 How JCV interacts over the long-term with the reservoir cells, and what damage may be done to these cells (if any), is unknown. It is possible that latent JCV is able to interact with the cell and cause damage that may lead to permanent changes.
JCV encodes three proteins that are the structural capsid proteins: VP1, VP2, and VP3. JCV also encodes the T antigen proteins (i.e., Large T and multiple small t splice variants) and the agnoprotein, which is involved in the assembly of viral particles. T-Ag has several splice sites producing truncated proteins that are involved in regulating cell proliferation and viral transmission.Citation10 Multiple experimental animal models have demonstrated that JCV can cause brain tumors in rodents and nonhuman primates.Citation11-Citation13 When T-Ag induces tumorigenesis, all of the tumors are aneuploid. T-Ag is capable of disrupting the function of tumor suppressor proteins p53 and members of the pRB family, which probably contributes to carcinogenesis in the animal models.Citation14,Citation15 Previous work identified increased nuclear expression of the JCV T-Ag in colorectal neoplasia compared with normal mucosa.Citation16-Citation19 CRC cell lines transfected with JCV develop chromosomal instability and features of increased migration and invasion.Citation20
The presence of JCV has been identified throughout the digestive tract. JCV was detected in 85% of normal esophageal tissue samples and 100% of the tumors.Citation21 Almost half of gastric cancers sampled were positive for JCV.Citation22,Citation23 A recent study evaluating the presence of JCV in anal cancer also evaluated the concomitant presence of human papillomavirus (HPV), since it is assumed that HPV causes anal cancer, as well as cervical cancer. Twenty two anal cancers were tested by PCR for JCV and all were positive, while 13 of the cases were positive for HPV.Citation24 These data demonstrate the presence of JCV throughout cancers of the digestive tract and suggest the possibility that JCV initiates cancers in these tissues.
PML was first diagnosed in patients with hematological malignancies. Now most cases are seen in human immunodeficiency virus (HIV)—infected patients or patients receiving treatment with immunomodulators such as natalizumab, rituximab, or efalizumab for diseases such as Crohn disease, multiple sclerosis, or psoriasis. All of these patient populations have reduced function of their immune systems which allows the virus to enter the lytic phase. We still do not understand how the state of viral latency is either maintained or broken for JCV.Citation25 Since these patients are at risk for development of PML, previous studies on these patient populations focused on the immune response to JCV.Citation21,Citation26,Citation27 More recent work is evaluating the immune response beyond those subsets.Citation18 There is a need to clarify the immune response in patients with gastrointestinal diseases since JCV has been correlated with some cancers in this organ system. In order to characterize the immune response in these populations, PBMCs from patients with neoplasia-free colons, and individuals with colorectal adenomas or carcinomas, were stimulated with JCV T-Ag peptides and evaluated for CD4+ and CD8+ T cell proliferation and cytokine production. We demonstrated that the JCV T-Ag stimulates a robust Th1 response, which most individuals have evidence of prior exposure to JCV, but with the exception of a slightly diminished IL-2 response in the cancer patients, there is not a substantial difference in the response between those who have or do not have colorectal neoplasia.
Results
Patient population data
As shown in , the average age of the patients was 60.3 years. A majority of the patients enrolled were Caucasian (n = 48; 80%), there were 10 African Americans patients (17%), and 2 Hispanic patients (3%). Thirty five of the patients were male and 25 were female. Twenty patients were enrolled into each of the following groups: negative colonoscopy, presence of adenomatous polyp(s), or a diagnosis of colorectal cancer. Patients were categorized as having a negative colonoscopy even if hyperplastic polyps were found during colonoscopy, since they are not considered true neoplasms.
Table 1. Summary of the patients enrolled in the study
Cytokine response
In order to evaluate the type of immune response generated by the PBMCs when stimulated by T-Ag peptides in culture, cytokine concentrations were determined and the fold change compared with the negative control was calculated. Interleukins (IL)-2, -10, and -13 and interferon-γ inducible protein 10 (IP-10) were tested to determine the presence of a Th1 or Th2 response. Antigen-specific Th1 responses are detected by the induction of IL-2 and IP-10, while antigen-specific Th2 responses are detected by the induction of IL-13.Citation28-Citation30
IL-10 response
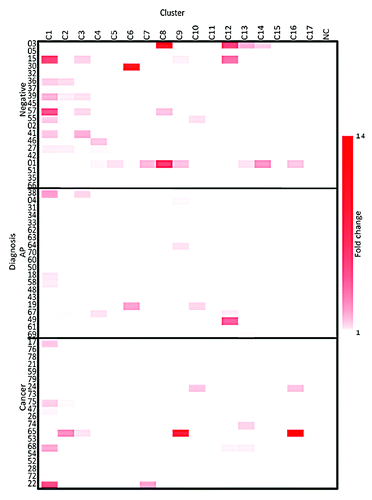
Supernatant was taken on day 2 of the culture protocol to determine the relative concentration of IL-10 in the supernatant of the PBMC culture (). A previous study on blood samples from melanoma patients shows that the induction of IL-10 in the culture supernatant reflects the presence of antigen-specific regulatory T cells.Citation29 Several patients did not produce IL-10 in response to the stimulation by JCV T-Ag peptide clusters as seen by the white areas on the heat map. Patients with negative colonoscopies produced a significantly higher fold change in IL-10 concentration compared with patients with APs or cancers (P < 0.001 and P < 0.05, respectively). The IL-10 concentration was below detection levels in more of the PBMC cultures from patients with APs or cancer compared with those with negative colonoscopies. For the majority of the patients producing IL-10, no more than 4 clusters stimulated a response.
IL-13 response
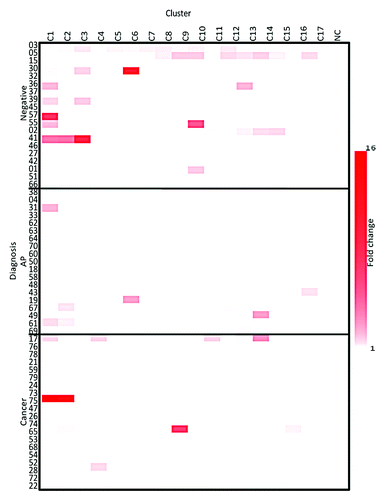
Supernatant was taken on day 2 of the culture protocol to determine the relative concentration of IL-13 in the supernatant of the PBMCs culture (), and there was no significant difference between the three groups (P = 0.976). The concentration of IL-13 produced did not exceed 7 pg/mL (data not shown), indicating a minimal response even though there are some fold change compared with the negative control that appear significant.
IL-2 response
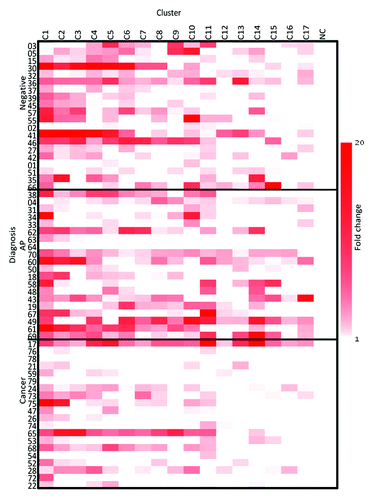
Supernatant was taken on day 2 of the culture protocol to determine the relative concentration of IL-2 in the supernatant of the PBMCs culture (), and all of the clusters stimulated IL-2 production in the majority of patients. The concentration of IL-2 produced was as high as 50 pg/mL for the strongly responding clusters (data not shown) which is considered a robust response. The N-terminal T-Ag clusters were the strongest stimulators, but the rest of the clusters also showed immunostimulatory activity. The patients with cancer produced the lowest levels of response (P = 0.03), and among the fewer clusters.
IP-10 response
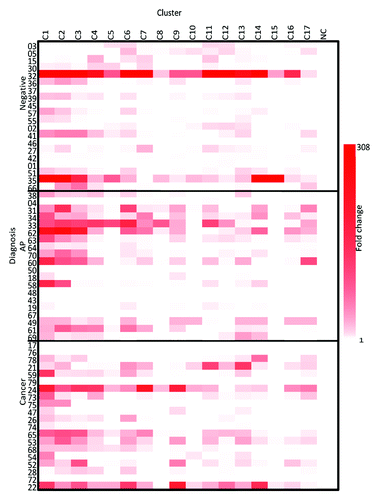
Supernatant was taken on day 2 of the culture protocol to determine the relative concentration of IP-10 in the supernatant of the PBMC culture (), and all 3 groups produced high levels of IP-10 release with fold change values up 300. IP-10 concentration was over 2500 pg/mL in some cultures. There were no significant differences between the amount of IP-10 produced among the groups (P = 0.17). All clusters stimulated IP-10 production, although the N-terminal clusters seem to initiate a response higher than the others in the AP group.
Flow cytometry results
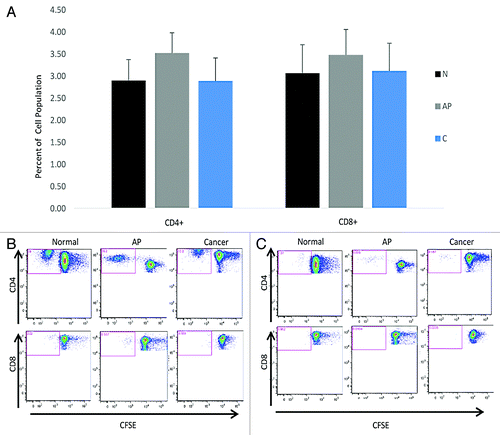
The PBMCs were stained for CD4 and CD8 on day 8 of the protocol in order to identify their presence, and a proliferative response. During the plating of the cells on day 0, the cells were stained with the dye CFSE, which passively enters cells, and half is passed onto each daughter cell during division, thus making it a marker of cell proliferation.Citation31 Therefore, analysis of the expression of CD4 and CD8 by the cell population that diluted CFSE permits the determination whether the peptides are recognized by CD4+ or CD8+ T cells.
There was variability in the T cell recognition of the clusters (). Some of the clusters were better recognized by the T cells, such as cluster 1 (). However there was no difference between patients with or without neoplasia (P = 0.7). As with the cytokine production, the N-terminal of the protein stimulated more T cell proliferation compared with the carboxy terminus. Cluster 15 near the carboxy terminus was not well recognized by the T cells resulting in little to no cell proliferation (). Overall, the T-Ag peptides did induce proliferation of the T cells in all groups.
Figure 5. CD4+ and CD8+ T cell proliferation. (A) CD4+ and CD8+ T cell proliferation. The CD4+ T cell proliferation is the first set of 3 for the cohorts and the CD8+ T cell proliferation is the second set of the three cohorts. T cells are represented as the percentage of total cells. Standard error of the mean is represented above each column. (B) CD4+ and CD8+ T cell proliferation from a strong stimulating cluster. Representative patients for T cell proliferation from the three groups for cluster 1, a cluster stimulating a strong response. CFSE decreases in replicating cells, indicated by a population shift to the left. The CD4+ and CD8+ staining is indicated on the y axis and the CFSE staining is on the x axis. (C) CD4+ and CD8+ T cell proliferation from a poorly stimulating cluster. Representative patients for T cell proliferation from the three groups for cluster 15, representing a weak response. CFSE decreases in replicating cells, indicated by a population shift to the left. The CD4+ and CD8+ staining is indicated on the y axis and the CFSE staining is on the x axis.
Discussion
Our aim was to characterize the immune response to JCV in normal subjects and individuals with colorectal neoplasia. Prior infection by the virus in the individuals would result in memory T cells that could be stimulated to quickly expand in culture to evaluate the immune response. In our initial experiments, we evaluated the immune response from patient PBMCs to T-Ag stimulation. The T cell proliferation and cytokine production in response to the T-Ag stimulation is a starting point to understanding how the immune system responds to the ubiquitous presence of JCV.
One way to evaluate the immune response to a pathogen is to compare indicators of the Th1 and Th2 responses. CD4+ T cells are comprised of multiple subsets, including Th1 and Th2. The Th1 response is associated with a cell mediated response and aids CD8+ T cells, which is the primary response to most viral infections, as opposed to the humoral response of Th2. IL-10, initially identified in 1989, mediates an anti-inflammatory response, which helps suppress the Th1 response.Citation32 An important cytokine in the colon is IL-13, which is known to be active in immune responses against colonic pathogens, especially helminthic parasites.Citation33 Production of IL-13 is characteristic of a Th2 response.Citation34 To evaluate the Th1 response, we chose the markers IL-2 and IP-10. Activated T cells produce IL-2, which is capable of inducing T cells to produce interferon-γ (IFN-γ).Citation35,Citation36 IFN-γ is characteristic of a classic Th1 cytokine response, and suppresses the Th2 response.Citation37 IFN-γ also induces the production of IP-10, which acts as a sensitive indicator of the activation of Th1 cells in an in vitro culture system.Citation28,Citation30 The coordinated response of these four cytokines, IL-2, IL-10, IL-13, and IP-10, give us an indication of the type of immune response generated by a pathogen.
Flow cytometry demonstrated the T cell proliferation in the PBMC cultures, and we found equally strong CD4+ and CD8+ T cell proliferative responses in most patients although there was no significant difference between the cohorts.
The majority of our patients demonstrated a more robust Th1 response as indicated by an increased production of IL-2 and IP-10. This is expected in a viral immune response, as were the low levels of IL-10 and IL-13. High levels of Th1 cytokines from most clusters indicate a specific and strong Th1 response to T-Ag. Cancer patients did exhibit dampened IL-2 and IL-10 responses indicating some diminished functionality of this response in that population. The fact that most patients responded to T-Ag indicates prior exposure to virus, confirming previous reports of ubiquitous infection.
Cytokine secretion was induced by all clusters of the T Ag peptides and high levels of Th1 type cytokines were produced by most patients in response to the majority of the clusters. The N-terminal half of the T-Ag protein appears to stimulate a more robust IL-2 and IP-10 response than the carboxy-terminus, which may be a clue for the development of a vaccine, if that would be desired. Further investigation into what causes that part of the protein is more immunodominant will be useful for understanding the immune response to JCV. In order to do so, stimulation of PBMCs by the individual amino acids of the clusters would better discern the areas of T-Ag that contribute to the immune recognition of the protein. The lower production of these cytokines in cancer patients may be due to the presence of a tumor in the body; however, most patients still responded in a Th1-type manner, and to most of the peptides. This is in contrast to cervical cancer patients when PBMCs were cultured with HPV 16 E7 peptide clusters. Only 40% of the protein stimulated a high response.Citation38 This may indicate that the T-Ag of JCV is more immunogenic than E7 of HPV. Our initial hypothesis that patients with APs and cancers would have an altered immune response for all the cytokines tested was not supported by our data. While there was a slightly diminished response compared with patients with a negative colonoscopy, it was not significantly different. These data do not demonstrate that an altered immune response to JCV T-Ag in patients with colorectal neoplasia is an indicator of viral involvement in the cancer.
Patients and Materials and Methods
Patients
Sixty patients undergoing colonoscopy or colorectal surgery provided informed consent for blood collection prior to the procedure. Blood was provided prior to the procedure and used to isolate PBMCs. Patients ranged from 17 to 94 years of age and potential subjects were excluded for previous chemotherapy, radiation therapy, or chronic infection, such as HIV or hepatitis B virus. Patients were grouped according to colonoscopy results: negative or hyperplastic polyp present, adenomatous polyp present, or adenocarcinoma present. Any adenomatous polyps removed during surgery where confirmed to be adenomatous polyps and not adenocarcinoma. The protocol for human sample collection and use was approved the Baylor University Medical Center’s Institutional Review Board.
Sample collection and cell culture
Immediately after the blood draw, PBMCs were isolated by Ficoll (Amersham Biosciences, 17144002) separation and stained with 5,-6-carboxyfluorescein diacetate succinimidyl ester (CFSE; Molecular Probes, V12883) and resuspended in RPMI 1640 (Gibco, 21870) supplemented with HEPES (Gibco, 15630), non-essential amino acids (Sigma-Aldrich, M7145), penicillin/streptomycin (Sigma-Aldrich, P4458), L-glutamine (Sigma-Aldrich, G7513), sodium pyruvate (Sigma-Aldrich, S8636), and 2-mercaptoethanol (Sigma-Aldrich, M7522). Subsequently, 5 × 10⁵ PBMCs/well were plated in triplicate in a 96-deep well plate (Nunc, 260251) with T-Ag clusters, Staphylococcal Enterotoxin B (Sigma-Aldrich, 50812; positive control), or 50% acetonitrile (Sigma-Aldrich, 271004; negative control). The cells were incubated at 37 °C, 5% CO2 for eight days with fresh media added on day two.
JCV T antigen clusters
A commercially (Mimotopes, custom) prepared library of JCV T-Ag peptides was used to stimulate the PBMCs in culture. The library contains 170 amino acid peptides with 10 peptides in each cluster that overlapped the neighboring clusters by 4 peptides (). Peptides were resuspended in 50% acetonitrile to a concentration of 10 mM and stored at -80 °C until use.
Table 2. The amino acids in the peptide clusters for T Antigen stimulation of PBMCs
Cytokine analysis
On day 2 of the PBMC culture, media from the wells was collected without disturbing the cells. The supernatant was incubated with beads containing immobilized antibodies for the following cytokines: IL-2, IL-10, IL-13, and IP-10 (Luminex). Evaluation of cytokine expression level was determined by a Bio-Plex Luminex 200. The concentrations were calculated using Bio-Plex Manager software. Circumstances beyond our control necessitated a change in the standard lots after 15 patients were enrolled. The resulting concentration values did not change significantly but data are reported as fold difference in order to combine the two data sets.
Flow cytometry
On day eight of the PBMC culture, the cells were collected for evaluation by flow cytometry. The cells were stained with antibodies against CD3, CD4, CD8 (eBioscience, 45-0037-42, 17-0049-42, 12-0088-42), and CD45 (Molecular Probes, MHCD4530) to identify T cells. Cells were acquired on a FACS Canto II (BD Biosciences) and analyzed with FlowJo software (version 8.8.6, TreeStar).
Statistical analysis
All concentration and fold difference values were entered into GraphPad Prism for statistical analysis. The Kruskal-Wallis test with post hoc Dunn’s multiple comparisons were used to evaluate the differences between the three patient populations.
| Abbreviations: | ||
| AP | = | adenomatous polyps |
| CFSE | = | 5,-6-carboxyfluorescein diacetate succinimidyl ester |
| CRC | = | colorectal cancer |
| HIV | = | human immunodeficiency virus |
| HPV | = | human papillomavirus |
| IL | = | interleukin |
| IFN-γ | = | interferon γ |
| JCV | = | JC virus |
| PBMCs | = | peripheral blood mononuclear cells |
| PML | = | progressive multifocal leukoencephalopathy |
| T-Ag | = | T antigen |
Additional material
Download Zip (82.6 KB)Disclosure of Potential Conflicts of Interest
No potential conflict of interest was disclosed.
Acknowledgments
The authors thank the physicians, nurses and staff of Baylor University Medical Center Gastrointestinal Division and North Texas Colon and Rectal PA for referring patients and allowing access to their facilities. We also thank the FACS Core (Elizabeth Kowalski and Sebastien Coquery at Baylor Institute for Immunology Research [BIIR]) and the Luminex Core (Sandra Zurawski, Jill Plants, and Olivier Agouna-Deciat at BIIR) for their assistance. This work was supported by National Institutes of Health grant R01-CA098572 (C.R.B.). The funders had no role in study design, data collection and analysis, decision to publish, or preparation of the manuscript and the authors declare no conflict of interest.
References
- Padgett BL, Walker DL, ZuRhein GM, Eckroade RJ, Dessel BH. Cultivation of papova-like virus from human brain with progressive multifocal leucoencephalopathy. Lancet 1971; 1:1257 - 60; http://dx.doi.org/10.1016/S0140-6736(71)91777-6; PMID: 4104715
- Major EO, Neel JV. The JC and BK human polyoma viruses appear to be recent introductions to some South American Indian tribes: there is no serological evidence of cross-reactivity with the simian polyoma virus SV40. Proc Natl Acad Sci U S A 1998; 95:15525 - 30; http://dx.doi.org/10.1073/pnas.95.26.15525; PMID: 9861002
- Padgett BL, Walker DL. Natural history of human polyomavirus infections. In: Stevens JG, Ed; Persistent viruses. New York Academic Press 1978:751-8.
- Kitamura T, Kunitake T, Guo J, Tominaga T, Kawabe K, Yogo Y. Transmission of the human polyomavirus JC virus occurs both within the family and outside the family. J Clin Microbiol 1994; 32:2359 - 63; PMID: 7814466
- Kunitake T, Kitamura T, Guo J, Taguchi F, Kawabe K, Yogo Y. Parent-to-child transmission is relatively common in the spread of the human polyomavirus JC virus. J Clin Microbiol 1995; 33:1448 - 51; PMID: 7650165
- Kean JM, Rao S, Wang M, Garcea RL. Seroepidemiology of human polyomaviruses. PLoS Pathog 2009; 5:e1000363; http://dx.doi.org/10.1371/journal.ppat.1000363; PMID: 19325891
- Grinnell BW, Padgett BL, Walker DL. Distribution of nonintegrated DNA from JC papovavirus in organs of patients with progressive multifocal leukoencephalopathy. J Infect Dis 1983; 147:669 - 75; http://dx.doi.org/10.1093/infdis/147.4.669; PMID: 6302171
- Monaco MC, Jensen PN, Hou J, Durham LC, Major EO. Detection of JC virus DNA in human tonsil tissue: evidence for site of initial viral infection. J Virol 1998; 72:9918 - 23; PMID: 9811728
- Houff SA, Major EO, Katz DA, Kufta CV, Sever JL, Pittaluga S, Roberts JR, Gitt J, Saini N, Lux W. Involvement of JC virus-infected mononuclear cells from the bone marrow and spleen in the pathogenesis of progressive multifocal leukoencephalopathy. N Engl J Med 1988; 318:301 - 5; http://dx.doi.org/10.1056/NEJM198802043180507; PMID: 2827029
- Frisque RJ. Structure and function of JC virus T’ proteins. J Neurovirol 2001; 7:293 - 7; http://dx.doi.org/10.1080/13550280152537120; PMID: 11517405
- Ohsumi S, Ikehara I, Motoi M, Ogawa K, Nagashima K, Yasui K. Induction of undifferentiated brain tumors in rats by a human polyomavirus (JC virus). Jpn J Cancer Res 1985; 76:429 - 31; PMID: 2991057
- Walker DL, Padgett BL, ZuRhein GM, Albert AE, Marsh RF. Human papovavirus (JC): induction of brain tumors in hamsters. Science 1973; 181:674 - 6; http://dx.doi.org/10.1126/science.181.4100.674; PMID: 4353360
- London WT, Houff SA, Madden DL, Fuccillo DA, Gravell M, Wallen WC, Palmer AE, Sever JL, Padgett BL, Walker DL, et al. Brain tumors in owl monkeys inoculated with a human polyomavirus (JC virus). Science 1978; 201:1246 - 9; http://dx.doi.org/10.1126/science.211583; PMID: 211583
- Brodsky JL, Pipas JM. Polyomavirus T antigens: molecular chaperones for multiprotein complexes. J Virol 1998; 72:5329 - 34; PMID: 9620985
- Sullivan CS, Tremblay JD, Fewell SW, Lewis JA, Brodsky JL, Pipas JM. Species-specific elements in the large T-antigen J domain are required for cellular transformation and DNA replication by simian virus 40. Mol Cell Biol 2000; 20:5749 - 57; http://dx.doi.org/10.1128/MCB.20.15.5749-5757.2000; PMID: 10891510
- Laghi L, Randolph AE, Chauhan DP, Marra G, Major EO, Neel JV, Boland CR. JC virus DNA is present in the mucosa of the human colon and in colorectal cancers. Proc Natl Acad Sci U S A 1999; 96:7484 - 9; http://dx.doi.org/10.1073/pnas.96.13.7484; PMID: 10377441
- Ricciardiello L, Chang DK, Laghi L, Goel A, Chang CL, Boland CR. Mad-1 is the exclusive JC virus strain present in the human colon, and its transcriptional control region has a deleted 98-base-pair sequence in colon cancer tissues. J Virol 2001; 75:1996 - 2001; http://dx.doi.org/10.1128/JVI.75.4.1996-2001.2001; PMID: 11160700
- Enam S, Del Valle L, Lara C, Gan DD, Ortiz-Hidalgo C, Palazzo JP, Khalili K. Association of human polyomavirus JCV with colon cancer: evidence for interaction of viral T-antigen and beta-catenin. Cancer Res 2002; 62:7093 - 101; PMID: 12460931
- Niv Y, Vilkin A, Brenner B, Kendel Y, Morgenstern S, Levi Z. hMLH1 promoter methylation and JC virus T antigen presence in the tumor tissue of colorectal cancer Israeli patients of different ethnic groups. Eur J Gastroenterol Hepatol 2010; 22:938 - 41; http://dx.doi.org/10.1097/MEG.0b013e32832e9d2c; PMID: 20531010
- Link A, Shin SK, Nagasaka T, Balaguer F, Koi M, Jung B, Boland CR, Goel A. JC virus mediates invasion and migration in colorectal metastasis. PLoS One 2009; 4:e8146; http://dx.doi.org/10.1371/journal.pone.0008146; PMID: 19997600
- Del Valle L, White MK, Enam S, Piña Oviedo S, Bromer MQ, Thomas RM, Parkman HP, Khalili K. Detection of JC virus DNA sequences and expression of viral T antigen and agnoprotein in esophageal carcinoma. Cancer 2005; 103:516 - 27; http://dx.doi.org/10.1002/cncr.20806; PMID: 15630684
- Shin SK, Li MS, Fuerst F, Hotchkiss E, Meyer R, Kim IT, Goel A, Boland CR. Oncogenic T-antigen of JC virus is present frequently in human gastric cancers. Cancer 2006; 107:481 - 8; http://dx.doi.org/10.1002/cncr.22028; PMID: 16795066
- Yamaoka S, Yamamoto H, Nosho K, Taniguchi H, Adachi Y, Sasaki S, Arimura Y, Imai K, Shinomura Y. Genetic and epigenetic characteristics of gastric cancers with JC virus T-antigen. World J Gastroenterol 2009; 15:5579 - 85; http://dx.doi.org/10.3748/wjg.15.5579; PMID: 19938198
- Ramamoorthy S, Devaraj B, Miyai K, Luo L, Liu YT, Boland CR, Goel A, Carethers JM. John Cunningham virus T-antigen expression in anal carcinoma. Cancer 2011; 117:2379 - 85; http://dx.doi.org/10.1002/cncr.25793; PMID: 24048785
- Fernández O. Best practice in the use of natalizumab in multiple sclerosis. Ther Adv Neurol Disord 2013; 6:69 - 79; http://dx.doi.org/10.1177/1756285612470401; PMID: 23483450
- Jilek S, Jaquiéry E, Hirsch HH, Lysandropoulos A, Canales M, Guignard L, Schluep M, Pantaleo G, Du Pasquier RA. Immune responses to JC virus in patients with multiple sclerosis treated with natalizumab: a cross-sectional and longitudinal study. Lancet Neurol 2010; 9:264 - 72; http://dx.doi.org/10.1016/S1474-4422(10)70006-5; PMID: 20117055
- Khanna N, Wolbers M, Mueller NJ, Garzoni C, Du Pasquier RA, Fux CA, Vernazza P, Bernasconi E, Viscidi R, Battegay M, et al, Swiss HIV Cohort Study. JC virus-specific immune responses in human immunodeficiency virus type 1 patients with progressive multifocal leukoencephalopathy. J Virol 2009; 83:4404 - 11; http://dx.doi.org/10.1128/JVI.02657-08; PMID: 19211737
- Palucka AK, Ueno H, Connolly J, Kerneis-Norvell F, Blanck JP, Johnston DA, Fay J, Banchereau J. Dendritic cells loaded with killed allogeneic melanoma cells can induce objective clinical responses and MART-1 specific CD8+ T-cell immunity. J Immunother 2006; 29:545 - 57; http://dx.doi.org/10.1097/01.cji.0000211309.90621.8b; PMID: 16971810
- Vence L, Palucka AK, Fay JW, Ito T, Liu YJ, Banchereau J, Ueno H. Circulating tumor antigen-specific regulatory T cells in patients with metastatic melanoma. Proc Natl Acad Sci U S A 2007; 104:20884 - 9; http://dx.doi.org/10.1073/pnas.0710557105; PMID: 18093940
- Chujo D, Foucat E, Nguyen TS, Chaussabel D, Banchereau J, Ueno H. ZnT8-Specific CD4+ T cells display distinct cytokine expression profiles between type 1 diabetes patients and healthy adults. PLoS One 2013; 8:e55595; http://dx.doi.org/10.1371/journal.pone.0055595; PMID: 23390544
- Quah BJ, Parish CR. The use of carboxyfluorescein diacetate succinimidyl ester (CFSE) to monitor lymphocyte proliferation. J Vis Exp 2010; http://dx.doi.org/10.3791/2259; PMID: 20972413
- Fiorentino DF, Bond MW, Mosmann TR. Two types of mouse T helper cell. IV. Th2 clones secrete a factor that inhibits cytokine production by Th1 clones. J Exp Med 1989; 170:2081 - 95; http://dx.doi.org/10.1084/jem.170.6.2081; PMID: 2531194
- Finkelman FD, Shea-Donohue T, Goldhill J, Sullivan CA, Morris SC, Madden KB, Gause WC, Urban JF Jr.. Cytokine regulation of host defense against parasitic gastrointestinal nematodes: lessons from studies with rodent models. Annu Rev Immunol 1997; 15:505 - 33; http://dx.doi.org/10.1146/annurev.immunol.15.1.505; PMID: 9143698
- Zurawski G, de Vries JE. Interleukin 13, an interleukin 4-like cytokine that acts on monocytes and B cells, but not on T cells. Immunol Today 1994; 15:19 - 26; http://dx.doi.org/10.1016/0167-5699(94)90021-3; PMID: 7907877
- Walker E, Leemhuis T, Roeder W. Murine B lymphoma cell lines release functionally active interleukin 2 after stimulation with Staphylococcus aureus. J Immunol 1988; 140:859 - 65; PMID: 3123551
- Farrar JJ, Benjamin WR, Hilfiker ML, Howard M, Farrar WL, Fuller-Farrar J. The biochemistry, biology, and role of interleukin 2 in the induction of cytotoxic T cell and antibody-forming B cell responses. Immunol Rev 1982; 63:129 - 66; http://dx.doi.org/10.1111/j.1600-065X.1982.tb00414.x; PMID: 7042543
- Jiang H, Chess L. An integrated view of suppressor T cell subsets in immunoregulation. J Clin Invest 2004; 114:1198 - 208; http://dx.doi.org/10.1172/JCI23411; PMID: 15520848
- Lee YS, Lee CW, Song MJ, Ho EM, Kim CJ, Park TC, Kim TG, Park JS. Cell-mediated immune response to human papillomavirus 16 E7 peptide pools in patients with cervical neoplasia. Acta Obstet Gynecol Scand 2011; 90:1350 - 6; http://dx.doi.org/10.1111/j.1600-0412.2011.01277.x; PMID: 21916856

