 ?Mathematical formulae have been encoded as MathML and are displayed in this HTML version using MathJax in order to improve their display. Uncheck the box to turn MathJax off. This feature requires Javascript. Click on a formula to zoom.
Abstract
Intrinsically disordered proteins (IDPs) are either entirely disordered or contain disordered regions in their native state. IDPs were found to be abundant in complex organisms and implicated in numerous cellular processes. Experimental annotation of disorder lags behind the rapidly growing sizes of the protein databases, and thus computational methods are used to close this gap and to investigate the disorder. MFDp2 is a novel content-rich and user-friendly web server for sequence-based prediction of protein disorder that builds upon our residue-level disorder predictor MFDp and chain-level disorder content predictor DisCon. It applies novel post-processing filters and uses sequence alignment to improve predictive quality. Using a new benchmark data set, which has reduced sequence identity to corresponding training data sets, MFDp2 is shown to provide competitive predictive quality when compared with MFDp and a comprehensive set of 13 other state-of-the-art predictors, including publicly available versions of the top predictors from CASP9. Our server obtains the highest Mathews Correlation Coefficient (MCC) and the second best Area Under the receiver operating characteristic Curve (AUC). In addition to the disorder predictions, our server also outputs well-described sequence-derived information that allows profiling the predicted disorder. We conveniently visualize sequence conservation, predicted secondary structure, relative solvent accessibility and alignments to chains with annotated disorder. We allow predictions for multiple proteins at the same time and each prediction can be downloaded as text-based (parsable) file. The web server, which includes help pages and tutorial, is freely available at biomine.ece.ualberta.ca/MFDp2/.
Introduction
The intrinsically disordered proteins (IDPs), also called intrinsically unstructured or natively unfolded, are either entirely disordered or contain disordered regions in their native state. These proteins were found to be implicated in numerous cellular processes including signal transduction, transcriptional regulation, and translation,Citation1 protein–DNACitation2 and protein–proteinCitation3 interactions. The disorder was demonstrated to play role in several human diseases,Citation4,Citation5 including AIDS,Citation6 cancer,Citation7 cardiovascular disease,Citation8 neurodegenerative diseases,Citation9,Citation10 genetic diseasesCitation11 and amyloidosis.Citation12 Moreover, IDPs have been shown to be abundant in complex organisms.Citation6,Citation13,Citation14 Experimental annotation of disorder lags behind the rapidly growing sizes of the protein databases and thus computational methods are used to close this gap and to investigate the disorder. A curated repository of IDPs, Disprot version 6.01,Citation15 contains 684 chains, whereas the Protein Data Bank (PDB),Citation16 which allows finding unstructured/disordered segments in the solved tertiary structures, includes over 82,000 protein entries. To compare, the current 57 release of RefSeq databaseCitation17 boasts over 27.8 million of non-redundant protein sequences.
The computational methods that predict disorder from protein chains can be divided into four categories: (1) approaches that utilize the relative propensity of amino acids to form disorder/ordered regions,Citation18-Citation21 (2) methods that are based on classifiers generated with the help of machine learning algorithms,Citation22-Citation37 (3) meta-methods that are based on a consensus of multiple base predictorsCitation38-Citation44 and iv) approaches that find disordered residues through an analysis of the predicted 3D structural models.Citation27,Citation45 The disorder prediction is part of the biannual Critical Assessment of techniques for protein Structure Prediction (CASP) experiments since 2002,Citation46 which further signifies interest in this area. Although accuracy of the predictors continues to rise,Citation47,Citation48 the most recent evaluated CASP9 experiment observed lack/small progress in the last couple of years.Citation49 New and more accurate methods are needed, particularly those that are accessible to the end users via convenient web servers. Beside the abovementioned approaches that predict the disorder at the residue level, a few methods that predict propensity of the entire protein chain to be disordered were proposed.Citation50-Citation54 Although these methods were shown to outperform the residues level approaches in some aspects, e.g., in prediction of the disorder content that is defined as fraction of disordered residues in a given protein chain,Citation50,Citation55 they were explored to enhance the residue level predictions only very recently.Citation50 To this end, we present and benchmark a novel disorder predictor, MFDp2, that combines residue-level (using MFDpCitation39) and sequence-level (using DisConCitation50) predictions to improve predictive quality. MFDp2 is implemented as content-rich and user-friendly web server, which allows predictions from individual and multiple protein chains and provides additional helpful information to profile the predicted disorder.
Results and Discussion
Evaluation on the benchmark data set
We evaluated MFDp2 and compared it against 14 state-of-the-art (18 with sub-versions) disorder predictors on the DP_NEW data set, which has low sequence identity with the training data sets used to build MFDp and DisCon. We considered other predictors that are available to the end user either as web servers or standalone implementations; we use the newest versions of these methods. They include publicly available versions of the top predictors from CASP9, such as PrDos, DISOPRED, Multicom (also called PreDisorder), SPINE-D and MFDp. The considered methods include three fast versions of ESpritz (X, N and D)Citation22 with threshold selected to achieve 5% FPR as this threshold results in higher MCC values (compared with the second suggested threshold that optimizes the Sw measure), SPINE-D,Citation59 two versions of CSpritz (CSpritz Long and CSpritz Short),Citation38 MFDp,Citation39 PONDRFIT,Citation40 MD,Citation42 PreDisorder,Citation41 DISOCLUST,Citation45 PrDos,Citation27 NORSnet,Citation25 UCON,Citation18 two versions of IUPred (IUPred Long and IUPred Short),Citation20 PROFBVALCitation32 and DISOPRED2.Citation36 PROFBVAL is designed to predict b-factors of residues, which are different than propensity for disorder; however, this method is included here since it is one of inputs of MFDp2 and was often included in related studies.Citation39,Citation42 The results are summarized in . Similarly as in other relevant works,Citation38,Citation39,Citation50,Citation55 the unannotated residues in the DP_NEW data set are assumed to be ordered. Results marked as PSI-BLAST were obtained by aligning to disordered segments in the MxD data set, as described in the Materials and Methods section (subsection MFDp2). They are listed to investigate the impact of the inclusion of the alignment on the results from MFDp2.
Table 1. Comparison of MFDp2 against disorder predictors where residues without annotations are assumed ordered.
When considering the evaluation at the residue level, MFDp2 offers competitive predictive quality with the highest MCC and second best AUC. The improvements over the existing methods are statistically significant in almost all of the cases. Using the MCC and AUC measures, which were utilized in the most recent CASP9 experiment to evaluate binary predictions and probabilities,Citation49 MFDp2 provides similar predictive performance to CSpritz Long and outperforms all other considered methods, by a moderate to large margin that is in most cases statistically significant. We note that differences between MFDp and MFDp2 (including versions with and without the use of alignment with BLAST) are statistically significant since these methods generate similar results for similar chains, where MFDp2 provides consistent improvements. For the disorder content prediction, which is evaluated at the chain level, a few methods, such as PrDos, ESpritz and IUPred, outperform MFDp2. However, these methods are (significantly) outranked by MFDp2 for the residue level predictions. That means that these methods predict the number of disorder residues more accurately, but they do not predict their position in a sequence as accurately as MFDp2 does. The CSpritz Long method, which provides predictions that are comparable to MFDp2 at the residue level, tends to overpredict the disorder, which is indicated by higher errors in content prediction and high QD obs coupled with a relatively low QD pred.
Comparison of the MFDp2 on the DP_NEW data set where the unannotated residues are removed from the evaluation is presented in . In this case we could not evaluate the prediction of the disorder content since this chain level measure cannot be calculated when annotations for some residues are missing. MFDp2 achieves the highest MCC and AUC. These improvements are statistically significant, although in some cases the magnitude of the differences is moderate, e.g., MFDp2 improves over MFDp in AUC by 0.013. This small difference is statistically significant since MFDp and MFDp2 generate similar predictions for similar chains, with a moderate improvement in favor of MFDp2. The MFDp2 method also secures third best rank in QO obs, fourth in QD obs and QO pred, as well as the highest value of QD pred (when we exclude blast alignment which only detects 0.5% of disordered residues). The values of QD pred demonstrate that over 80% of the disorder predictions by MFDp2 are in fact correct. We note that all considered methods have higher values of the corresponding quality meters (except for the QD obs, which does not change since the number of disorder residues is the same) when compared with the evaluation where residues with the unknown annotation were assumed to be ordered ().
Table 2. Comparison of MFDp2 against disorder predictors where residues without annotations are disregarded.
We also analyze improvements gained by enrichment of the predictions with the use of the alignment against the disorder segments from the training data set. The results in the last row in and reveal that BLAST, which is used as described in the Materials and Methods section, predicts a small number of disorder residues (low QD obs) but with high quality (high QD pred). The low QD obs can be explained by the fact that the similarity between the test chains and the chains in the alignment (training) data set is relatively low. The inclusion of BLAST-based alignment into MFDp2 (see the first two rows in and ) results in small but statistically significant (i.e., consistent) improvements. Moreover, differences in the QD obs measure reveal that almost all disordered residues that were predicted based on the alignment were not predicted by MFDp2 without the alignment, i.e., the QD obs is improved by about 0.5 between MFDp2 and MFDp2no blast, which is consistent with the QD obs of BLAST.
Importantly, for both evaluations (when removing unannotated resides or assuming that they are ordered) MFDp2 is shown to improve over its predecessor MFDp based on the key performance indices including MCC, AUC and MAE. This indicates that optimizing MFDp predictions using the chain-level disorder content predicted by DisCon and adding annotations from aligned disorder regions is beneficial.
Overview and presentation of the web server
The web server is designed to be simple to use. The submission page includes a text field where up to 100 protein sequences in FASTA format can be pasted and another text field for a user email. The email is optional and is used to send notification once the predictions are completed. Server also provides an option to submit proteins in FASTA-formatted file. The results are also shown and linked directly in a browser window. Once the protein sequences are provided, the user clicks “Run MFDp2” button, and this job is added to server’s queue. We process the requests in the order in which they were received. The user receives updates concerning the position of their job in the queue and confirmation once the job is being processed. Once computations are finished, the user receives direct links to the location of the results; the same links are sent via email, if it was provided. The results are stored online for at least 3 mo following the submission. The MFDp2’s execution time is approximately 5–15 min for an average size protein chain. The time is mostly determined by the time to run PSI-BLAST and is comparable to other predictors such as CSpritz, MD and DISOPRED2.
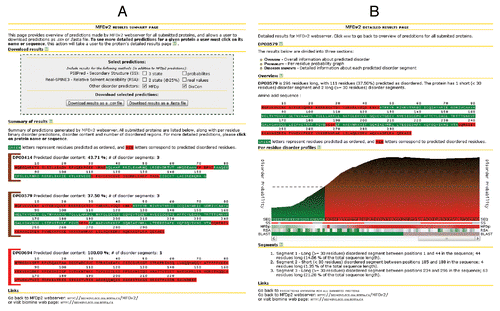
The results are displayed at two levels. The first level is an overview of all submitted proteins; see . It lists the query proteins and for each provides information about the predicted disorder content, number of disorder segments and color-coded sequence where red/green residues correspond to predicted disordered/ordered residues. Clicking on a protein name or sequence redirects the user to another (second level) page with detailed information about the predicted disorder for this protein; see . This page includes comprehensive information that allows profiling the predicted disorder. The profile includes conveniently visualized information concerning predicted secondary structure, relative solvent accessibility, profiles of disorder predictions that are used by MFDp2 and PSI-BLAST-based sequence alignment. The profile is color-coded to ease the interpretation where a spectrum of colors between red and green corresponds to the bias toward disordered and ordered conformations, respectively. For instance, using the example from , we observe that the disordered segment predicted by MFDp2 at the C-terminus (top of the panel B) is predicted by PSIPREDCitation57 to include two helical segments, predicted by MFDp to be disordered, is solvent inaccessible as predicted by Real-SPINE3,Citation58 and part of this disordered segments was enriched using alignment with PSI-BLAST. This page also contains a list of predicted disorder segments along with their sequence, length, position in the chain and size relative to the size of the full chain. The overview page (see ) offers an option to download predictions as parsable text files. Along with the MFDp2 predictions, the user may choose to download additional information including predictions from MFDp and DisCon, secondary structure predicted by PSIPRED and relative solvent accessibility predicted by Real-SPINE3. The text files can be downloaded in two formats: as comma-separable CSV and/or FASTA.
Figure 1. Screenshots of the pages that present results generated by the MFDp2 web server. (A) shows the overview page where basic information about predicted disorder for all submitted proteins is displayed. (B) shows a detailed results page where more detailed information about predicted disorder for a selected protein is presented.
The help and tutorial page can be accessed at the top of the main web server page. This page provides tutorial on how to use the web server and detailed explanations on how to read the results. Individual subsections of this page are hyperlinked within this page and from the pages that the user encounters when interacting with the server to ease reading and finding of this information. The explanations are supplemented with annotated screenshots. The “?” buttons are placed thorough all web server pages next to the sections which may require explanation. These buttons implement direct hyperlinks to the help and hints related to the selected section/task.
Materials and Methods
MFDp2 uses the disorder content predicted by DisConCitation50 to correct the per-residue predictions generated with MFDp.Citation39 These corrected predictions are processed, by transformation of probabilities and sliding window-based averaging, to further improve predictive performance. Finally, predictions are enriched by PSI-BLASTCitation56 alignments to (training) chains with annotated disordered segments; we transfer annotated disordered residues from the aligned positions.
MFDp and DisCon
MFDp is an ensemble of three Support Vector Machines specialized for the prediction of short (< 30 residues; SVMSHORT), long (≥ 30 residues; SVMLONG) and generic disordered regions (all disordered residues; SVMALL). This ensemble combines results generated by three disorder predictors together with the information extracted from the input sequence, sequence profiles (PSI-BLASTCitation56) and predicted secondary structure (PSIPREDCitation57), solvent accessibility (Real-SPINE3Citation58), backbone dihedral torsion angles (Real-SPINE3), residue flexibility and B-factors (PROFbvalCitation32). MFDp utilizes a custom-designed set of features that are based on raw predictions and aggregated (using sequence window) raw values. The real-valued prediction is computed as a maximum among the probabilities generated by SVMALL, SVMSHORT and SVMLONG (we combine all predicted disordered residues), and the resulting value is binarized using the threshold = 0.37. In the final step, the predictions are filtered to remove short (2 or fewer residues) disordered segments. A method based on MFDp was ranked second best in the binary disorder prediction in the most recent CASP9.Citation49
DisCon uses a small set of 29 custom-designed numerical descriptors that hybridize information concerning the input sequence, evolutionary profiles (PSI-BLAST), and predicted secondary structure (PSIPRED), solvent accessibility (Real-SPINE3), flexibility (PROFbval) and annotation of globular domains (IUpredCitation20). The features aggregate the abovementioned predicted structural and functional properties over the entire input protein chain and their values are fed into a ridge regression model that is used to generate the disorder content. The output is a real value in the [0, 1] range that corresponds to the predicted fraction of disordered residues in the input protein. DisCon was shown to predict the per-protein disorder content more accurately than MFDp and several other disorder predictors.Citation50
MFDp2
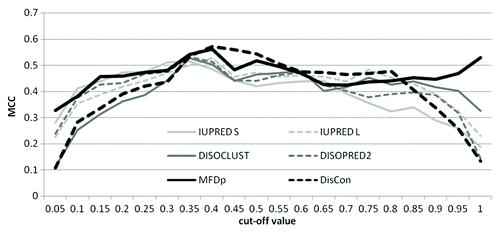
The overall architecture of MFDp2, which shows how MFDp and DisCon are combined together and enriched, is presented in . The predictions generated by MFDp2 are based on the per-residue disorder probabilities outputted by MFDp, which were converted into binary disorder predictions using the default threshold of 0.37. We analyzed this conversion using a benchmark data set, called MxD, which was used to evaluate MFDp.Citation39 We investigated the ability of MFDp to distinguish between proteins with high and low amount of disorder, i.e., above and below a cut-off value that is varied between 0 and 1 with step of 0.05, and compared it to the results of DisCon. The cut-offs at 0 and 1 correspond to detection of the fully ordered and fully disordered chain, respectively; the intermediate cut-offs correspond to a binary prediction that finds partially structured vs. partially unstructured chains, see . Our analysis shows that DisCon outperforms MFDp in the above binary protein level prediction when the MFDp predicted content is between 0.35 and 0.85. Consequently, we change the threshold used by MFDp to match the content predicted by DisCon when the content predicted by MFDp is between 0.35 and 0.85, and otherwise we use the default 0.37 threshold. Next, the resulting thresholds are shifted to 0.5, which is a value recommended in the CASP experiments. Specifically, we use min-max normalization to shift (0, threshold) range to (0, 0.5) and to transform (threshold, 1) range to (0.5, 1). While shifting probabilities, we also adjust their values taking into account the predicted disorder content, i.e., we increase probabilities for predicted disorder residues for proteins with high-predicted disorder content and decrease probabilities for residues predicted as ordered for proteins with low disorder content. Finally, we average the resulting probabilities using a sliding window with 21 residues. This step smoothes out the probability profiles; we used it to improve MFDp’s predictions for the CASP9. We selected the window size that provides the highest MCC when predicting disorder on the MxD data set. Afterwards, we remove (by adjusting probabilities) predicted ordered and disordered segments that are shorter than 4 residues, similarly as in the original MFDp.Citation39 Finally, the resulting predictions are enriched with disorder segments found by PSI-BLASTCitation56 against the training data set. This step was introduced to improve prediction accuracy by finding protein fragments that are similar to the disordered segments in the training data set. We hypothesize that segments in the input protein chain that are very similar or identical to the disordered segments in other proteins are likely to be disordered, and that the probability associated with their predicted disorder should be higher if they are aligned to a larger number of natively disordered segments. We use BLAST-based alignment to find similar segments. We also made sure to properly validate this approach, so that we do not overtif the results by allowing high similarity between training chains (that are aligned to) and test chains (that are inputs for the alignment); when testing MFDp2, we used the MxD data set as the training data set and a test data set that shares low sequence identity with the MxD set (see Dataset section). We perform alignment with default parameters against chains in the training data set and consider all alignments below 0.001 e-value threshold; this cut-off was found to be optimal based on 5-fold cross-validation on the MxD data set. For each position in a given query sequence we count n, which is the number of aligned disordered residues across all aligned sequences that satisfy the threshold. If n = 0 then we do not change the current output from MFDp2. For every position where n ≥ 1 and which belongs to a segment of at least three consecutive residues with n ≥ 1, we compute the final probability, which is outputted by MFDp2, as:
Figure 2. Architecture of MFDp2.
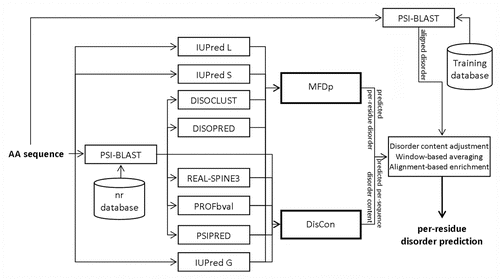
Figure 3. Selection of disorder content thresholds for MFDp2 using sequence-based binary predictions. The MCC values (y-axis) for the sequence-based binary prediction where the labels are defined as 1/0 when the amount of the native disorder is below/above a cut-off value shown on the x-axis, respectively. The binary predictions are computed by thresholding the predicted disorder content generated by DisCon, MFDp and the four disorder predictors that are used as input to MFDp. The results were generated using the MxD data set and details concerning this analysis could be found in reference Citation50.
where pr(i) is the probability of disorder for ith residue in a query chain generated by MFDp2 before the alignment is added, “1.5” is a constant that assures that the final probability will be ≥ 0.5 when n ≥ 1 [given n = 1, the result will be (pr(i) + 1)/2 = pr(i)/2 + 0.5, which is ≥ 0.5 for any pr(i); given n = 2, the result will be pr(i)/2 + 0.625], and minimum is used to assure that the final probability does not exceed 1.
Dataset
We follow definition of disorder as in,Citation39 i.e., we use two types of annotations to label disordered residues: PDB REMARK 465 and curated annotations extracted from Disprot database.Citation15 We validate our web server and compare it with 14 state-of-the-art competing methods on proteins added to Disprot after release 4.6 (which was used to build the MxD data set that was utilized to build MFDp and DisCon methods) and to PDBCitation16 after August 1, 2011. Among these proteins, we removed those that share over 25% sequence identity to any chain in the MxD data set and the training data sets used by one of the most recent disorder predictors CSpritz.Citation38 The remaining 105 proteins are unlikely to be used to build the other considered methods (they were deposited/annotated after these methods were developed) and share low similarity to our and CSpritz training proteins. These proteins were annotated using the Disprot and PDB disorder annotations, depending on their source. The PDB-based annotations follow the protocol from CASP.Citation49 The Disprot annotations were enriched with PDB REMARK 465 annotations following procedures described in.Citation55 Specifically, the chains taken from Disprot were searched using PSI-BLASTCitation56 against PDB (3 iterations, e-value < 0.001) and we selected the best hit with sequence identity ≥ 98% (over aligned region) and alignment coverage ≥ 90%. Using the alignment, the PDB-based disorder/order annotations were mapped for the aligned region, and we kept the original disorder annotations from Disprot. The native disordered segments smaller than 4 residues were ignored during evaluation of the final version of the database; this is consistent with CASP. We note that 22.4% of residues lack annotations. The reason is that residues in some proteins from Disprot lack annotations and the annotation for these residues were not transferred from PDB. Thus, we perform evaluations twice: (1) when assuming that these unannotated residues are ordered, which is consistent with several related studies,Citation38,Citation39,Citation50,Citation55 and (2) when disregarding these unannotated residues. Our benchmark data set with the 105 annotated proteins, called DP_NEW, is available on the web server page at biomine.ece.ualberta.ca/MFDp2/.
Evaluation and statistical analysis
The assessment of the predictions uses the same criteria as in the CASP experiments.Citation47-Citation49 Additionally, we also evaluate predicted disorder content. The predictions are at three levels: (1) the binary value that defines whether a given residue is or is not disordered, (2) the real value that quantifies probability of disorder and (3) a disorder content for a whole protein sequence. The binary predictions were assessed using five measures:
MCC = (TP*TN − FP*FN)/sqrt[(TP + FP)(TP + FN)(TN + FP)(TN + FN)]
QD observed (sensitivity) = TP/(TP + FN)
QD predicted = TP/(TP + FP)
QO observed (specificity) = TN/(TN + FP)
QO predicted = TN/(TN + FN)
where TP is the number of true positives (correctly predicted disordered residues), FP denotes false positives (ordered residues that were predicted as disordered),TN denotes true negatives (correctly predicted ordered residues) and FN stands for false negatives (disordered residues that were predicted ordered). The MCC values range between −1 and 1, and it is equal zero when all residues are predicted to be ordered or disordered. Higher values of these measures correspond to higher quality predictions. We do not include Q2 accuracy that was deemed unsuitable for disorder assessment in the last CASP9 evaluation.Citation49 Moreover, balanced accuracy (average of sensitivity and specificity) can be easily inferred from QD observed and QO observed that we report, and Sw was shown to be linearly related to balanced accuracy; thus it was not reported in CASP9 and we opted not to report it either.49
The Receiver Operating Characteristic (ROC) curve was used to examine the predicted probabilities. For each value of probability p generated by a given method, all the residues with probability equal to or greater than p are set as disordered, and all other residues are set as ordered. Next, the TP-rate and the FP-rate are calculated, and we use the area under the curve (AUC) to quantify the predictive quality.
The quality of the disorder content prediction was assessed using two popular measures:
Pearson Correlation Coefficient (PCC) = 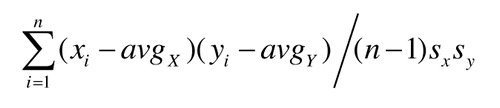
Mean Absolute Error (MAE) = 
where n is the sample size, yi∈Y is the native and xi∈X is the predicted disorder content for the ith protein chain, avgX and avgY are the sample means of X and Y, sx and sy are the sample standard deviations of X and Y. Following CASP evaluations, we are reporting MCC, AUC, MAE and PCC with three digits after the decimal point and the remaining scores with one digit after the decimal point.
Statistical significance of the differences between MFDp2 and the other considered predictors was measured based on values of the abovementioned quality measures over 10 repetitions on randomly chosen 2/3 of the proteins from the DP_NEW data set. The results were compared between a given pair of predictors using the homeostatic Student’s t-test (for equal variances) or Student’s t-test (otherwise) if distributions were normal, or with the Mann-Whitney test, if not. Distribution type was verified using the Anderson-Darling test, and equality of variances was tested with Bartlett's test.
Conclusions
We introduce a novel web server for disorder prediction, called MFDp2, which is based on MFDp disorder predictor and DisCon disorder content predictor. MFDp2 provides competitive per-residue and disorder content predictions when compared with its predecessor MFDp and 18 other state-of-the-art disorder predictors, including publicly available versions of the top predictors from CASP9. The server is free and open to all users, enables processing of large data sets and presents detailed results with a convenient color-coded disorder profile. The profile visualizes factors that influence the final prediction, including residue conservation, predicted secondary structure, solvent accessibility, flexibility, disorder predictions that are used by MFDp2 and sequence alignment. We provide an easy download of parsable text-based results along with user-selected additional information concerning predicted secondary structure and solvent accessibility. The server also includes tutorial and help pages to assist new users.
| Abbreviations: | ||
| AUC | = | area under the receiver operating characteristic curve |
| CASP | = | critical assessment of techniques for protein structure prediction |
| IDP | = | intrinsically disordered protein |
| MAE | = | mean absolute error |
| MCC | = | Mathews correlation coefficient |
| PCC | = | Pearson correlation coefficient |
| PDB | = | Protein Data Bank |
| SVM | = | support vector machine |
Acknowledgments
This work was supported by the Dissertation fellowship and the Izaak Walton Killam Memorial Scholarship awarded by University of Alberta to M.J.M., the Alberta Innovates Graduate Student Scholarship in Omics to Z.P. and the Discovery grant awarded by the Natural Sciences and Engineering Research Council of Canada to L.K.
Disclosure of Potential Conflicts of Interest
No potential conflicts of interest were disclosed.
References
- Dunker AK, Oldfield CJ, Meng J, Romero P, Yang JY, Chen JW, et al. The unfoldomics decade: an update on intrinsically disordered proteins. BMC Genomics 2008; 9:Suppl 2 S1; http://dx.doi.org/10.1186/1471-2164-9-S2-S1; PMID: 18831774
- Weiss MA, Ellenberger T, Wobbe CR, Lee JP, Harrison SC, Struhl K. Folding transition in the DNA-binding domain of GCN4 on specific binding to DNA. Nature 1990; 347:575 - 8; http://dx.doi.org/10.1038/347575a0; PMID: 2145515
- Russell RB, Gibson TJ. A careful disorderliness in the proteome: sites for interaction and targets for future therapies. FEBS Lett 2008; 582:1271 - 5; http://dx.doi.org/10.1016/j.febslet.2008.02.027; PMID: 18284921
- Uversky VN, Oldfield CJ, Midic U, Xie H, Xue B, Vucetic S, et al. Unfoldomics of human diseases: linking protein intrinsic disorder with diseases. BMC Genomics 2009; 10:Suppl 1 S7; http://dx.doi.org/10.1186/1471-2164-10-S1-S7; PMID: 19594884
- Uversky VN, Oldfield CJ, Dunker AK. Intrinsically disordered proteins in human diseases: introducing the D2 concept. Annu Rev Biophys 2008; 37:215 - 46; http://dx.doi.org/10.1146/annurev.biophys.37.032807.125924; PMID: 18573080
- Xue B, Mizianty MJ, Kurgan LA, Uversky VN. Protein intrinsic disorder as a flexible armor and a weapon of HIV-1. Cell Mol Life Sci 2012; 69:1211 - 59; http://dx.doi.org/10.1007/s00018-011-0859-3; PMID: 22033837
- Iakoucheva LM, Brown CJ, Lawson JD, Obradović Z, Dunker AK. Intrinsic disorder in cell-signaling and cancer-associated proteins. J Mol Biol 2002; 323:573 - 84; http://dx.doi.org/10.1016/S0022-2836(02)00969-5; PMID: 12381310
- Cheng Y, LeGall T, Oldfield CJ, Dunker AK, Uversky VN. Abundance of intrinsic disorder in protein associated with cardiovascular disease. Biochemistry 2006; 45:10448 - 60; http://dx.doi.org/10.1021/bi060981d; PMID: 16939197
- Raychaudhuri S, Dey S, Bhattacharyya NP, Mukhopadhyay D. The role of intrinsically unstructured proteins in neurodegenerative diseases. PLoS One 2009; 4:e5566; http://dx.doi.org/10.1371/journal.pone.0005566; PMID: 19440375
- Uversky VN. Intrinsic disorder in proteins associated with neurodegenerative diseases. Front Biosci 2009; 14:5188 - 238; http://dx.doi.org/10.2741/3594; PMID: 19482612
- Midic U, Oldfield CJ, Dunker AK, Obradovic Z, Uversky VN. Protein disorder in the human diseasome: unfoldomics of human genetic diseases. BMC Genomics 2009; 10:Suppl 1 S12; http://dx.doi.org/10.1186/1471-2164-10-S1-S12; PMID: 19594871
- Uversky VN. Amyloidogenesis of natively unfolded proteins. Curr Alzheimer Res 2008; 5:260 - 87; http://dx.doi.org/10.2174/156720508784533312; PMID: 18537543
- Ward JJ, Sodhi JS, McGuffin LJ, Buxton BF, Jones DT. Prediction and functional analysis of native disorder in proteins from the three kingdoms of life. J Mol Biol 2004; 337:635 - 45; http://dx.doi.org/10.1016/j.jmb.2004.02.002; PMID: 15019783
- Dunker AK, Obradovic Z, Romero P, Garner EC, Brown CJ. Intrinsic protein disorder in complete genomes. Genome Inform Ser Workshop Genome Inform 2000; 11:161 - 71; PMID: 11700597
- Sickmeier M, Hamilton JA, LeGall T, Vacic V, Cortese MS, Tantos A, et al. DisProt: the Database of Disordered Proteins. Nucleic Acids Res 2007; 35:Database issue D786 - 93; http://dx.doi.org/10.1093/nar/gkl893; PMID: 17145717
- Berman HM, Westbrook J, Feng Z, Gilliland G, Bhat TN, Weissig H, et al. The Protein Data Bank. Nucleic Acids Res 2000; 28:235 - 42; http://dx.doi.org/10.1093/nar/28.1.235; PMID: 10592235
- Pruitt KD, Tatusova T, Klimke W, Maglott DR. NCBI Reference Sequences: current status, policy and new initiatives. Nucleic Acids Res 2009; 37:Database issue D32 - 6; http://dx.doi.org/10.1093/nar/gkn721; PMID: 18927115
- Schlessinger A, Punta M, Rost B. Natively unstructured regions in proteins identified from contact predictions. Bioinformatics 2007; 23:2376 - 84; http://dx.doi.org/10.1093/bioinformatics/btm349; PMID: 17709338
- Prilusky J, Felder CE, Zeev-Ben-Mordehai T, Rydberg EH, Man O, Beckmann JS, et al. FoldIndex: a simple tool to predict whether a given protein sequence is intrinsically unfolded. Bioinformatics 2005; 21:3435 - 8; http://dx.doi.org/10.1093/bioinformatics/bti537; PMID: 15955783
- Dosztányi Z, Csizmok V, Tompa P, Simon I. IUPred: web server for the prediction of intrinsically unstructured regions of proteins based on estimated energy content. Bioinformatics 2005; 21:3433 - 4; http://dx.doi.org/10.1093/bioinformatics/bti541; PMID: 15955779
- Linding R, Russell RB, Neduva V, Gibson TJ. GlobPlot: Exploring protein sequences for globularity and disorder. Nucleic Acids Res 2003; 31:3701 - 8; http://dx.doi.org/10.1093/nar/gkg519; PMID: 12824398
- Walsh I, Martin AJM, Di Domenico T, Tosatto SCE. ESpritz: accurate and fast prediction of protein disorder. Bioinformatics 2012; 28:503 - 9; http://dx.doi.org/10.1093/bioinformatics/btr682; PMID: 22190692
- Wang L, Sauer UH. OnD-CRF: predicting order and disorder in proteins using [corrected] conditional random fields. Bioinformatics 2008; 24:1401 - 2; http://dx.doi.org/10.1093/bioinformatics/btn132; PMID: 18430742
- Hecker J, Yang JY, Cheng J. Protein disorder prediction at multiple levels of sensitivity and specificity. BMC Genomics 2008; 9:Suppl 1 S9; http://dx.doi.org/10.1186/1471-2164-9-S1-S9; PMID: 18366622
- Schlessinger A, Liu J, Rost B. Natively unstructured loops differ from other loops. PLoS Comput Biol 2007; 3:e140; http://dx.doi.org/10.1371/journal.pcbi.0030140; PMID: 17658943
- Su C-T, Chen C-Y, Hsu C-M. iPDA: integrated protein disorder analyzer. Nucleic Acids Res 2007; 35:Web Server issue W465-72; http://dx.doi.org/10.1093/nar/gkm353; PMID: 17553839
- Ishida T, Kinoshita K. PrDOS: prediction of disordered protein regions from amino acid sequence. Nucleic Acids Res 2007; 35:Web Server issue W460-4; http://dx.doi.org/10.1093/nar/gkm363; PMID: 17567614
- Shimizu K, Muraoka Y, Hirose S, Tomii K, Noguchi T. Predicting mostly disordered proteins by using structure-unknown protein data. BMC Bioinformatics 2007; 8:78; http://dx.doi.org/10.1186/1471-2105-8-78; PMID: 17338828
- Hirose S, Shimizu K, Kanai S, Kuroda Y, Noguchi T. POODLE-L: a two-level SVM prediction system for reliably predicting long disordered regions. Bioinformatics 2007; 23:2046 - 53; http://dx.doi.org/10.1093/bioinformatics/btm302; PMID: 17545177
- Peng K, Radivojac P, Vucetic S, Dunker AK, Obradovic Z. Length-dependent prediction of protein intrinsic disorder. BMC Bioinformatics 2006; 7:208; http://dx.doi.org/10.1186/1471-2105-7-208; PMID: 16618368
- Vullo A, Bortolami O, Pollastri G, Tosatto SCE. Spritz: a server for the prediction of intrinsically disordered regions in protein sequences using kernel machines. Nucleic Acids Res 2006; 34:Web Server issue W164-8; http://dx.doi.org/10.1093/nar/gkl166; PMID: 16844983
- Schlessinger A, Yachdav G, Rost B. PROFbval: predict flexible and rigid residues in proteins. Bioinformatics 2006; 22:891 - 3; http://dx.doi.org/10.1093/bioinformatics/btl032; PMID: 16455751
- Su C-T, Chen C-Y, Ou Y-Y. Protein disorder prediction by condensed PSSM considering propensity for order or disorder. BMC Bioinformatics 2006; 7:319; http://dx.doi.org/10.1186/1471-2105-7-319; PMID: 16796745
- Yang M, Yang J. IUP: Intrinsically Unstructured Protein predictor - A software tool for analyzing polypeptide sequences. In Sixth IEEE Symposium on BioInformatics and BioEngineering (BIBE’06) 2006:3-11.
- Peng K, Vucetic S, Radivojac P, Brown CJ, Dunker AK, Obradovic Z. Optimizing long intrinsic disorder predictors with protein evolutionary information. J Bioinform Comput Biol 2005; 3:35 - 60; http://dx.doi.org/10.1142/S0219720005000886; PMID: 15751111
- Ward JJ, McGuffin LJ, Bryson K, Buxton BF, Jones DT. The DISOPRED server for the prediction of protein disorder. Bioinformatics 2004; 20:2138 - 9; http://dx.doi.org/10.1093/bioinformatics/bth195; PMID: 15044227
- Jones DT, Ward JJ. Prediction of disordered regions in proteins from position specific score matrices. Proteins 2003; 53:Suppl 6 573 - 8; http://dx.doi.org/10.1002/prot.10528; PMID: 14579348
- Walsh I, Martin AJM, Di Domenico T, Vullo A, Pollastri G, Tosatto SCE. CSpritz: accurate prediction of protein disorder segments with annotation for homology, secondary structure and linear motifs. Nucleic Acids Res 2011; 39:Web Server issue W190-6; http://dx.doi.org/10.1093/nar/gkr411; PMID: 21646342
- Mizianty MJ, Stach W, Chen K, Kedarisetti KD, Disfani FM, Kurgan LA. Improved sequence-based prediction of disordered regions with multilayer fusion of multiple information sources. Bioinformatics 2010; 26:i489 - 96; http://dx.doi.org/10.1093/bioinformatics/btq373; PMID: 20823312
- Xue B, Dunbrack RL, Williams RW, Dunker AK, Uversky VN. PONDR-FIT: a meta-predictor of intrinsically disordered amino acids. Biochim Biophys Acta 2010; 1804:996 - 1010; http://dx.doi.org/10.1016/j.bbapap.2010.01.011; PMID: 20100603
- Deng X, Eickholt J, Cheng J. PreDisorder: ab initio sequence-based prediction of protein disordered regions. BMC Bioinformatics 2009; 10:436; http://dx.doi.org/10.1186/1471-2105-10-436; PMID: 20025768
- Schlessinger A, Punta M, Yachdav G, Kajan L, Rost B. Improved disorder prediction by combination of orthogonal approaches. PLoS One 2009; 4:e4433; http://dx.doi.org/10.1371/journal.pone.0004433; PMID: 19209228
- Ishida T, Kinoshita K. Prediction of disordered regions in proteins based on the meta approach. Bioinformatics 2008; 24:1344 - 8; http://dx.doi.org/10.1093/bioinformatics/btn195; PMID: 18426805
- Cheng J, Sweredoski MJ, Baldi P. Accurate Prediction of Protein Disordered Regions by Mining Protein Structure Data. Data Min Knowl Discov 2005; 11:213 - 22; http://dx.doi.org/10.1007/s10618-005-0001-y
- McGuffin LJ. Intrinsic disorder prediction from the analysis of multiple protein fold recognition models. Bioinformatics 2008; 24:1798 - 804; http://dx.doi.org/10.1093/bioinformatics/btn326; PMID: 18579567
- Melamud E, Moult J. Evaluation of disorder predictions in CASP5. Proteins 2003; 53:Suppl 6 561 - 5; http://dx.doi.org/10.1002/prot.10533; PMID: 14579346
- Noivirt-Brik O, Prilusky J, Sussman JL. Assessment of disorder predictions in CASP8. Proteins 2009; 77:Suppl 9 210 - 6; http://dx.doi.org/10.1002/prot.22586; PMID: 19774619
- Bordoli L, Kiefer F, Schwede T. Assessment of disorder predictions in CASP7. Proteins 2007; 69:Suppl 8 129 - 36; http://dx.doi.org/10.1002/prot.21671; PMID: 17680688
- Monastyrskyy B, Fidelis K, Moult J, Tramontano A, Kryshtafovych A. Evaluation of disorder predictions in CASP9. Proteins 2011; 79:Suppl 10 107 - 18; http://dx.doi.org/10.1002/prot.23161; PMID: 21928402
- Mizianty MJ, Zhang T, Xue B, Zhou Y, Dunker AK, Uversky VN, et al. In-silico prediction of disorder content using hybrid sequence representation. BMC Bioinformatics 2011; 12:245; http://dx.doi.org/10.1186/1471-2105-12-245; PMID: 21682902
- Xue B, Oldfield CJ, Dunker AK, Uversky VN. CDF it all: consensus prediction of intrinsically disordered proteins based on various cumulative distribution functions. FEBS Lett 2009; 583:1469 - 74; http://dx.doi.org/10.1016/j.febslet.2009.03.070; PMID: 19351533
- Oldfield CJ, Cheng Y, Cortese MS, Brown CJ, Uversky VN, Dunker AK. Comparing and combining predictors of mostly disordered proteins. Biochemistry 2005; 44:1989 - 2000; http://dx.doi.org/10.1021/bi047993o; PMID: 15697224
- Dunker AK, Lawson JD, Brown CJ, Williams RM, Romero P, Oh JS, et al. Intrinsically disordered protein. J Mol Graph Model 2001; 19:26 - 59; http://dx.doi.org/10.1016/S1093-3263(00)00138-8; PMID: 11381529
- Uversky VN, Gillespie JR, Fink AL. Why are “natively unfolded” proteins unstructured under physiologic conditions?. Proteins 2000; 41:415 - 27; http://dx.doi.org/10.1002/1097-0134(20001115)41:3<415::AID-PROT130>3.0.CO;2-7; PMID: 11025552
- Sirota FL, Ooi H-S, Gattermayer T, Schneider G, Eisenhaber F, Maurer-Stroh S. Parameterization of disorder predictors for large-scale applications requiring high specificity by using an extended benchmark dataset. BMC Genomics 2010; 11:Suppl 1 S15; http://dx.doi.org/10.1186/1471-2164-11-S1-S15; PMID: 20158872
- Altschul SF, Madden TL, Schäffer AA, Zhang J, Zhang Z, Miller W, et al. Gapped BLAST and PSI-BLAST: a new generation of protein database search programs. Nucleic Acids Res 1997; 25:3389 - 402; http://dx.doi.org/10.1093/nar/25.17.3389; PMID: 9254694
- McGuffin LJ, Bryson K, Jones DT. The PSIPRED protein structure prediction server. Bioinformatics 2000; 16:404 - 5; http://dx.doi.org/10.1093/bioinformatics/16.4.404; PMID: 10869041
- Faraggi E, Xue B, Zhou Y. Improving the prediction accuracy of residue solvent accessibility and real-value backbone torsion angles of proteins by guided-learning through a two-layer neural network. Proteins 2009; 74:847 - 56; http://dx.doi.org/10.1002/prot.22193; PMID: 18704931
- Zhang T, Faraggi E, Xue B, Dunker AK, Uversky VN, Zhou Y. SPINE-D: accurate prediction of short and long disordered regions by a single neural-network based method. J Biomol Struct Dyn 2012; 29:799 - 813; http://dx.doi.org/10.1080/073911012010525022; PMID: 22208280