Abstract
Phosphorylation is a common post-translational modification that plays important roles in a wide range of biochemical and cellular processes. Many enzymes and receptors can be switched “on” or “off” by conformational changes induced by phosphorylation. The phosphorylation process is mediated by a family of enzymes called kinase. Currently, more than 1,000 different kinases have been identified in Arabidopsis thaliana proteome. Kinases interact with each other and with many regulatory proteins forming phosphorylation networks. These phosphorylation networks modulate the signaling processes and control the functions of cells. Normally, kinases phosphorylate serines, threonines, and tyrosines. However, in many proteins, not all of these 3 types of amino acids can be phosphorylated. Therefore, identifying the phosphorylation sites and the possible phosphorylation events is very important in decoding the processes of regulation and the function of phosphorylation networks. In this study, we applied computational and bioinformatics tools to characterize the association between phosphorylation events and structural properties of corresponding proteins by analyzing more than 50 trans-membrane proteins from Arabidopsis thaliana. In addition to the previously established conclusion that phosphorylation sites are closely associated with intrinsic disorder, we found that the phosphorylation process may also be affected by solvent accessibility of phosphorylation sites and further promoted by neighboring modification events.
Introduction
Phosphorylation is an important post-translational modification performed by kinases that catalyze the addition of phosphate groups onto the target amino acids, such as serines, threonines, and tyrosines. In prokaryotes, phosphorylation can also affect histidine, aspartate,Citation1,Citation2 or even arginine and lysine.Citation3 Phosphorylation is a reversible process, and under appropriate conditions, phosphorylated residues can be dephosphorylated by phosphatases. In the process of phosphorylation, a phosphate group is attached to an amino acid via a covalent bond. As a result, the local polarity, charge, and even the local structure of the target protein are changed.Citation4 Following these local changes in the physicochemical properties and in the local structure, the interaction of a target protein with other molecules is influenced, giving raise to the controlled and reversible modulation of the specific protein function, and therefore, providing a way to control corresponding pathways. The importance of this posttranslational modification cannot be overestimated, and the reversible phosphorylation of the phosphorylated proteins was shown to play key roles in various processes of molecular signaling and regulationCitation5-Citation10 where the reversible phosphorylation acts frequently as a switch controlling various signaling processes.Citation11
Phosphorylation is one of the most abundant posttranslational modifications and about 30% of proteins in eukaryotic proteomes can be phosphorylated.Citation12-Citation15 In Arabidopsis thaliana, the number of coding genes is ~25,000 and the number of Ser/Thr protein kinases is around 1,000.Citation16 Assuming eukaryote-averaged level of phosphorylation, it is expected that ~7,500 A. thaliana proteins are phosphorylated by the 1,000 kinases. In other words, each kinase phosphorylates 7~8 proteins in average. Curiously, a large scale phosphorylation mapping study revealed that among the 1,346 phosphorylatable proteins of Arabidopsis thaliana, more than 10% have “membrane” (either plasma membrane or vacuolar membrane) in annotation of their cellular localization.Citation17 Since phosphorylation is a catalytic process that in principle should follow the classical lock-and-key model, it is a puzzle how one kinase can modify multiple often unrelated proteins.
It has long been recognized that the efficiency of phosphorylation is determined by the primary structure of the target proteins. It was found recently that the structural flexibility is also a key factor that allows one kinase to phosphorylate multiple targets.Citation18,Citation19 Most eukaryotic protein kinases share very similar structural fold,Citation20,Citation21 being often composed of a smaller N-terminal β-structure-enriched lobe and a larger C-terminal α-helix-dominated lobe.Citation22-Citation27 ATP is bound to a loop (P-loop) connecting 2 β-strands in the cleft formed by the N- and C-lobes. Near this ATP-binding P-loop, there is another loop called activation loop through which the kinase activity can be regulated by either being phosphorylated/dephosphorylated or interacting with other regulatory proteins. There is a third loop known as catalytic loop that contains conserved Asp and Asn residues to interact with the substrate and to make the phosphorylation happen. All these loops, being flexible, are critical for the phosphorylation process, since kinases use these flexible regions to interact with their multiple partners.
It was also emphasized that the local disorder in proteins targeted to phosphorylation represents another level of utilization of conformational flexibility in this catalytic process. In fact, phosphorylation relies on the interaction between the kinase and the substrate, and the flexible residues flanking the phosphorylation site (P-site) of the substrate are often involved in the substrate-kinase recognition.Citation22,Citation28-Citation30 Therefore, besides the flexibility of the kinase itself, the structural flexibility of the substrate protein, especially the residues sequentially close to the P-site(s), represents an important prerequisite for phosphorylation to occur.
One should also keep in mind that in many proteomes, the number of protein phosphatases is typically far smaller than the number of protein kinases, e.g., there are ~500 human protein kinases and only ~200 protein phosphatases.Citation31,Citation32 This indicates that in their function, phosphatases also rely on protein flexibility and intrinsic disorder. Therefore, structural flexibility of the kinases and the phosphatases and their substrates represent key factors defining the efficiency of the reversible phosphorylation process.
It has been shown that phosphorylation occurs normally within the intrinsically disordered protein regions (IDPRs).Citation18 The term IDPR refers to a segment of a polypeptide chain that due to weak interaction with other parts of the same protein does not have stable structure under physiological conditions and exist as a dynamic conformational ensemble.Citation33-Citation36 The length of an IDPR may vary from several residues to hundreds and even thousands of residues. Proteins that contain ordered domains and IDPRs are named hybrid proteins.Citation37 For many proteins, known as intrinsically disordered proteins (IDPs), IDPR runs over the entire protein length. Structurally, IDPs and IDPRs may exist in multiple forms, such as extended or compact disordered species that contain smaller or larger amount of flexible secondary structures.Citation38 Although the structural flexibility of the substrates seems to represent an important structural factor defining the efficiency of protein phosphorylation, the peculiarities of the correlation between phosphorylation and the extent of the flexibility has not been completely understood. Besides, it is also not clear whether other structural factors might affect the phosphorylation process.
In our previous study on the structural prerequisites for the efficient methionine oxidation, it was found that the methionine oxidation sites are characterized by some unique features, such as local structural flexibility, high solvent accessibility, and peculiar local secondary structure.Citation39 Therefore, we undertook this study to examine the patterns of structural features defining the efficiency of protein phosphorylation. To this end, we focused on the peculiarities of phosphorylation of trans-membrane proteins from Arabidopsis thaliana. The primary reason for this choice of these proteins is in the fact that the majority of the signaling receptors that detect and respond to various environmental stimuli are membrane proteins located within the cell membrane. Therefore, the analysis of the effects of phosphorylation on structural properties of membrane proteins is extremely important for better understanding the regulating roles of phosphorylation in various signaling pathways.Citation10,Citation40
Results
While the accuracy of predictions of protein secondary structure and relative accessible surface area have been validated by their developersCitation41 and by our previous study,Citation39 the peculiarities of protein intrinsic disorder predictions needs to be further analyzed since two quite different disorder predictors (PONDR-VLXTCitation42 and PONDR-FITCitation43) were applied in this study. PONDR-VLXT is a member of the first generation of disordered predictors. This predictor is extremely sensitive to the peculiarities of the local amino acid compositions, and therefore, it is a very useful tool to measure the local structure flexibility. PONDR-FIT, being a newer computational tool, is one of the more accurate disorder predictors.Citation44,Citation45 It is a meta-predictor that combines the outputs of 6 individual predictors and has high per-residue prediction accuracy. The comparison of PONDR-VLXT and PONDR-FIT scores for all 75 phosphorylated residues in 52 transmembrane proteins is shown in . This analysis revealed that: (1) sites with high PONDR-VLXT disorder scores are very likely to have high PONDR-FIT disorder scores; (2) for structured site, the PONDR-VLXT and PONDR-FIT disorder scores have larger discrepancy; (3) for exposed residues, the PONDR-VLXT disorder score is usually lower than the PONDR-FIT disorder score; (4) for semi-exposed sites, PONDR-FIT scores are often higher than PONDR-VLXT scores.
Figure 1. (A) Comparison of disorder score predicted by PONDR-FIT and PONDR-VLXT. All the phosphorylation sites are organized into 3 different groups: buried (black, RSA ≤ 0.25), semi-exposed (green, 0.25 < RSA ≤ 0.5), and exposed (pink, RSA > 0.5). The solid diagonal line is where the disorder scores from both predictors match exactly to each other. The region between 2 dashed off-diagonal lines indicates confidence region where the disorder scores from 2 predictors are equivalent to each other. (B) Comparison of disorder score between single residue and its extended region. X-axis is the disorder score predicted by PONDR-VLXT. Y-axis is the averaged disorder score for a segment centered at the residue and flanked by 20 amino acids at both sides. Dark crosses (group I) are residues that are consistently predicted by both PONDR-VLXT and PONDR-FIT as shown in (A). Blue circles (group II) have larger PONDR-VLXT scores in (A). Red squares (group III) show residues with larger PONDR-FIT scores in (A).
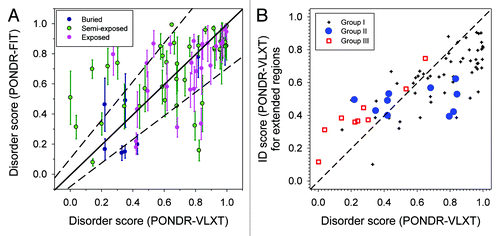
As shown by the confident region between the 2 dashed lines, the predictions of 2 predictors match each other for most of the residues. There are 54 residues within the area limited by these 2 dashed lines, which accounts for 72% of all the phosphorylated residues analyzed in this study. Out of 21 residues (28%) located outside of this area, only 11 (15%) are extreme outliers.
The above described analysis was performed for individual residues with known phosphorylation status. However, in reality, the flexibility of an amino acid is influenced by its neighboring residues. Therefore, at the next step we analyzed the disorder score of a region flanking a sp.ecific residue, and represents results of this analysis. Here, X-axis represents the disorder score predicted by PONDR-VLXT for a phosphorylated residue, whereas Y-axis shows the averaged disorder score for a segment centered at the phosphorylated residue and flanked by 20 amino acids at both sides. This analysis provides description of the local environment of the residue/region of the interest. If a structured target site (i.e., site with the disorder score below 0.5) is flanked by disordered regions, the averaged disorder score of this region will be higher than the score of the target site. In the curve representing the per-residue disorder score distribution, this segment would be manifested as a “dip.” Residues in dips will gain additional local structural flexibility from flanking disordered regions. If a disordered target site (i.e., site with the disorder score above 0.5) is flanked by structure-prone regions, the averaged disorder score of this segment will be smaller than the score of the target site, and this segment would correspond to a “spike” in the curve representing the per-residue disorder score distribution. Residues in such spikes are more flexible than neighboring residues located outside the spikes. suggests that almost all flexible phosphorylatable residues (disorder score > 0.5) have decreased averaged disorder score for the entire region, whereas the majority of structured phosphorylatable residues have increased averaged disorder score over the entire region. Therefore, this analysis suggests that almost all phosphorylatable residues are located either in the dips or the spikes of the corresponding per-residue disorder score curves.
In , we further considered 3 groups of residues based on the result of their disorder status evaluated by PONDR-VLXT and PONDR-FIT (see ). Here, group I includes residues with the disorder status consistently evaluated by both PONDR-VLXT and PONDR-FIT (i.e., residues located within the area separated by two dashed lines in ); group II contained residues that had larger PONDR-VLXT scores (i.e., residues located below the bottom dashed line in ), and group III corresponds to residues with larger PONDR-FIT scores (i.e., residues located above the upper dashed line in ). Since group I represent residues whose disordered status is consistently predicted by both predictors, the subsequent analysis was focused on residues from groups II and III. The PONDR-VLXT scores for residues in group II are larger than their PONDR-FIT scores. Since PONDR-VLXT is more sensitive to the peculiarities of local amino acid compositions, and since PONDR-FIT is more accurate in the general evaluation of disorder status, the higher PONDR-VLXT score for these residues is an indication that the residues are locally flexible. Curiously, half of these residues are located in “dips” and another half is contained in “spikes” of the corresponding per-residue disorder score curves. Residues in the group III that were characterized by higher PONDR-FIT scores also systematically had higher averaged scores of their extended segments. This means that these residues are predominantly located in “dips,” and their flanking regions are more flexible. This is also the reason of why PONDR-FIT scores for them are higher than the corresponding PONDR-VLXT scores.
represents the predicted disorder score and predicted relative surface area (RSA) for all phosphorylatable amino acids categorized by their secondary structures and clearly shows that only a small fraction of phosphorylatable residues are located within α-helices or β-strands, whereas the greatest majority of these residues can be found within the regions with irregular structure (coils). The peculiarities of numerical distributions are further illustrated by , where positioning of all Thr, Ser, and Tyr residues in secondary structure elements of analyzed proteins are compared with localization of phosphorylatable residues. Here, 2276 (35.9%), 521 (8.2%), and 3540 (55.9%) of all the Thr, Ser, and Tyr residues are found in α-helical, β-strand, and coil conformations, respectively. The fractions of phosphorylatable residues within the three different secondary structure elements changed to 7 (9.3%), 2 (2.7%), and 66 (88.0%). By using the Student t-test and assuming the null hypothesis that these 2 distributions are the same, the p-value of this test is 0.067, which does not indicate that the peculiarities of secondary structures have significant influence on the phosphorylation. The total numbers of Thr, Ser, and Tyr in the data set are 1902, 3391, and 1044, respectively. The numbers of phosphorylatable Thr, Ser, and Tyr are 17, 56, and 2, accordingly. Again, applying the Student t-test on the null hypothesis that 2 sets of data have same distribution, the p-value is calculated as 0.045 suggesting that phosphorylation has variable preference for the different types of phosphorylatable amino acid, in the order from Ser, to Thr, to Tyr.
Figure 2. Structural evaluation on phosphorylation sites by both RSA and disorder score. (A) RSA and disorder score for each phosphorylation site. The sites were classified by different secondary structures, which are helix (blue square), β-sheet (green circle), and coil (pink star). It can be seen that: (1) near 90% of phosphorylation sites are located in coil regions (as shown by pink stars); (2) more than 70% of phosphorylation sites are within disordered regions (disorder score > 0.5); (3) in the other 30% of structured phosphorylation sites, about 80% are exposed to solvent (RSA > 0.25); (4) only 5 out of 75 phosphorylation sites are structured and buried; (5) by taking consideration that residues with disorder score less than 0.5 but bigger than 0.3 are in twilight zone,Citation39,Citation61 only one out of 75 phosphorylation site is structured and buried. (B) Distribution of phosphorylation sites at different ranges of disorder score. The range of possible disorder score from 0 to 1 was divided into 10 bins with each bin corresponding to a range of 0.1. The bar height on each bin represents fraction of phosphorylation sites whose disorder score are within the bin. The bars are composed of 3 segments indicating buried site (brown), semi-exposed (orange), and exposed (green).
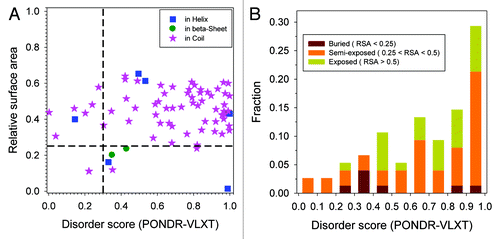
Table 1. Phosphorylatable residues and their predicted secondary structure
shows the correlation between fraction of amino acids with specific values of relative surface area and structural flexibility as indicated by the disordered score for all phosphorylatable amino acids. In this analysis, the RSA was divided into three ranges: < 25%, between 25% and 50%, and > 50%. The correlation coefficients for these 3 groups of residues with their disordered score are 0.02, 0.71, and 0.84, respectively. This demonstrates that when phosphorylatable residues are more exposed, their exposure probability is more positively correlated with their disorder score. This is also an indication that highly flexible residues are more often associated with larger surface exposure. Actually in , the blue circles can be further split into 2 groups since despite the similarity of the overall disorder scores averaged on extended regions the PONDR-VLXT scores of individual phosphorylatable residues clearly form 2 groups. This suggests that some residues in this group are located within “spikes,” whereas other residues are found in “dips” of the corresponding disorder profiles. In both of the cases, the residues can gain additional flexibility from the neighboring regions.
In the real process of phosphorylation, phosphorylatable residue has to be accessible to the catalytic domain of the kinase to form a covalent bond with phosphate. Therefore, it is intuitive to expect that the phosphorylatable residue has to be exposed and flexible. As shown in , in line with our previous study on methionine oxidation,Citation39 residues with RSA above 0.25 are exposed and residues with ID score higher than 0.3 are flexible. By using these 2 thresholds, all the phosphorylatable residues can be divided into 4 groups: (I) exposed and flexible; (II) exposed but not flexible; (III) not exposed but flexible; (IV) not exposed and not flexible. The numbers of residues in each group are shown in .
Table 2. Number of phosphorylatable residues with different combinations of flexibility and relative surface accessibility
The phosphorylation of residues in the group I is easy to understand. These residues are exposed and therefore they can be approached by the catalytic domain of the kinases. Since these residues are also flexible, they can adjust their conformations and/or spatial locations to facilitate the efficient catalytic process.
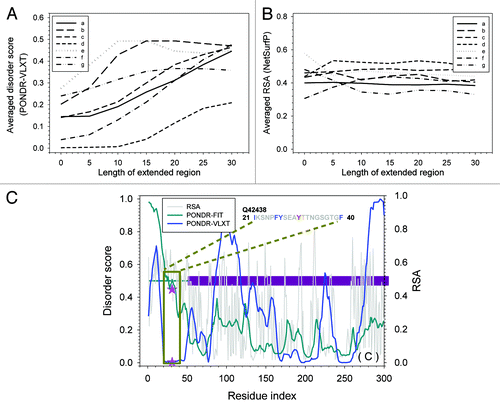
The structural information related to residues in the group II is presented in . As shown by , the averaged disorder score of an extended region centered at the phosphorylation site usually increases very fast when the length of the extended region is increasing. In other words, although these residues have lower disorder score, the entire segments where the phosphorylation sites are located are rather flexible. Meanwhile, as it can be seen from , these residues have large RSA values indicating that they are exposed. Therefore, in terms of the easiness of their phosphorylation, the group II residues are essentially the same as the group I residues. The only noticeable exception from this rule in is Tyr31 in Q42438. Even when the length of region surrounding this residue was increased to 40, the averaged disorder score was still below 0.1 suggesting that this residue is located within a pretty long rigid region. To analyze the reason for this peculiar behavior, represents the detailed structural information of Q42438. Q42438 is a calcium-dependent protein kinase. The total length of this protein is 532 residues, including kinase domain at N-terminal half (the dark-red horizontal bar in the plot), an autoinhibitory domain in the middle, and the four tandem EF-hand motifs at the C-terminal half. The ATP binding site is located right before the kinase domain and after the phosphorylation site. The region flanking the phosphorylatable Tyr31 is actually enriched in charged and polar residues. In PONDR-FIT plot, the entire region before the kinase domain is expected to be highly flexible, as shown in . Besides, this region consistently has larger RSA. Therefore, the phosphorylation of all the group II residues is still under the control of the local structural flexibility and surface exposure.
Figure 3. Structural analysis for residues with low disorder score and high RSA. (A) The averaged disorder score for the segment extended toward both sides on the phosphorylation site. X-axis is the length of the extension and Y-axis is the averaged disorder score calculated from PONDR-VLXT prediction. (B) Averaged RSA for the segment extended from the phosphorylation site. X-axis is the extended length and y-axis is the averaged RSA predicted by NetsurfP. Since the segment is extended on both sides, the total length of the segment with extension N is 2N+1. The curves in both (AandB) stand for: (a) F4KD71-T556; (b) Q9FLV9-S601; (c) Q9SB58-S343; (d) Q42438-Y31; (e) Q8RYE2-S69; (f) Q9LH89-S167; and (g) Q38890-T20. (C) Structural information, disorder prediction, and RSA prediction for Q42438 (AT5G19450). Only N-terminal half is presented in the plot. Blue curve is disorder prediction from PONDR-VLXT. Dark cyan curve is the disorder prediction by PONDR-FIT. Gray curve is the RSA prediction from NetSurfP. Dark red horizontal bar at y~0.5 is the kinase domain. Pink stars are phosphorylated tyrosine (Y31) labeled on PONDR-VLXT and RSA prediction, respectively. The dark green box shows the flanking region and amino acid sequence of Y31.
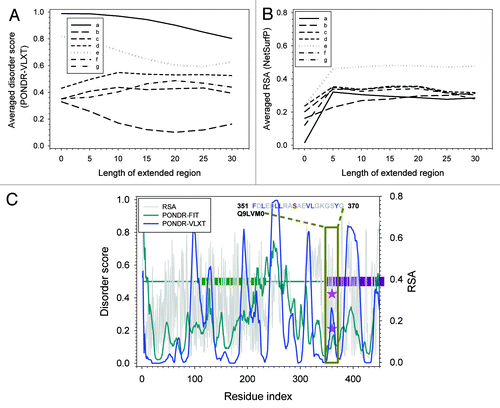
The residues in group III are also similar to the group I and II residues. In fact, shows that all the group III residues have larger disorder score by themselves. All regions (except 1) surrounding these phosphorylatable residues have large disorder scores. The exception is Ser360 of Q9LVM0. For RSA, although the values calculated for phosphorylatable residues by themselves are all small, the averaged RSA for the regions surrounding these residues increases very fast. The only exception is still Ser360 of Q9LVM0. Therefore, vast majority of the group III residues still follow the phosphorylation mechanisms that rely on both structural flexibility and surface exposure. Ser360 of Q9LVM0 is different from other residues in this group. Therefore, the details of the disorder and RSA prediction were further analyzed as shown in . Q9LVM0 is a putative receptor kinase. It has about 654 residues and is composed of the N-terminally located signal peptide of 40 residues, followed by the 5 leucine-rich repeats (LRRs), ATP binding site, and finally by the kinase domain at the C-terminal half of protein. Ser360 is located at the beginning of the kinase domain, right before the ATP binding site that is assumed to be located in the region between residues 360 and 380. In terms of the sequence, we can see that the N-terminal flanking region of Ser360 is composed of leucine and charged residues (D, E, and R). This combination may force serine to be more exposed than predicted. In the disorder curve of this region, we can also see that serine is located within a “spike” of the disorder curve. This suggests that this serine can serve as a local “hot spot,” whose actual flexibility could be larger than that evaluated based on the predicted disorder score. Therefore, the factors determining the phosphorylation mechanism of Ser360 of Q9LVM0 can also be attributed to local structural flexibility and surface exposure.
Figure 4. Structural analysis for residues with high disorder score and low RSA. (Aand B) are averaged disorder score and RSA for the segments centered at the phosphorylation site. The extended length of the segment on one side is shown on x-axis. Y-axis is the averaged disordered score predicted by PONDR-VLXT in (A), and averaged RSA predicted by NetsurfP in (B). Curves are plotted for: (a) Q93YR3-S63; (b) Q9LVM0-S360; (c) Q940Y5-S183; (d) Q8RWZ6-S183; (e) Q9ZUU9-S48; and (f) Q9SCT4-T758. (C) Disorder and RSA prediction for N-terminal half of Q9LVM0 (AT5G58300). Dark green horizontal bars in the middle are Leucine Rich Repeats. Dark red horizontal bar in the middle is the kinase domain. Blue curve is the PONDR-VLXT prediction. Dark cyan curve is the PONDR-FIT prediction. Gray curve is RSA prediction. Pink stars are phosphorylated serine (S360) on the curves of disorder score and RSA. Dark green box shows the neighboring regions and the corresponding amino acid sequence.
Group IV has only 2 residues, which are Thr580 of Q9LVM0 and Thr567 of Q9FHK7. Q9LVM0 is a putative receptor kinase containing five LRRs, and Q9FHK7 is another LRR receptor-like protein kinase. These 2 sequences are highly similar to each other with the sequence identity of ~50% (see Fig. S1). The flanking regions of the phosphorylatable threonines in these two proteins are almost identical (also see Fig. S1). Therefore, the phosphorylation of these 2 residues should be determined by similar mechanisms. To investigate the factors influencing the phosphorylation, the disorder and RSA scores of Q9LVM0 are plotted in . From the disorder profile (which is shown by blue curve in ), it is clear that although protein has low disorder score in the vicinity of the phosphorylatable Thr580, the entire C-terminal region is very flexible starting at residue 560 as evidenced by the extremely high fraction of residues (~80%) that have disorder score higher than 0.5. However, the sequence of the region directly flanking the phosphorylation site is enriched in aliphatic, aromatic, and charged residues. Therefore although this region is predicted to have lower disorder score, it can still be globally flexible.
Figure 5. (A) Disorder and RSA prediction for the C-terminal half of Q9LVM0 (AT5G58300), a putative receptor kinase. Dark red bar in the central region is the kinase domain. Blue curve is the disorder prediction from PONDR-VLXT. Gray curve is the RSA prediction by NetSurfP. Pink stars are phosphorylated threonine (T580). (B) is the Wenxiang diagram for the helix-prone region within the segment shown in (A). The helical region is predicted by NetSurfP. The segment starts from the outside and ends at the inside. Aromatic and aliphatic residues are colored red, and the other residues are in blue.
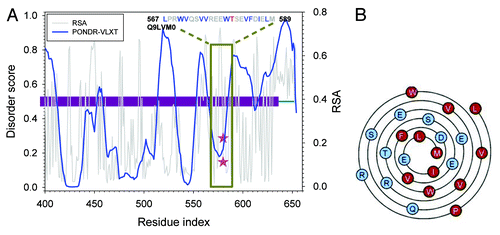
Since this region is also predicted to be an α-helix by NetSurfP, we can imitate the spatial locations of the amino acids by using the so-called Wenxiang diagram which helps intuitively analysis on the disposition of amphipathic α-helices in heteropolar environmentsCitation46,Citation47 (see ). From this diagram it is clear that the hydrophobic and charged residues are spatially localized at different sides of an α-helix. Besides, even though being predicted to be buried, the phosphorylatable Thr is located on the surface of this amphipathic α-helix. Therefore, the side-chain of Thr can be much more flexible and exposed than the neighboring backbone atoms. The same situation can also be observed for Thr567 of Q9FHK7 (see Fig. S2).
Discussion
Analyzing the structural properties of the kinases and the phosphorylation sites of target proteins is important since the efficient phosphorylation requires a conformational match originated from the coordinated movement of both the kinase active site residues and the substrate. The structural flexibility of kinases has been well recognized. In this study, we summarized the structural properties of the region flanking phosphorylation site of the specific substrates, namely trans-membrane proteins from Arabidopsis thaliana. The reasons the only A. thaliana trans-membrane proteins were chosen for the analysis reported in this manuscript are: (1) A. thaliana is a model plant that has been studied extensively and is still attracting a lot of attention, which makes the future experimental validation much easier; (2) the phosphorylation data of this set of proteins seem to be more reliable since the data have been cross-validated by different groups as stated in the database; (3) the trans-membrane proteins in A. thaliana play important signaling roles in detecting environmental stimuli; (4) our previous studies on trans-membrane proteins indicates that trans-membrane proteins have some unique features in term of protein intrinsic disorder; (5) large scale data set may contain large-scale errors that make the analysis more difficult.
Our analysis revealed that both the structural flexibility and surface exposure of local region in the close vicinity of the phosphorylation sites are critical contributors to the productive phosphorylation process. This observation is complementary to the traditionally accepted dependence of the phosphorylation efficiency on the protein primary structure. However, beyond their amino acid sequences (or primary structures), proteins are characterized by various “higher order” structural properties, such as secondary structure, accessible surface area, (structural) intrinsic disorder, and 3D structure. This study focused more on those “higher order” structural properties, than on the traditionally analyzed sequence information. The analysis clearly showed that the broader structural viewpoint provides additional rationale for the molecular mechanisms of protein phosphorylation.
Although new phenomena are discovered in this study, the limited number of reliable phosphorylatable residues in our data set limited the depth of the residue-specific analyses. As shown in , there are only 17 and 2 phosphorylatable Thr and Tyr residues in proteins we analyzed. Therefore, subsequent studies are needed for gaining more information on the structural prerequisites for phosphorylation of sp.ecific amino acids. However, it should be noted that the phosphorylated tyrosine constitutes only several percent of phosphorylatable residues across the eukaryote proteomes.Citation19,Citation40,Citation48,Citation49 By taking into consideration that only about 10% of the phosphorylated proteins in A. thaliana are trans-membrane proteins, the actual number of phosphorylated tyrosine residues cannot be expected to be high.Citation19
It is easy to imagine that the actual phosphorylation event can represent a very complicated process. For example, based on an intuitive analysis of the PONDR-VLXT and RSA profiles (see ), Tyr31 of Q42438 seems to be a difficult phosphorylation target, since this residue is located within a region predicted to be structured. However, according to the PONDR-FIT analysis (), this region is apparently more flexible than one could expect from the inspection of the PONDR-VLXT profile. Intriguingly, recent studies revealed that the close neighbor of Tyr31, the Q42438 Ser36, is a phosphorylatable residue.Citation50,Citation51 This observation provides a possible explanation for the Tyr31 phosphorylation mechanism. According to our analysis, Ser36 is as rigid as Tyr31, but has larger RSA. Therefore, it is very likely that Ser36, being more solvent exposed than Tyr31, can be phosphorylated first. Following this phosphorylation event, the local polarity of the region will be significantly changed. Since there are only 5 residues between Tyr31 and Ser36, the local environment of Tyr31 may also be changed simplifying the subsequent phosphorylation of this tyrosine residue.
Similar situation might exist in F4KD71 as well. In the database, Thr556 is the only phosphorylatable site in the protein. However, Tyr566 and Ser568 were also reported to be phosphorylated.Citation52 These 3 residues are close to each other on the sequence and phosphorylation of one of them can synergistically affect accessibility of two other residues.
In addition to the influence of the sequentially neighboring residues, the effects of the residues that are not sequential neighbors but are spatial neighbors are of a special interest. For example, Q9LVM0 has two phosphorylation sites: Ser360 and Thr580. Ser360 is located at the beginning of the kinase domain, whereas Thr580 is positioned at the end of the kinase domain. Although these two sites are sequentially remote, the actual spatial distance between them is not determined since structure of Q9LVM0 is not known. However, the kinase domain of Q9LVM0 is similar (with the sequence identity of ~30%) to several other proteins whose 3D structures have been resolved. In these structures, the N- and C-termini are positioned far away from each other. Therefore, it is unlikely that the phosphorylation of S360 and T580 of Q9LVM0 may influence each other.
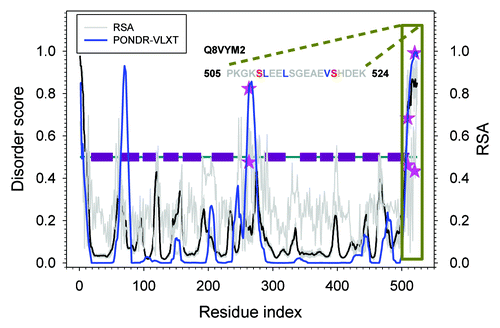
Another example is found in an inorganic phosphate transporter Q8VYM2 as shown in . Q8VYM2. This protein has 12 trans-membrane helices. Both the N- and C-termini of Q8VYM2 are located inside the cell. This protein has 3 phosphorylation sites: Thr263, Ser509, and Ser520, all located in its cytoplasmic regions. Since Ser509 and Ser520 are not far away from each other, one might expect the existence of synergetic effect of phosphorylation of 1 residue on the phosphorylation efficiency of another. In our previous study on methionine oxidation, we proposed that neighboring methionines can be oxidized sequentially in a specific order.Citation39 The same phenomenon was also described for protein carbonylation.Citation53 Therefore, the question is whether the phosphorylation of these neighboring Ser509 and Ser520 residues has specific order. The importance of this question is determined by the fact that the functionality of this phosphate transporter can be controlled by various phosphorylation processes. The related question is whether phosphorylation of Thr263 might influence the phosphorylation of S509 and/or S520 and vice versa. Since these 3 residues are cytoplasmic, their actual spatial distances could be very small. If this hypothesis is correct, then they will be able to affect each other. However, similar to other cases considered above, the available experimental are rather limited. Therefore, further studies are needed to better understand the phosphorylation mechanisms of this interesting protein.
Figure 6. Disorder and RSA prediction for Q8VYM2 (AT5G43350). The dark red horizontal bars in the middle are trans-membrane motifs. Blue curve is disorder prediction by PONDR-VLXT. Gray curve is RSA prediction by NetSurfP. Pink stars are phosphorylated residues (T263, S509, and S520) labeled on both disorder and RSA prediction.
The explanation for the above 2 different scenarios of phosphorylation is actually supported by the observation that many proteins undergo sequential or hierarchical phosphorylation phosphorylation.Citation54-Citation57 The sequential phosphorylation is originally proposed to explain the phosphorylation of an unsuitable site, which can be affected by the phosphorylation of another sequentially-remote site by a different kinase. Here, in our analysis, we further elaborated the process into 2 specific cases: influence by sequentially neighboring residues and influence by spatially neighboring residues.
Materials and Methods
Data set
The information on phosphorylatable sites in transmembrane proteins of Arabidopsis thaliana were collected from PhosPhAT database.Citation58 This database contains information on Arabidopsis phosphorylation sites identified by mass-spectrometry experiments performed by different research groups. Only trans-membrane proteins were selected for our further analysis. After removing redundant and low-confidence records, 52 proteins and 75 phosphorylation sites were selected. None of these 52 proteins have PDB structures.
Disorder prediction
The per-residue disorder scores were evaluated by PONDR-VLXTCitation42 and PONDR-FIT.Citation43 PONDR-VLXT is very sensitive to the changes on local amino acid composition, and PONDR-FIT is one of the most accurate disorder predictors.
Secondary structure (SS) and accessible surface area (ASA) predictions
NetSurfPCitation41 was applied to predict both secondary structures and accessible surface areas of proteins under study. For each residue in the analyzed protein, the output of secondary structure prediction from NetSurfP has three values, indicating the probabilities of formation of α-helix, β-sheet, and coil. Therefore, secondary structure type with the highest probability was assigned to the corresponding residues. The accessible surface area was predicted in 2 forms: the Relative Surface Accessibility (RSA) and Absolute Surface Accessibility (ASA). ASA is the real value, while RSA is defined as the ratio of actual ASA of a given residue in a specific 3D structure to the maximum possible ASAmax of the same type of amino acid calculated from a tri-peptide of this amino acid flanked by either glycine or alanine.Citation59,Citation60
Additional material
Download Zip (255.5 KB)Disclosure of Potential Conflicts of Interest
No potential conflicts of interest were disclosed.
Supplemental Material
Supplemental material may be found here: http://www.landesbioscience.com/journals/idp/article/25713
References
- Parkinson JS, Kofoid EC. Communication modules in bacterial signaling proteins. Annu Rev Genet 1992; 26:71 - 112; http://dx.doi.org/10.1146/annurev.ge.26.120192.000443; PMID: 1482126
- Wolanin PM, Thomason PA, Stock JB. Histidine protein kinases: key signal transducers outside the animal kingdom. Genome Biol 2002; 3:S3013; http://dx.doi.org/10.1186/gb-2002-3-10-reviews3013; PMID: 12372152
- Besant PG, Attwood PV, Piggott MJ. Focus on phosphoarginine and phospholysine. Curr Protein Pept Sci 2009; 10:536 - 50; http://dx.doi.org/10.2174/138920309789630598; PMID: 19751195
- Ashcroft M, Kubbutat MH, Vousden KH. Regulation of p53 function and stability by phosphorylation. Mol Cell Biol 1999; 19:1751 - 8; PMID: 10022862
- Burnett G, Kennedy EP. The enzymatic phosphorylation of proteins. J Biol Chem 1954; 211:969 - 80; PMID: 13221602
- Cozzone AJ. Protein phosphorylation in prokaryotes. Annu Rev Microbiol 1988; 42:97 - 125; http://dx.doi.org/10.1146/annurev.mi.42.100188.000525; PMID: 2849375
- Bourret RB, Borkovich KA, Simon MI. Signal transduction pathways involving protein phosphorylation in prokaryotes. Annu Rev Biochem 1991; 60:401 - 41; http://dx.doi.org/10.1146/annurev.bi.60.070191.002153; PMID: 1883200
- Zhang ZY. Structure, mechanism, and specificity of protein-tyrosine phosphatases. Curr Top Cell Regul 1997; 35:21 - 68; http://dx.doi.org/10.1016/S0070-2137(97)80002-7; PMID: 9192175
- Barford D, Das AK, Egloff MP. The structure and mechanism of protein phosphatases: insights into catalysis and regulation. Annu Rev Biophys Biomol Struct 1998; 27:133 - 64; http://dx.doi.org/10.1146/annurev.biophys.27.1.133; PMID: 9646865
- Fiedler D, Braberg H, Mehta M, Chechik G, Cagney G, Mukherjee P, Silva AC, Shales M, Collins SR, van Wageningen S, et al. Functional organization of the S. cerevisiae phosphorylation network. Cell 2009; 136:952 - 63; http://dx.doi.org/10.1016/j.cell.2008.12.039; PMID: 19269370
- Huse M, Kuriyan J. The conformational plasticity of protein kinases. Cell 2002; 109:275 - 82; http://dx.doi.org/10.1016/S0092-8674(02)00741-9; PMID: 12015977
- Cohen P. The role of protein phosphorylation in human health and disease - Delivered on June 30th 2001 at the FEBS Meeting in Lisbon. Eur J Biochem 2001; 268:5001 - 10; http://dx.doi.org/10.1046/j.0014-2956.2001.02473.x; PMID: 11589691
- Manning G, Plowman GD, Hunter T, Sudarsanam S. Evolution of protein kinase signaling from yeast to man. Trends Biochem Sci 2002; 27:514 - 20; http://dx.doi.org/10.1016/S0968-0004(02)02179-5; PMID: 12368087
- Ficarro SB, McCleland ML, Stukenberg PT, Burke DJ, Ross MM, Shabanowitz J, Hunt DF, White FM. Phosphoproteome analysis by mass spectrometry and its application to Saccharomyces cerevisiae. Nat Biotechnol 2002; 20:301 - 5; http://dx.doi.org/10.1038/nbt0302-301; PMID: 11875433
- Ptacek J, Devgan G, Michaud G, Zhu H, Zhu XW, Fasolo J, Guo H, Jona G, Breitkreutz A, Sopko R, et al. Global analysis of protein phosphorylation in yeast. Nature 2005; 438:679 - 84; http://dx.doi.org/10.1038/nature04187; PMID: 16319894
- Arabidopsis Genome Initiative. Analysis of the genome sequence of the flowering plant Arabidopsis thaliana. Nature 2000; 408:796 - 815; http://dx.doi.org/10.1038/35048692; PMID: 11130711
- Sugiyama N, Nakagami H, Mochida K, Daudi A, Tomita M, Shirasu K, Ishihama Y. Large-scale phosphorylation mapping reveals the extent of tyrosine phosphorylation in Arabidopsis. Mol Syst Biol 2008; 4:193; http://dx.doi.org/10.1038/msb.2008.32; PMID: 18463617
- Iakoucheva LM, Radivojac P, Brown CJ, O’Connor TR, Sikes JG, Obradovic Z, Dunker AK. The importance of intrinsic disorder for protein phosphorylation. Nucleic Acids Res 2004; 32:1037 - 49; http://dx.doi.org/10.1093/nar/gkh253; PMID: 14960716
- Nishi H, Fong JH, Chang C, Teichmann SA, Panchenko AR. Regulation of protein-protein binding by coupling between phosphorylation and intrinsic disorder: analysis of human protein complexes. Mol Biosyst 2013; 9:1620 - 6; http://dx.doi.org/10.1039/c3mb25514j; PMID: 23364837
- Hanks SK, Quinn AM, Hunter T. The protein kinase family: conserved features and deduced phylogeny of the catalytic domains. Science 1988; 241:42 - 52; http://dx.doi.org/10.1126/science.3291115; PMID: 3291115
- Hanks SK, Hunter T. Protein kinases 6. The eukaryotic protein kinase superfamily: kinase (catalytic) domain structure and classification. FASEB J 1995; 9:576 - 96; PMID: 7768349
- Knighton DR, Zheng JH, Ten Eyck LF, Ashford VA, Xuong NH, Taylor SS, Sowadski JM. Crystal structure of the catalytic subunit of cyclic adenosine monophosphate-dependent protein kinase. Science 1991; 253:407 - 14; http://dx.doi.org/10.1126/science.1862342; PMID: 1862342
- Bossemeyer D, Engh RA, Kinzel V, Ponstingl H, Huber R. Phosphotransferase and substrate binding mechanism of the cAMP-dependent protein kinase catalytic subunit from porcine heart as deduced from the 2.0 A structure of the complex with Mn2+ adenylyl imidodiphosphate and inhibitor peptide PKI(5-24). EMBO J 1993; 12:849 - 59; PMID: 8384554
- De Bondt HL, Rosenblatt J, Jancarik J, Jones HD, Morgan DO, Kim SH. Crystal structure of cyclin-dependent kinase 2. Nature 1993; 363:595 - 602; http://dx.doi.org/10.1038/363595a0; PMID: 8510751
- Zhang F, Strand A, Robbins D, Cobb MH, Goldsmith EJ. Atomic structure of the MAP kinase ERK2 at 2.3 A resolution. Nature 1994; 367:704 - 11; http://dx.doi.org/10.1038/367704a0; PMID: 8107865
- Jeffrey PD, Russo AA, Polyak K, Gibbs E, Hurwitz J, Massagué J, Pavletich NP. Mechanism of CDK activation revealed by the structure of a cyclinA-CDK2 complex. Nature 1995; 376:313 - 20; http://dx.doi.org/10.1038/376313a0; PMID: 7630397
- Xu W, Harrison SC, Eck MJ. Three-dimensional structure of the tyrosine kinase c-Src. Nature 1997; 385:595 - 602; http://dx.doi.org/10.1038/385595a0; PMID: 9024657
- Ubersax JA, Ferrell JE Jr.. Mechanisms of specificity in protein phosphorylation. Nat Rev Mol Cell Biol 2007; 8:530 - 41; http://dx.doi.org/10.1038/nrm2203; PMID: 17585314
- Kemp BE, Bylund DB, Huang TS, Krebs EG. Substrate specificity of the cyclic AMP-dependent protein kinase. Proc Natl Acad Sci U S A 1975; 72:3448 - 52; http://dx.doi.org/10.1073/pnas.72.9.3448; PMID: 1059131
- Pearson RB, Kemp BE. Protein kinase phosphorylation site sequences and consensus specificity motifs: tabulations. Methods Enzymol 1991; 200:62 - 81; http://dx.doi.org/10.1016/0076-6879(91)00127-I; PMID: 1956339
- Alonso A, Sasin J, Bottini N, Friedberg I, Friedberg I, Osterman A, Godzik A, Hunter T, Dixon J, Mustelin T. Protein tyrosine phosphatases in the human genome. Cell 2004; 117:699 - 711; http://dx.doi.org/10.1016/j.cell.2004.05.018; PMID: 15186772
- Moorhead GB, Trinkle-Mulcahy L, Ulke-Lemée A. Emerging roles of nuclear protein phosphatases. Nat Rev Mol Cell Biol 2007; 8:234 - 44; http://dx.doi.org/10.1038/nrm2126; PMID: 17318227
- Romero P, Obradovic Z, Kissinger CR, Villafranca JE, Garner E, Guilliot S, Dunker AK. Thousands of proteins likely to have long disordered regions. Pac Symp Biocomput 1998; •••:437 - 48; PMID: 9697202
- Wright PE, Dyson HJ. Intrinsically unstructured proteins: re-assessing the protein structure-function paradigm. J Mol Biol 1999; 293:321 - 31; http://dx.doi.org/10.1006/jmbi.1999.3110; PMID: 10550212
- Uversky VN, Gillespie JR, Fink AL. Why are “natively unfolded” proteins unstructured under physiologic conditions?. Proteins 2000; 41:415 - 27; http://dx.doi.org/10.1002/1097-0134(20001115)41:3<415::AID-PROT130>3.0.CO;2-7; PMID: 11025552
- Tompa P. Intrinsically unstructured proteins. Trends Biochem Sci 2002; 27:527 - 33; http://dx.doi.org/10.1016/S0968-0004(02)02169-2; PMID: 12368089
- Dunker AK, Babu MM, Barbar E, Blackledge M, Bondos SE, Dosztányi Z, Dyson HJ, Forman-Kay J, Fuxreiter M, Gsponer J, et al. What’s in a name? Why these proteins are intrinsically disordered. Intrinsically Disord Proteins 2013; 1:e24157
- Uversky VN, Oldfield CJ, Dunker AK. Showing your ID: intrinsic disorder as an ID for recognition, regulation and cell signaling. J Mol Recognit 2005; 18:343 - 84; http://dx.doi.org/10.1002/jmr.747; PMID: 16094605
- Xu KR, Uversky VN, Xue B. Local flexibility facilitates oxidization of buried methionine residues. Protein Pept Lett 2012; 19:688 - 97; http://dx.doi.org/10.2174/092986612800494084; PMID: 22519542
- Olsen JV, Blagoev B, Gnad F, Macek B, Kumar C, Mortensen P, Mann M. Global, in vivo, and site-specific phosphorylation dynamics in signaling networks. Cell 2006; 127:635 - 48; http://dx.doi.org/10.1016/j.cell.2006.09.026; PMID: 17081983
- Petersen B, Petersen TN, Andersen P, Nielsen M, Lundegaard C. A generic method for assignment of reliability scores applied to solvent accessibility predictions. BMC Struct Biol 2009; 9:51; http://dx.doi.org/10.1186/1472-6807-9-51; PMID: 19646261
- Romero P, Obradovic Z, Li X, Garner EC, Brown CJ, Dunker AK. Sequence complexity of disordered protein. Proteins 2001; 42:38 - 48; http://dx.doi.org/10.1002/1097-0134(20010101)42:1<38::AID-PROT50>3.0.CO;2-3; PMID: 11093259
- Xue B, Dunbrack RL, Williams RW, Dunker AK, Uversky VN. PONDR-FIT: a meta-predictor of intrinsically disordered amino acids. Biochim Biophys Acta 2010; 1804:996 - 1010; http://dx.doi.org/10.1016/j.bbapap.2010.01.011; PMID: 20100603
- Mizianty MJ, Zhang T, Xue B, Zhou YQ, Dunker AK, Uversky VN, Kurgan L. In-silico prediction of disorder content using hybrid sequence representation. BMC Bioinformatics 2011; •••:12; PMID: 21219653
- Walsh I, Martin AJ, Di Domenico T, Tosatto SC. ESpritz: accurate and fast prediction of protein disorder. Bioinformatics 2012; 28:503 - 9; http://dx.doi.org/10.1093/bioinformatics/btr682; PMID: 22190692
- Chou KC, Zhang CT, Maggiora GM. Disposition of amphiphilic helices in heteropolar environments. Proteins 1997; 28:99 - 108; http://dx.doi.org/10.1002/(SICI)1097-0134(199705)28:1<99::AID-PROT10>3.0.CO;2-C; PMID: 9144795
- Zhou GP. The disposition of the LZCC protein residues in wenxiang diagram provides new insights into the protein-protein interaction mechanism. J Theor Biol 2011; 284:142 - 8; http://dx.doi.org/10.1016/j.jtbi.2011.06.006; PMID: 21718705
- Molina H, Horn DM, Tang N, Mathivanan S, Pandey A. Global proteomic profiling of phosphopeptides using electron transfer dissociation tandem mass spectrometry. Proc Natl Acad Sci U S A 2007; 104:2199 - 204; http://dx.doi.org/10.1073/pnas.0611217104; PMID: 17287340
- Sugiyama N, Masuda T, Shinoda K, Nakamura A, Tomita M, Ishihama Y. Phosphopeptide enrichment by aliphatic hydroxy acid-modified metal oxide chromatography for nano-LC-MS/MS in proteomics applications. Mol Cell Proteomics 2007; 6:1103 - 9; http://dx.doi.org/10.1074/mcp.T600060-MCP200; PMID: 17322306
- Nühse TS, Stensballe A, Jensen ON, Peck SC. Large-scale analysis of in vivo phosphorylated membrane proteins by immobilized metal ion affinity chromatography and mass spectrometry. Mol Cell Proteomics 2003; 2:1234 - 43; http://dx.doi.org/10.1074/mcp.T300006-MCP200; PMID: 14506206
- Jones AM, MacLean D, Studholme DJ, Serna-Sanz A, Andreasson E, Rathjen JP, Peck SC. Phosphoproteomic analysis of nuclei-enriched fractions from Arabidopsis thaliana. J Proteomics 2009; 72:439 - 51; http://dx.doi.org/10.1016/j.jprot.2009.02.004; PMID: 19245862
- Hem S, Rofidal V, Sommerer N, Rossignol M. Novel subsets of the Arabidopsis plasmalemma phosphoproteome identify phosphorylation sites in secondary active transporters. Biochem Biophys Res Commun 2007; 363:375 - 80; http://dx.doi.org/10.1016/j.bbrc.2007.08.177; PMID: 17869214
- Maisonneuve E, Ducret A, Khoueiry P, Lignon S, Longhi S, Talla E, Dukan S. Rules governing selective protein carbonylation. PLoS One 2009; 4:e7269; http://dx.doi.org/10.1371/journal.pone.0007269; PMID: 19802390
- Gurley LR, Walters RA, Tobey RA. Sequential phsophorylation of histone subfractions in the Chinese hamster cell cycle. J Biol Chem 1975; 250:3936 - 44; PMID: 1168641
- Yoshioka K. Scaffold proteins in mammalian MAP kinase cascades. J Biochem 2004; 135:657 - 61; http://dx.doi.org/10.1093/jb/mvh079; PMID: 15213240
- Keshet Y, Seger R. The MAP kinase signaling cascades: a system of hundreds of components regulates a diverse array of physiological functions. Methods Mol Biol 2010; 661:3 - 38; http://dx.doi.org/10.1007/978-1-60761-795-2_1; PMID: 20811974
- Diernfellner AC, Schafmeier T. Phosphorylations: Making the Neurosporacrassa circadian clock tick. FEBS Lett 2011; 585:1461 - 6; http://dx.doi.org/10.1016/j.febslet.2011.03.049; PMID: 21453704
- Zulawski M, Braginets R, Schulze WX. PhosPhAt goes kinases--searchable protein kinase target information in the plant phosphorylation site database PhosPhAt. Nucleic Acids Res 2013; 41:Database issue D1176 - 84; http://dx.doi.org/10.1093/nar/gks1081; PMID: 23172287
- Chothia C. The nature of the accessible and buried surfaces in proteins. J Mol Biol 1976; 105:1 - 12; http://dx.doi.org/10.1016/0022-2836(76)90191-1; PMID: 994183
- Ahmad S, Gromiha MM, Sarai A. Real value prediction of solvent accessibility from amino acid sequence. Proteins 2003; 50:629 - 35; http://dx.doi.org/10.1002/prot.10328; PMID: 12577269
- Szilágyi A, Györffy D, Závodszky P. The twilight zone between protein order and disorder. Biophys J 2008; 95:1612 - 26; http://dx.doi.org/10.1529/biophysj.108.131151; PMID: 18441033