 ?Mathematical formulae have been encoded as MathML and are displayed in this HTML version using MathJax in order to improve their display. Uncheck the box to turn MathJax off. This feature requires Javascript. Click on a formula to zoom.
Abstract
Comparability studies lie at the heart of assessments that evaluate differences amongst manufacturing processes and stability studies of protein therapeutics. Low resolution chromatographic and electrophoretic methods facilitate quantitation, but do not always yield detailed insight into the effect of the manufacturing change or environmental stress. Conversely, mass spectrometry (MS) can provide high resolution information on the molecule, but conventional methods are not very quantitative. This gap can be reconciled by use of a stable isotope-tagged reference standard (SITRS), a version of the analyte protein that is uniformly labeled 13C6-arginine and 13C6-lysine. The SITRS serves as an internal control that is trypsin-digested and analyzed by liquid chromatography (LC)-MS with the analyte sample. The ratio of the ion intensities of each unlabeled and labeled peptide pair is then compared to that of other sample(s). A comparison of these ratios provides a readily accessible way to spot even minute differences among samples. In a study of a monoclonal antibody (mAb) spiked with varying amounts of the same antibody bearing point mutations, peptides containing the mutations were readily identified and quantified at concentrations as low as 2% relative to unmodified peptides. The method is robust, reproducible and produced a linear response for every peptide that was monitored. The method was also successfully used to distinguish between two batches of a mAb that were produced in two different cell lines while two batches produced from the same cell line were found to be highly comparable. Finally, the use of the SITRS method in the comparison of two stressed mAb samples enabled the identification of sites susceptible to deamidation and oxidation, as well as their quantitation. The experimental results indicate that use of a SITRS in a peptide mapping experiment with MS detection enables sensitive and quantitative comparability studies of proteins at high resolution.
Introduction
Substantial effort in the biotechnology industry is expended in the assessment of comparability between two or more samples. Such studies are primarily necessitated by changes in the manufacturing processes of a biotherapeutic, as well as the need to determine the effects of various environmental stresses in stability studies.Citation1 Furthermore, comparability studies are a necessary part of establishing the similarity of a biosimilar product with its innovator molecule.Citation2 Since no single method can fully establish the comparability between two products, a host of analytical tools are employed in the assessment process. For example, the comparability of batches of monoclonal antibodies (mAbs) are typically assessed in part by methods that measure levels of aggregates and fragmented protein, e.g., size exclusion chromatography, capillary electrophoresis, analytical ultracentrifugation. The charge heterogeneity of the antibody is an additional attribute that is determined in comparability studies by ion exchange chromatography or isoelectric focusing. While these methods can provide quantitative information in terms of the relative amounts of a given attribute, such as fragments or acidic species, they yield little insight into the molecular details that give rise to that particular physicochemical characteristic.
Mass spectrometry (MS) has long been the gold standard for high-resolution study of a protein drug at the molecular level. Deamidation, methionine oxidation, glycosylation or other modifications in product-related speciesCitation3–Citation6 are key parameters of product quality that are often identified by MS. Typical MS experiments however, do not provide very acurate quantitative data on the relative amounts of such modifications. While spectral counting and other label-free methods may have some utility in providing quantitative data,Citation7,Citation8 stable isotopic labeling strategies, including ICAT, iTRAQ, SILAC, 18O-labeling, AQUA, PSAQ and QconCAT, comprise the core approach to MS-based quantification, although primarily in the field of proteomics.Citation9–Citation18 Proteomics samples are typically highly heterogeneous and are therefore encumbered by difficulties in normalizing and aligning LC-MS data.Citation7 Protein drug samples are, by comparison, highly similar, and would therefore be even more suitable for isotopic labeling approaches to quantitative MS. The specifications for a biologic, however, can be narrow; therefore, a challenge in developing MS-based quantitation tools is the detection of small differences amongst highly similar samples. While chemical labeling methods have been used to distinguish between therapeutic proteins,Citation19–Citation21 variations that typically arise during sample handling (e.g., due to proteolysis), will diminish the accuracy and precision of the method. The use of an internal standard would therefore be highly useful.
In this study, we made use of a stable isotope-tagged reference standard (SITRS) to enable the global quantitative comparison of two non-labeled samples. In contrast to most quantitation approaches based on isotopic labeling strategies that end with direct comparison of labeled and non-labeled peptides, the primary feature that distinguishes the SITRS strategy is that the labeled sample is used as a bridge to enable quantitative comparison of two non-labeled samples. The accuracy of SITRS-mediated quantitation was verified by spiking various predetermined quantities of an antibody mutant into an otherwise pure mAb sample. Analysis of two Chinese hamster ovary (CHO)-derived batches of the mAb revealed a high degree of comparability, while the same mAb produced in a human embryonic kidney (HEK) cell line bore obvious differences in levels of N-terminal pyroglutamate residues and glycosylation patterns. Finally, differences in levels of deamidation, methionine oxidation and missed proteolytic cleavage were quantitated and pinpointed to specific sites by use of a SITRS.
Results
Principle of the method.
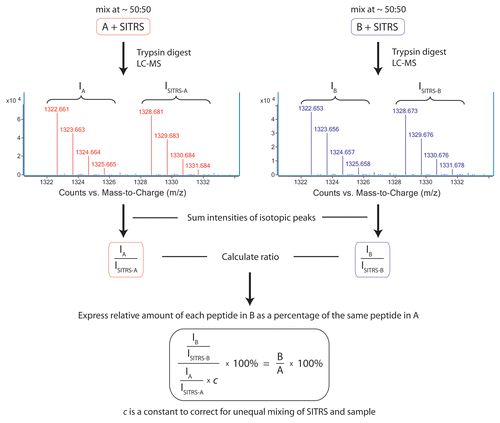
The strategy for use of a SITRS as a bridge to enable the quantitative comparison of two non-labeled samples is outlined in . The SITRS antibody that is uniformly labeled with arginine and lysine residues containing six 13C isotope atoms instead of the naturally abundant 12C isotope in their side chains (Arg-6 and Lys-6) is mixed with the analyte antibody (sample B), as well as an unlabeled reference standard antibody (sample A) prior to tryptic digest and peptide mapping. Under standard RP-HPLC conditions, SITRS peptides have nearly identical retention times and migrate together with their unlabeled counterparts. While not resolvable by chromatography, the labeled and unlabeled peptides are readily distinguished by MS detection, yielding differences in their masses by multiples of 6 Da, depending on the number of arginines and lysines present in that particular peptide. A ratio of the intensities of the m/z peaks for the unlabeled versus the labeled peptides is calculated for every peptide from both the analyte mAb-SITRS sample as well as for the reference mAb-SITRS mix. To quantitate the difference between sample B and sample A, the isotopic ratios were compared and expressed as a percentage according to Equationequation 1(1)
(1) :
(1)
(1)
Here, A and B are the relative amounts of a peptide in sample A and the same peptide in sample B, respectively. IA, IB, ISITRS-A and ISITRS-B are intensities of m/z ion peaks for the same peptide in samples A, B, SITRS mixed with sample A and SITRS mixed with sample B, respectively. Constant c is a normalization factor that accounts for possible unequal addition of SITRS to sample A versus sample B. Specifically, c is a trimmed mean of B/A values that exclude outliers outside of the 95% confidence interval of B/A values for a set of peptides that typically do not undergo post-translational modifications. Thus, multiplication of IA/ISITRS-A by c produces a result equal to the ratio of IB/ISITRS-B for the majority of the peptides quantitated.
To increase the sensitivity of this method, several experimental parameters were optimized. The extent of trypsin digestion was optimized to produce a set of peptides covering the entire protein sequence and at the same time providing the greatest consistency during quantitation. Great care was used to select the appropriate m/z ion peaks for monitoring. Most of the tryptic peptides produced several charged species in the mass spectrum. The ions whose m/z peaks produced the most consistent results during quantitation were chosen for monitoring. The m/z ion peaks that were poorly resolved from other peaks, or those that produced a very low signal or intensity outside of the linear range of the MS detector, were purposely excluded from quantitation. In addition, several m/z isotopic peaks were summed up for each peptide ion prior to calculating the ratio.
In addition to using the SITRS for quantitative purposes, the mass spectral pattern of sample/SITRS mixture simplifies identification of species that are unique to either the sample or its SITRS. In general, the mass spectra of peptides common to both the sample and the SITRS are typified by m/z ion peaks that appear as doublets. Peptides that are unique to the sample or SITRS because they bear some modification or mutation would appear as a singlet (). The only exception to this rule is if there are peptides that do not contain a single lysine or arginine. Such peptides may result from fragmentation, non-specific digestion by trypsin or they may simply be C-terminal peptides that do not include a C-terminal lysine residue.
Method linearity.
The SITRS method was designed to identify very small differences among samples at the peptide level. It was therefore imperative to demonstrate that the method will produce a linear response that is proportional to the amount of modification occurring in any monitored peptide for a given sample. Linearity was demonstrated by mixing various amounts of sample with SITRS and then plotting the experimentally-obtained ratios of m/z peak intensities (I/ISITRS) for each peptide against the theoretical, expected values (Sup. Table 1 and Sup. Fig. 1). Nearly all monitored peptides produced I/ISITRS m/z peak intensity ratios that were linear with respect to the theoretical values, with R2 > 0.998 (Sup. Table 2). Some peptides yielded R2 values that were slightly lower due to a relatively higher level of standard deviation. Several factors affected the standard deviation of sample to SITRS m/z peak intensity ratio. One of the contributing factors was the mass resolution of the MS detector. Less accurate quantitation of m/z peak intensities was observed for larger peptides (i.e., approaching 7,000 Da) where the monoisotopic peaks were not always fully resolved. Another contributing factor was the abundance and ionization efficiency for some monitored peptides. Poor signal-to-noise ratios resulted in larger standard deviations and larger R2 values. Newer MS detectors capable of achieving higher resolution, wider dynamic range and higher signal to noise ratio are expected to further improve the sensitivity of this method.
Method sensitivity and robustness.
To evaluate the sensitivity of the method, the mAb was spiked with varying amounts of a mutant ranging from 20% to 0.625%. The relative intensity of the unlabeled versus the labeled m/z peak for the 20% mutated peptide ( and Sup. Table 3B) clearly is less than that observed for a peptide that does not bear any mutation ( and Sup. Table 3A). Since the mutation does not exist in the SITRS, the mass spectrum of the mutant peptide () does not have the characteristic doublet seen for the wild type peptides. and B show the results of comparing the 20% and 2.5% mutant samples, respectively, with a wild type reference standard. The two peptides HC(218–247) and HC(344–359) bear the mutations and are clearly visible in the 20% mutant sample relative to the background of the wild type peptides. While visually less apparent, the presence of 2.5% mutant in the population is still easily detectable. In contrast, the analysis of the same mAb batch on different days produced nearly identical results for each predominant peptide form, with a deviation not exceeding 1.5% (Sup. Fig. 2). The mass spectrometer responds linearly to the level of mutant down to 0.6% (). Importantly, the quantitation of the second peptide HC(344–359), which also bears a point mutation, behaves in the same manner as HC(218–247). The peptide HC(G0F-288–300), which is the glycopeptide containing the oligosaccharide G0F, also responds linearly but has a different slope than the mutant peptides. This is because the mutant and wild-type mAb have different levels of G0F.
To further test the ability of the SITRS method to discriminate between samples, a change in manufacturing process was simulated by producing the mAb in a HEK cell line. The SITRS analysis of the CHO-versus HEK-derived mAb is shown in . Three peptides immediately stand out from the analysis. First, HC(1–39), which bears an N-terminal pyroglutamate residue, is more abundant in the HEK sample by 7.1% (Sup. Fig. 3). Consistent with this result, HC(1–39) bearing an N-terminal uncyclized glutamine residue is more abundant by 74% in the CHO-derived mAb. The second site of differentiation is in the C-terminal heavy chain peptide HC(439–446). This was due to minor differences in proteolytic processing of Lys446, a common post-translational event in mAbs. The third notable difference is in the relative abundance of various glycopeptides. To verify these differences, the mAbs were deglycosylated with PNGase F and the oligosaccharides were quantitated by HPLC after labeling with 2-aminobenzamide. The differences in oligosaccharide content as determined by the SITRS method versus enzymatic digestion are summarized in . Also included in is a comparison of the levels of N-terminal glutamine conversion and C-terminal lysine removal between the SITRS and label-free MS analyses, as determined by comparison of the intensities of de-charged and de-isotoped peaks via the MassHunter with Bioconfirm software package from Agilent. The results of these two orthogonal methods agree reasonably well, particularly for abundant peptides.
In contrast, two batches of the mAb that were produced by the same manufacturing process in CHO cells were shown to be very similar (). Less than 3% difference was observed in the amount of N-terminal pyroglutamate in peptide HC(1–39). Similarly, the relative difference in HC(439–446) was only 11.7%. Unlike the batch produced in HEK cells, the two CHO-derived batches also showed comparable glycosylation patterns, a result that is supported by oligosaccharide profiling (data not shown).
The SITRS method was also successfully used to assess the effect of stress on an antibody. A comparison of peptides derived from a mAb stored for 6 or 12 months at 4°C in two different buffers seemed to reveal only minor differences between the two samples (). Nevertheless, these minor differences could be quantitated. For example, there was a 6.2% increase in the amount of pyroglutamate in HC(1–39) for the 12 month sample. This result correlated with the loss of HC(1–39) containing N-terminal Gln to 26.8% of that of the 6 month sample. In addition, HC(370–391) decreased by 4.7%. This decrease was attributable to increased deamidation, as the deamidated peptide was in greater abundance in the 12 month sample by 231%. The partially digested peptide HC(60–72) () was observed in the 12 month sample at 911% greater abundance over what was observed in the 6 month sample. This result correlated with a concomitant decrease in HC(60–65), HC(66–72) and HC(68–72).
Discussion
The SITRS method offers several significant features for the comparison of batches of a given protein. First, the method is sensitive and highly reproducible. The average standard deviation of six independent digests, across all predominant peptides of the samples spiked with 0.625% of the mutant mAb1, was 0.7%. Therefore, at a 99% confidence interval, the method detection limit is 2.4%. This level of sensitivity is comparable with what has been achieved for detection of mutants in intact antibodies, the light chain and the heavy chain.Citation22 While even lower levels of mutants have been detected by peptide mapping,Citation22,Citation23 such great sensitivity was achieved because substantial work was invested to establish the identity of the mutant prior to developing a method for its detection. The advantage of SITRS is that knowledge of the mutant is not necessary because the wild-type peptide is initially monitored (vide infra). Furthermore, it is expected that improvements to instrumentation will lead to increased sensitivity, particularly for large peptides and peptides in low abundance.
The second important feature is the robustness of the method. The use of an internal standard mitigates variations in tryptic digestion, as well as artifacts such as deamidation or oxidation during sample processing. Beyond the innate advantages of the internal standard however, robustness also comes from the comparison of two ratios, which mitigates error propagation associated with sample handling. For example, minor differences in the amount of the SITRS added between two samples will have no effect on the final results of the experiment. This approach was also recently used by Geiger et al. to improve the robustness of quantitation in a SILAC spike-in proteomics study.Citation24 An additional source of robustness that is unique to SITRS comes from the large number of monitored peptides from a single protein, which improves relative quantitation. Because most peptides are similar in relative abundance between the two samples, a very precise value for c may be calculated, which is critical for establishing differences in peptide levels.
A third notable feature of the SITRS method is that by taking a ratio of ratios between samples, the SITRS ultimately serves as a bridge to permit the quantitative comparison of two non-labeled samples. This is an important advantage because it would be impractical to have an isotopically labeled protein as the reference standard for release testing and other studies related to good manufacturing practice and commercial processes. Thus, reference standards that have already been generated and thoroughly characterized may be immediately used in a SITRS experiment, even those produced in media containing yeastolate, soy hydrolysate or peptone.
Arguably the most useful feature offered by the SITRS method is that knowledge of possible modifications is not required a priori to identify differences between two samples. Since any side-reaction or mutation would diminish the amount of the unreacted or wild-type counterpart, differences are apparent through a relative decrease in the level of that peptide compared with peptides that are not modified. This approach, while indirect, can quickly inform the analyst of how comparable two or more samples are, both quantitatively and with high resolution. For example, one can easily tell by inspection of that samples A and B are very similar, while sample C is clearly different. This result was expected because A and B were generated by very similar manufacturing processes, while C was produced in a different cell type. With knowledge of the sequence of every peptide that was monitored, generation of hypotheses regarding the cause of differences becomes easier. In the case of sample C, the N-terminal peptide HC(pE-1–39) and the glycopeptide HC(288–300) were different. Based on their sequences, it was hypothesized that the differences stemmed from variation in the level of N-terminal cyclization of glutamine and differences in glycosylation, respectively. Reevaluation of the SITRS data confirmed the hypothesis ().
In a second example, peptides showing the greatest differences amongst stressed samples were the N-terminal HC(pE-1–39) peptide as well as one that contained asparagine. An increase in N-terminal glutamine cyclization, as well as in deamidation, was confirmed. Thus, out of 54 asparagines that may possibly undergo deamidation, the method enabled localization of one residue in peptide HC(370–391) as being relatively reactive. A particularly interesting finding was that HC(60–65), HC(66–72) and HC(68–72) decreased in the range of 2–3.4%. In considering the sequences of these peptides, there were no residues that could obviously undergo modification. This decrease however, prompted us to search for related peptides, leading to the discovery of the partially digested peptide HC(60–72) (), which is in 911% abundance over what is observed in the 6 month sample. Thus, the decrease in HC(60–65), HC(66–72) and HC(68–72) appears to be compensated by an increase in missed cleavages. The cause of these missed cleavages is currently unknown. Nevertheless, this example serves to highlight the utility of the method in aiding the discovery of unanticipated differences amongst proteins.
In conclusion, the use of a SITRS enables the sensitive and quantitative comparability studies of proteins. The key feature of this approach is that, despite the use of an isotopically labeled standard, the output of the experiment is a quantitative comparison of two unlabeled samples of interest. The method enabled the detection of point mutants down to 2.4%. The use of a SITRS also enabled the facile discrimination of two batches of a mAb that were produced in different cell lines, and verified that mAbs produced by the same process were highly comparable. In addition, a SITRS-mediated comparison of two mildly stressed samples enabled identification of sites of low level deamidation, cyclization of glutamine and methionine oxidation. Furthermore, it revealed an unexpected increase in missed cleavages in the peptide HC(60–72). The generality, robustness and sensitivity of the method suggests broad applicability to other problems in biotechnology, including comparability assessments of various batches of a protein, assessments of “biosimilarity,” characterization of antibody-drug conjugates and identification of novel modifications in recombinant proteins.
Materials and Methods
Materials.
The recombinant mAbs were produced in CHO or HEK-293 cell lines and purified at Abbott Bioresearch Center. To generate a SITRS, a CHO cell line expressing the same antibody was cultured in a proprietary chemically-defined medium that contained 13C6-arginine (Cambridge Isotope Laboratories, CLM-2265-0.25) and 13C6-lysine (Cambridge Isotope Laboratories, CLM-2247-0.25) in place of unlabeled amino acid counterparts. The resulting SITRS contained 96.5% fully labeled protein.
Trypsin digestion.
In a typical SITRS experiment, for a single digest, 12.5 µL of mAb sample (4 mg/mL) was mixed with 12.5 µL of SITRS (4 mg/mL). Next, 75 µL of 8 M guanidine HCl (Calbiochem, 369075) in 100 mM Tris, pH 8.0 were added to denature the sample, and the resulting mixture was incubated at room temperature for 15 min. Then, 1 µL of 1 M DTT (Sigma-Aldrich, D-9163) was added to reduce the sample, and the incubation continued at 37°C for 30 min. Next, 5 µL of 0.5 M iodoacetic acid (Sigma-Aldrich, 14386-10 g) were added to alkylate the sample; the resulting mixture was incubated for additional 30 min at 37°C in the dark. Finally, the alkylation reaction was quenched by addition of 1.5 µL of 1 M DTT.
Alkylated protein samples were in-line desalted using a TSKgel SW3000XL guard column, 6.0 mm ID x 40 mm L, 7 µm particle (Tosoh, 08545) and an Agilent 1200 series HPLC system outfitted with a fraction collector. The flow rate was 0.25 mL/min using a running buffer comprised of 10 mM Tris, pH 7.5 with UV detection at 280 nm. The injection volume of the reduced, alkylated protein sample (1 mg/mL) was 100 µL. The peak corresponding to the unresolved heavy and light chains of the antibody were collected using time-based fractionation (2–3 min). A cleaning solution (100 µL) of 6 M guanidine in 75 mM Tris, pH 8.0 was injected between the sample runs to eliminate any possible sample carry-over.
The desalted samples were subjected to trypsin digestion for 30 min at 37°C, using 1:40 (w/w) ratio of trypsin-TPCK (Worthington, TRSEQZ) to protein sample. The digests were quenched by addition of 1 N HCl (JT Baker, 5618-02) to a final concentration of 20 mM. The digested samples were kept at 4°C prior to the LC-MS analysis or at −80°C if the analysis could not be completed within one week.
LC-MS analysis.
An Agilent 1200 series HPLC system equipped with a Higgins Analytical Proto 200 C18 RP column, 1 mm ID x 250 mm L, 5 µm particle, 200 Å pore (Nest Group, RS-2501-D185) coupled to an Agilent 6224 TOF LC/MS system was used for analysis of trypsin-digested samples. About 8 µg of sample was loaded at 98% mobile phase A (0.08% formic acid and 0.02% trifluoroacetic acid in Milli-Q water) and 2% mobile phase B (0.08% formic acid and 0.02% trifluoroacetic acid in acetonitrile). After 10 min of chromatography in 2% mobile phase B, the sample was eluted using a gradient of 2–55% mobile phase B over 80 min. The column was washed using 98% mobile phase B for 10 min and equilibrated using 2% B for 10 min. The flow rate was 50 µL/min and the column oven temperature was 60°C. The mass spectrometer was operated in a positive mode with extended dynamic range (2 GHz mode) setting, with a scan range of 200–1,700 m/z, and with two scans per second rate for the data acquisition. Ion spray voltage was set at 5,000 volts and the source temperature was set at 350°C. The acquired data was analyzed using the Agilent MassHunter software to determine the intensities of the relevant peaks. The relative intensities were then exported to Microsoft Excel for further analysis. The latter procedure was automated using in-house proprietary software.
Disclosure of Potential Conflicts of Interest
No potential conflicts of interest were disclosed.
Abbreviations
| MS | = | mass spectrometry |
| LC-MS | = | liquid chromatography-mass spectrometry |
| SITRS | = | stable isotope-tagged reference standard |
| mAb; monoclonal antibody; CHO | = | Chinese hamster ovary |
| HEK | = | human embryonic kidney |
| DTT | = | dithiothreitol |
| IAA | = | iodoacetic acid |
| PNGase F | = | peptide:N-glycosidase F |
Figures and Tables
Figure 2 Extracted ion mass spectra for the SITRS experiment in which wt mAb-1 was compared to mAb-1 that was spiked with mutant to 20%. Peptide HC(255–273) is present in both wt and mutant mAb (A), while peptide HC(218–247) is modified in the mutant mAb (B). The mutated peptide HC(218–247) was readily identified (C); this peptide lacks m/z peak corresponding to its SITRS counterpart.
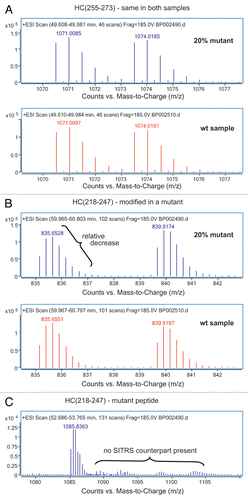
Figure 3 Relative levels of predominant peptides from stable isotope-tagged reference standard analysis of a wild-type mAb-1 compared to the same mAb-1 that was spiked with a mutant to 20% (A) or 2.5% (B). The peptides HC(218–247) and HC(344–359) that bear mutations are easily spotted even at 2.5% level. Peptide HC(288–300) is glycosylated with G0F and peptide HC(439–446) contains a C-terminal lysine. The levels of both glycosylation and the presence of the C-terminal lysine appear to differ between the mutant and the wt mAb-1.
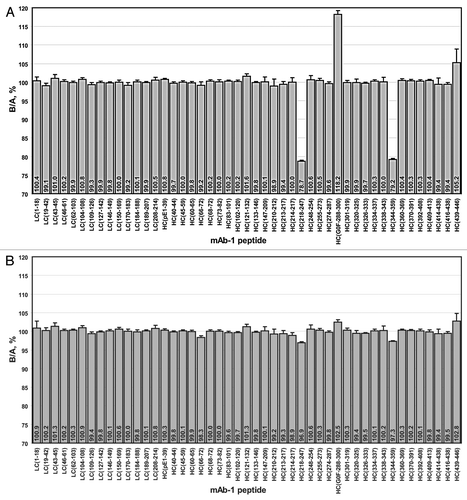
Figure 4 Relative amounts of peptides HC(218–247) and HC(344–359) from mutant and wild-type antibody by stable isotope-tagged reference standard analysis. Variation in the G0F-modified glycopeptide HC(288–300) is also plotted.
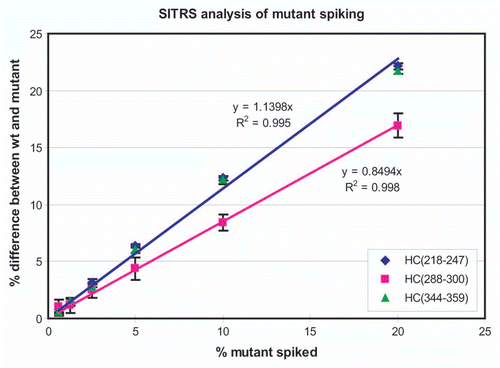
Figure 5 Comparison of batches of mAbs made by two different processes. Batch 1 of mAb-1 is compared to batch 2 of the same mAb-1 produced by the same CHO cell line-based process (A), and to batch 3 of the same mAb-1 produced by a different cell line (HEK-293) (B).
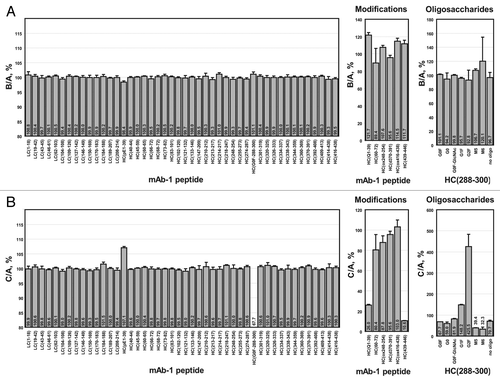
Figure 6 Comparison of mAb-1 stressed for 6 (sample A) or 12 months (sample B) at 4°C by stable isotope-tagged reference standard analysis.
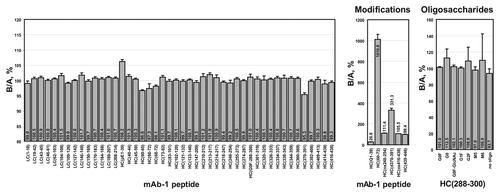
Table 1 Comparison of stable isotope-tagged reference standard (SITRS) results with conventional analyses of modifications
Additional material
Download Zip (443.1 KB)Acknowledgments
We thank Keith Cochran for growing and harvesting the monoclonal antibodies and Yumiko Kobayashi and Keith Hickman for purification. We also thank David Resendes (UMass Amherst) for advice on statistics. Gary Welch is gratefully acknowledged for his support of this project.
References
- US Food and Drug Administration. Q5E Comparability of Biotechnological/Biological Products Subject to Changes in Their Manufacturing Process 2005; wwwfdagov/RegulatoryInformation/Guidances/ucm128059 htm
- Woodcock J, Griffin J, Behrman R, Cherney B, Crescenzi T, Fraser B, et al. The FDA's assessment of follow-on protein products: a historical perspective. Nat Rev Drug Discov 2007; 6:437 - 442
- Liu H, Gaza-Bulseco G, Faldu D, Chumsae C, Sun J. Heterogeneity of monoclonal antibodies. J Pharm Sci 2008; 97:2426 - 2447
- Jenkins N, Meleady P, Tyther R, Murphy L. Strategies for analysing and improving the expression and quality of recombinant proteins made in mammalian cells. Biotechnol Appl Biochem 2009; 53:73 - 83
- Jenkins N, Murphy L, Tyther R. Post-translational modifications of recombinant proteins: significance for biopharmaceuticals. Mol Biotechnol 2008; 39:113 - 118
- Li H, d'Anjou M. Pharmacological significance of glycosylation in therapeutic proteins. Curr Opin Biotechnol 2009; 20:678 - 684
- Tuli L, Ressom HW. LC-MS Based Detection of Differential Protein Expression. J Proteomics Bioinform 2009; 2:416 - 438
- Griffin NM, Yu J, Long F, Oh P, Shore S, Li Y, et al. Label-free, normalized quantification of complex mass spectrometry data for proteomic analysis. Nat Biotechnol 2009; 28:83 - 89
- Ong SE, Foster LJ, Mann M. Mass spectrometric-based approaches in quantitative proteomics. Methods 2003; 29:124 - 130
- Beynon RJ, Pratt JM. Metabolic labeling of proteins for proteomics. Mol Cell Proteomics 2005; 4:857 - 872
- Treumann A, Thiede B. Isobaric protein and peptide quantification: perspectives and issues. Expert Rev Proteomics 2010; 7:647 - 653
- Gygi SP, Rist B, Gerber SA, Turecek F, Gelb MH, Aebersold R. Quantitative analysis of complex protein mixtures using isotope-coded affinity tags. Nat Biotechnol 1999; 17:994 - 999
- Pratt JM, Simpson DM, Doherty MK, Rivers J, Gaskell SJ, Beynon RJ. Multiplexed absolute quantification for proteomics using concatenated signature peptides encoded by QconCAT genes. Nat Protoc 2006; 1:1029 - 1043
- Kirkpatrick DS, Gerber SA, Gygi SP. The absolute quantification strategy: a general procedure for the quantification of proteins and post-translational modifications. Methods 2005; 35:265 - 273
- Miyagi M, Rao KC. Proteolytic 18O-labeling strategies for quantitative proteomics. Mass Spectrom Rev 2007; 26:121 - 136
- Heudi O, Barteau S, Zimmer D, Schmidt J, Bill K, Lehmann N, et al. Towards absolute quantification of therapeutic monoclonal antibody in serum by LC-MS/MS using isotope-labeled antibody standard and protein cleavage isotope dilution mass spectrometry. Anal Chem 2008; 80:4200 - 4207
- Izrael-Tomasevic A, Phu L, Phung QT, Lill JR, Arnott D. Targeting interferon alpha subtypes in serum: a comparison of analytical approaches to the detection and quantitation of proteins in complex biological matrices. J Proteome Res 2009; 8:3132 - 3140
- Brun V, Dupuis A, Adrait A, Marcellin M, Thomas D, Court M, et al. Isotope-labeled protein standards: toward absolute quantitative proteomics. Mol Cell Proteomics 2007; 6:2139 - 2149
- Amini A, Nilsson E. Quantitative analysis of polypeptide pharmaceuticals by matrix-assisted laser desorption/ionization time-of-flight mass spectrometry. J Pharm Biomed Anal 2008; 46:411 - 417
- Ye H, Hill J, Kauffman J, Han X. Qualitative and quantitative comparison of brand name and generic protein pharmaceuticals using isotope tags for relative and absolute quantification and matrix-assisted laser desorption/ionization tandem time-of-flight mass spectrometry. Anal Biochem 2010; 400:46 - 55
- Ye H, Hill J, Kauffman J, Han X, Gryniewicz C. Detection of protein modifications and counterfeit protein pharmaceuticals using isotope tags for relative and absolute quantification and matrix-assisted laser desorption/ionization tandem time-of-flight mass spectrometry: studies of insulins. Anal Biochem 2008; 400:46 - 55
- Wen D, Vecchi MM, Gu S, Su L, Dolnikova J, Huang YM, et al. Discovery and investigation of misincorporation of serine at asparagine positions in recombinant proteins expressed in Chinese hamster ovary cells. J Biol Chem 2009; 284:32686 - 32694
- Yu XC, Borisov OV, Alvarez M, Michels DA, Wang YJ, Ling V. Identification of codon-specific serine to asparagine mistranslation in recombinant monoclonal antibodies by high-resolution mass spectrometry. Anal Chem 2009; 81:9282 - 9290
- Geiger T, Wisniewski JR, Cox J, Zanivan S, Kruger M, Ishihama Y, et al. Use of stable isotope labeling by amino acids in cell culture as a spike-in standard in quantitative proteomics. Nat Protoc 2011; 6:147 - 157
