Abstract
We have studied the abundance and phylogenetic distribution of the Highly Iterated Palindrome 1 (HIP1) among sequenced prokaryotic genomes. We show that an overrepresentation of HIP1 is exclusive of some lineages of cyanobacteria, and that this abundance was gained only once during evolution and was subsequently lost in the lineage leading to marine pico-cyanobacteria. We show that among cyanobacterial protein sequences with annotated Pfam domains, only OpcA (glucose 6-phosphate dehydrogenase assembly protein) has a phylogenetic distribution fully matching HIP1 abundance, suggesting a functional relationship; we also show that DAM methylase (an enzyme that has the four central nucleotides of HIP1 as is site of action) is present in all cyanobacterial genomes (independently of their HIP1 content) with the exception of marine pico-cyanobacteria whom might have lost this enzyme during the process of genome reduction. Our analyses also show that in some prokaryotic lineages (particularly in those species with large genomes), HIP1 is unevenly distributed between coding and non-coding DNA (being more common in coding regions; with the exception of Cyanobacteria Yellowstone B’ and Synechococcus elongates where the reverse pattern is true). Finally, we explore the hypothesis that the HIP1 can be used as a molecular “water-mark” to identify horizontally transferred genes from cyanobacteria to other species.
Introduction
Highly Iterated Palindrome 1 (HIP1) is a short sequence of eight nucleotides (5′-GCGATCGC-3′) first described in Synechococcus PCC 6301 flanking an adaptive gene-deletion event.Citation1 Initial sequence analysis of GenBank/EMBL/DDBJ DNA Nucleotide Sequence Data Libraries indicated that this motif is abundant only in cyanobacterial species and that it is present in coding as well as in non-coding regions.Citation1 A further in-depth study has confirmed previous observations, but also showed that HIP1 is not common among all lineages of cyanobacteria.Citation2
However, several questions remain regarding the evolution and the adaptive significance (if any) of this sequence. For instance, previous studies were not able to resolve the polyphyletic or monophyletic nature of individual HIP1 motifs among homologous sequences, nor the ancestral or derived state of this character among cyanobacterial lineages. Regarding the origin and mobility of this sequence, it was suggested (based on the lack of gaps surrounding HIP1 motifs into aligned homologous sequences), that HIP1 propagates in cyanobacteria via nucleotide substitutions.Citation3 The rationale behind previous conclusion was as follow, if HIP1 would propagate through insertion events in coding sequences, downstream-frameshifts generated by this octanucleotide would have to be accommodate via additional insertion or deletions events. The analysis of 68 genes from Synechococcus PCC 7942 aligned to their corresponding homologs from Escherichia coli showed a lack of such additional deletion or insertions, therefore supporting the hypothesis of propagation via nucleotide substitutions.Citation3
It is not known whether HIP1 confers some kind of advantage to its host, or if it is a molecular parasite (or the footprint left by a selfish genetic element). If HIP1 propagates through nucleotide substitutions (i.e., point mutations originating an HIP1 sequence are selected for), then a legitimate question is, what is the function encoded by this sequence? It has been speculated that one possibility is that HIP1 could provide desiccation tolerance by promoting intramolecular illegitimate recombination, much in the same way as it happens in Deinococcus radiodurans.Citation3 Previous analysis have shown that HIP1 can indeed promote recombination.Citation1,Citation3 However there is no evidence of any putative recombinase which recognizes HIP1, and attempts to identify a protein complex associated with HIP1 have remained unsuccessful.Citation3 As of today, the only enzyme proposed to interact with HIP1 is D12 class N6 adenine-specific DNA methyltransferases (DAM methylases).Citation3,Citation4 This is because the central 4 nt of HIP1 (5′-GATC-3′) is the site of this enzyme.Citation3,Citation4
More recent studies showed that one kind of repetitive element named Small Dispersed Repeat 5 (SDR5) is found interrupting HIP1 motifs between their third and fourth nucleotide in Nostoc punctiforme (i.e., 5′-GCG|ATCGC-3′, where the vertical bar indicates the place of insertion of SDR5).Citation5 This repeat (SDR5) consist of 21 nucleotides that seems to fold into an stable secondary structure.Citation5 The relationship between HIP1 and SDR5 is not understood, but it has been hypothesized that SDR5 could integrate into HIP1 through target-primed reverse transcription.Citation5
In this study we address the phylogenetic distribution of HIP1 among completely sequenced prokaryotic genomes, its frequency of occurrence among coding and non-coding regions, and its co-occurrence with DAM methylases and other proteins among cyanobacteria. Finally, we test the hypothesis that HIP1 could serve as a water-mark of horizontally transferred genes from cyanobacteria to other prokaryotic lineages.
Results
Occurrence of HIP1 among cyanobacteria and other sequenced prokaryotic genomes.
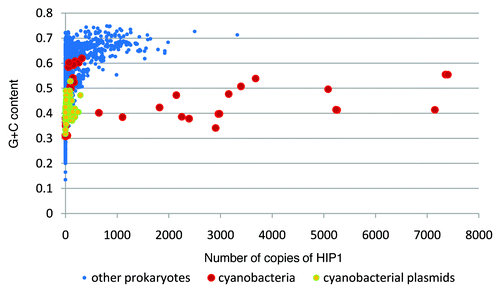
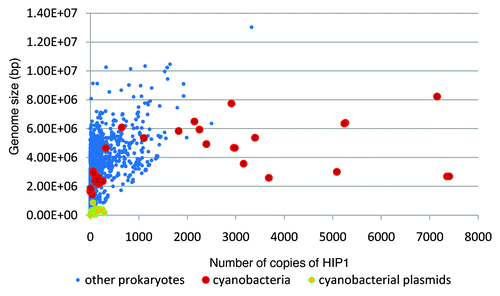
As shown in , some lineages of cyanobacteria have, by far, the largest ratio of observed vs. expected number of copies of HIP1 in their genome. This excess of copies of HIP1, is not related to GC-content content (), nor genome size ().
Figure 1 Abundance of HIP1 on sequenced prokaryotic genomes. Each dot represents a replicome. The figure shows the observed over the expected Log10(obs/exp) number of copies of HIP1, vs. the squared difference of observed minus expected Log10[(obs - exp)2/exp] number of copies of HIP1 per replicome. Expected numbers of copies of HIP1 are calculated directly from nucleotide frequencies.
![Figure 1 Abundance of HIP1 on sequenced prokaryotic genomes. Each dot represents a replicome. The figure shows the observed over the expected Log10(obs/exp) number of copies of HIP1, vs. the squared difference of observed minus expected Log10[(obs - exp)2/exp] number of copies of HIP1 per replicome. Expected numbers of copies of HIP1 are calculated directly from nucleotide frequencies.](/cms/asset/475e1423-974e-404b-ab1f-f2a784db366e/kmge_a_10918300_f0001.gif)
The specie with the largest excess of HIP1 in its central replicome is the marine diazotrophic cyanobacteria Trichodesmium erythraeum, followed by some heterocyst forming cyanobacteria (Nostoc punctiforme, Anabaena sp. PCC7120 and Anabaena variabilis) and the obligate autotrophic fresh water cyanobacteria Synechococcus elongatus. On the other hand, the group of cyanobacteria with fewest copies of HIP1 comprises the early diverging species (Gloeobacter violaceus, Cyanobacteria Yellowstone A-Prime and B-Prime) and the marine pico-cyanobacteria (in particular those from Prochlorococcus genus) (Table S1).
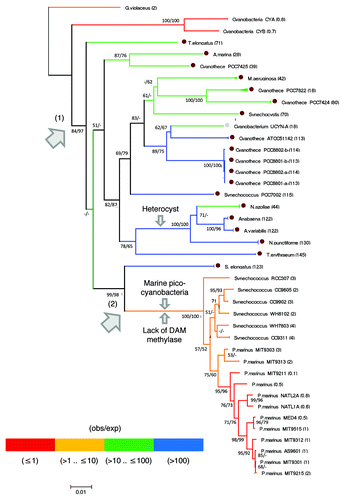
To have an evolutionary perspective on the abundance/distribution pattern of this palindromic sequence, we have reconstructed a 16SrRNA phylogenetic tree and mapped the occurrence of HIP1 among lineages (). Contrary to what has been previously reported,Citation3 HIP1's abundance do seem to follow a simple phylogenetic distribution. An excess of HIP1 starts at the branch separating early diverging cyanobacteria (G. violaceus, Cyanobacteria Yellowstone A-Prime and B-Prime) from the rest of species, and terminates at the branch leading to marine picocyanobacteria ().
Figure 4 16SrRNA Neighbor-Joining tree from cyanobacterias whose genomes have been completely sequenced. Branches are colored according to the observed over expected (obs/exp) number of copies of HIP1 (see the color code at the bottom of the figure). The actual value of (obs/exp) for each replicome is shown in parenthesis. A brown dot indicates those genomes with 10 times more copies of HIP1 than expected by chance, and a value larger than 1000 for the sum of squared differences (i.e., the rightmost cyanobacteria from ). A gray dot indicates the particular case of Cyanobacterium UCYN-A which has a value smaller than 1000 for the squared differences while having 18 times more copies of HIP1 than expected by chance. Arrows 1 and 2 indicate the branch where the excess of HIP1 was gained and lost, respectively. For reference, the branch leading to heterocyst forming cyanobacteria is indicated. Bootstrap values shown are for Neighbor-Joining/Maximum-Likelihood trees. When the node has a value smaller than 50 (or is inexistent in the Maximum-Likelihood tree) a dash is shown instead.
Phylogenetic distribution of DAM methylase.
As mentioned above, it has been noted that the central 4 nt of HIP1 (5′-GATC-3′) is the site of action of DAM methylase.Citation3,Citation4 To see if there is an association between DAM methylases and the abundance of HIP1, we have studied the phylogenetic distribution of this enzyme [Pfam family: MethyltransfD12 (PF02086)] among cyanobacterial genomes. As shown in (and Fig. S1), DAM methylases are present in all genomes with the exception of marine pico-cyanobacteria.
Proteins associated to high and low HIP1 copy number replicomes.
In order to identify candidate proteins that might be responsible of generating high copy numbers of HIP1, we have calculated Pfam domains for all cyanobacterial proteins, and then, asked for those proteins (according to their domain structure) shared among all genomes with high HIP1 copy numbers, and absent in low HIP1 copy number genomes. To check if the excess of HIP1 is due to a secondary loss (instead of an acquisition of a new protein), we have also asked for the inverse pattern, this is, those proteins shared among all low HIP1 copy numbers, and absent in all high HIP1 copy number genomes.
The percentage of proteins annotated with at least one Pfam domain in each genome, varied from 53% in Microcystis aeruginosa to 79% in Cyanobacterium UCYN-A, with a mean value of 67% (Table S2). When we asked for single protein domains found among all high HIP1 copy number genomes with the exclusion of low HIP1 copy number genomes (and vice versa), we found none. However, if we ask for protein-domain architectures instead of single protein domains (where an architecture is composed of one or more Pfam domains in a specific order), we do find a candidate family (OpcA) with the desired phylogenetic distribution.
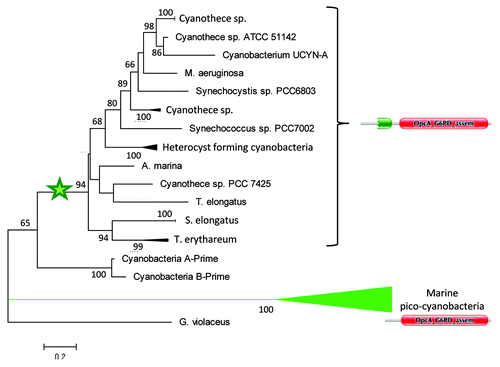
Interestingly, the OpcA protein is composed of two domains among high HIP1 copy number genomes, and of a single domain among low HIP1 copy number genomes, therefore satisfying both phylogenetic conditions at the same time ( and Fig. S2). The domain shared by all cyanobacteria (having high and low HIP1 copy numbers genomes) is named OpcA_G6PD_assem after Glucose-6-phosphate dehydrogenase subunit (PF10128); and the domain found only among high HIP1 copy number genomes is named PG_binding_1 from Putative peptidoglycan binding domain (PF01471). According to Pfam database, proteins containing PG_binding_1 (peptidoglycan binding domains) are mostly involved in bacterial cell wall degradation.Citation6
A phylogenetic analysis of the OpcA_G6PD_assem domain, shows that marine pico-cyanobacteria acquired their OpcA protein directly from early diverging cyanobacteria (), very likely through horizontal gene transfer. To discard long branch attraction as an explanation for the branching pattern of marine pico-cyanobacteria, we have eliminated poorly aligned positions from the multiple alignment by using GblocksCitation7 with default parameters, and we have obtained the same branching pattern for marine pico-cyanobacteria (data not shown).
Figure 5 Maximum-Likelihood tree of cyanobacterial OpcA_G6PD_assem protein domain. As shown, marine pico-cyanobacteria branches from early diverging cyanobacteria. Domain structure of OpcA proteins are also shown. The star indicates the likely position of the event of PG_binding_1 fusion to OpcA_G6PD_assem domain. Only bootstrap values larger than 50 are shown.
Distribution of HIP1 among coding and non-coding regions.
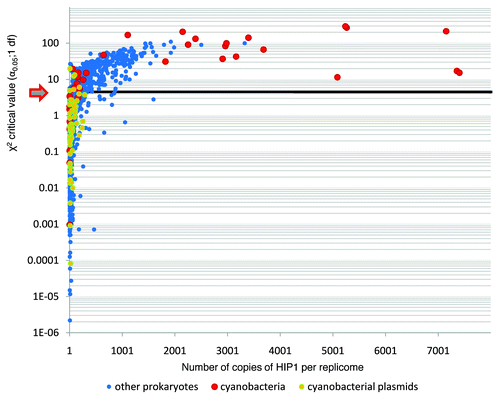
We have analyzed whether or not HIP1 is distributed randomly between coding and non-coding regions. The result of a χ2 test for each of the sequenced prokaryotic genomes is shown in . Accordingly, there are a number of replicomes on which there is a bias in the distribution of HIP1 between coding and non-coding DNA. Among cyanobacteria (and in most cases), HIP1 is found more often in coding regions, with the exception of S. elongatus and Cyanobacteria Yellowstone B-Prime, where the opposite pattern is true (Table S3). Although the result of an heterogeneity χ2 test indicate that replicomes with and without bias in their HIP1 distribution belong to two different populations, this result has to be taken cautiously because there seems to be a relationship between genome size and rejection of the null hypothesis of no difference in the abundance of HIP1 in coding and no-coding regions (i.e., the mean genome size of replicomes where the difference is significant is larger than otherwise; Fig. S3).
Presence of HIP1 in DNA Sequences from Species Other than Cyanobacteria
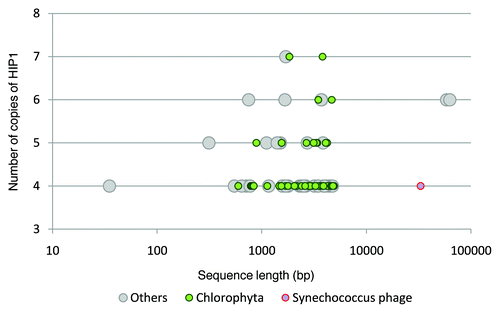
To test the idea that genes with abundant copies of HIP1 in non-cyanobacterial species arrived by horizontal gene transfer from cyanobacteria with large number of copies of HIP1, we have scanned GenBank nt database for non-cyanobacterial genes with copies of HIP1. First, we studied the abundance of HIP1 per-gene in genome sequences from cyanobacteria and other prokaryotes ( and Table S4). In an attempt to have a balance between sensibility and specificity, we decided to use as a cutoff value, four copies of HIP1 per gene. This is, because the fraction of genes having four or more copies of HIP1 is ∼0.004 for non-cyanobacterial genes and ∼0.09 for cyanobacterial genes, (i.e., there are approximately 20 cyanobacterial genes for each non cyanobacterial genes). Since we were interested in detecting genes (or small groups of contiguous genes) that could have been transferred from cyanobacteria to other species, only sequences with less than 100,000 bp in GenBank nt database were considered for this analysis. Results are shown in . Only 99 DNA sequences from species other than cyanobacteria have less than 100,000 bp and four or more copies of HIP1 in GenBank nt database. Noteworthy, 53 of them belong to the phylum Chlorophyta (species: Ostreococcus lucimarinus, O. tauri, Micromonas sp RCC299 and M. pusilla). These species belong to the Prasinophyceae which are ancient members of the green lineage; the lineage giving rise to higher plants.Citation8 Whether or not sequences from these species have a cyanobacterial origin requires more in depth phylogenetic analyses. Other species having 4 or more copies of HIP1, belong to different phyla from Bacteria, Eukarya and some phages (Table S5).
Figure 7 Distribution of HIP1 abundance per gene among cyanobacteria and other prokaryotes. The fraction of genes in each category is calculated as [(observed number of genes having xi number of copies of HIP1) / (total number of genes having copies of HIP1)]. Where xi = 1, 2, … 20. The arrow indicates the cutoff value to search for candidate xenologous cyanobacterial genes in non-cyanobacterial species.
![Figure 7 Distribution of HIP1 abundance per gene among cyanobacteria and other prokaryotes. The fraction of genes in each category is calculated as [(observed number of genes having xi number of copies of HIP1) / (total number of genes having copies of HIP1)]. Where xi = 1, 2, … 20. The arrow indicates the cutoff value to search for candidate xenologous cyanobacterial genes in non-cyanobacterial species.](/cms/asset/d88c7fa6-2502-4e5c-a44d-aa9c23c6588f/kmge_a_10918300_f0007.gif)
Discussion
Although there are some prokaryotes other than cyanobacteria showing relative large copy numbers of HIP1 in their genomes (like the Actinobacteria Conexibacter woesei, the Alphaproteobacteria Sphingomonas wittichii, and the Deltaproteobacteria Sorangium cellulosum; Table S1) all of them have relative high GC-content content values (0.72, 0.68 and 0.71 respectively), a factor that affects the abundance of HIP1 (). Therefore, large copy numbers of HIP1, not related to GC-content content, is clearly a phenomenon restricted to some of the cyanobacterial lineages ( and ).
It is not yet known which molecule(s) is responsible for the origin and proliferation of HIP1 among cyanobacteria; or the adaptive value (if any) of this palindromic sequence. At present times, only DAM methylases have been proposed to interact with HIP1.
Lack of DAM methylases (following its PfamCitation9 domain definition) and low copy numbers of HIP1 among marine pico-cyanobacteria are clearly derived characters of this lineage of bacteria (i.e., the ancestral state was abundance of HIP1 and presence of DAM methylase, as suggested by the rooting of the 16SrRNA tree from ). The low copy number of HIP1 might be related to the process of genome reduction suffered by this lineage of bacteria.Citation10 For instance, a common trend among prokaryotes with reduced genomes is a low GC-content content.Citation11 This in turn, influences the abundance of HIP1. During the course of evolution of genome reduction, the number of copies of HIP1 diminished as the GC-content content dropped. This process seems to have been particularly strong for Prochlorococcus spp where the average GC-content content is ∼0.36 and the lowest values of observed and expected numbers of HIP1 are found among cyanobacteria (Table S1). On the other hand, the enzyme DAM methylase seems to have been lost early during the course of genome reduction of marine pico-cyanobacteria. Its deletion may not be related to the low number of copies of HIP1 among these marine bacteria, since other bacteria, like the early diverging Cyanobacteria Yellowstone A' and B' have lower numbers of copies of HIP1 than marine Synechococcus while coding for DAM methylase.
Among early diverging cyanobacteria, the rarity of HIP1 is not related to GC-content content, which is relatively high (∼0.6). These bacteria have an HIP1 content which is not particularly different from that of other prokaryotes (Table S1). They represent, the “ancestral state” prior to the proliferation of HIP1 among newcomer cyanobacterial lineages. Some genes absent in the genomes of early diverging cyanobacteria and marine pico-cyanobacteria must be the responsible for the large proliferation of HIP1 among the rest of cyanobacterial lineages studied here.
The concordance between the evolution of OpcA and HIP1 abundance suggest a functional relationship. The branching of marine pico-cyanobacterial OpcA among early diverging cyanobacteria suggests that marine Synechococcus and Prochlorococcus acquired their OpcA through horizontal gene transfer from low HIP1 copy number cyanobacterias. This adds to the hypothesis that HIP1 abundance is somehow related to the kind of OpcA coded in the genome (i.e., high HIP1 copy number cyanobacteria have an OpcA protein with a PG_binding_1 domain added). However, from the function of OpcA it is not clear how this protein can be functionally related to the proliferation of HIP1. OpcA has been shown to acts as an allosteric activator of Glucose-6-Phosphate dehydrogenase (G6PD) in Nostoc punctiforme, which is an essential enzyme for nitrogen fixation and dark heterotrophic growth.Citation12 Being OpcA an allosteric activator, it could be hypothesized that OpcA also activates the molecule responsible of proliferating HIP1. However, a spurious association between OpcA and HIP1 abundance can't be ruled out. After all, approximately 33% of all proteins from cyanobacterial species studied here do not match any Pfam doman. It wouldn't be surprising that the molecular machinery to produce HIP1 is encoded among them.
An intriguing observation is the almost obligatory cooccurrence of SDR5 with HIP1 along the genome of the multicellular cyanobacterium Nostoc punctiforme.Citation5 However, it is not clear if both sequences originate by the same molecular machinery or not. For instance, the phylogenetic distribution of HIP1 is larger than that of SRD5. SDR5 is confined only to heterocystous cyanobacteriaCitation5 while HIP1 has a much wider distribution. This observation suggests that HIP1 predates SRD5, but, it could be also possible that SDR5 has a different sequence outside heterocystous cyanobacteria and has been overlooked by previous analysis.Citation5 This point clearly deserves further attention.
Here we show that in some prokaryotic genomes there is a statistically significant difference in the number of copies of HIP1 between coding and non-coding DNA. This result has to be taken cautiously because the propensity to reject the null hypothesis (of no difference) seems to be related to genome size. This is, the mean size of replicomes rejecting the null hypothesis is much larger (4,119,783 bp) than that of those replicomes not rejecting the null hypothesis (1,608,597 bp) (Fig. S3C). It is not known if this tendency is due simply by a sample-size effect, or if there are other parameters affecting the result. The data also show some other general tendencies (Fig. S3A and B). For instance, in most cases when the null hypothesis is rejected, is due to an excess of copies of HIP1 on coding regions than in non-coding regions, and only in a few cases the reverse pattern is true. Another general tendency is that, on average, statistically significant differences are due to an underrepresentation of copies of HIP1 in non-coding regions (rather than an overrepresentation of copies of HIP1 in coding regions) when compared with replicomes on which the difference is not statistically significant (Figure S3D). More in depth studies are required to understand the basis of the differences and tendencies outlined above. Nevertheless, it is likely that there is not a particular functional reason to have more copies of HIP1 in coding regions, because the pattern found in cyanobacteria is extensible to other prokaryotes where the difference of observed vs. expected number of copies of HIP1 is not as pronounced.
Being a distinctive feature of several cyanobacterial genomes, it could be possible to use HIP1 as a molecular “water-mark” to identify genes horizontally transferred into non cyanobacterial species. However, due to the amelioration process suffered by of horizontally transferred genes, only recent cases of HGT could be detected by this approach.Citation13 From the analysis reported here, it is not possible to confirm that sequences from the Prasinophyceae protists originated in cyanobacteria. Spurious similarity it is also a perfectly possible explanation. Further analysis could consist in taking longer sequences than 100,000 bp and split them up into smaller regions in order to expand the search.
Regarding the molecular evolution of HIP1 several questions remain. Which molecules are responsible of originating HIP1? What is the relationship between SRD5 and HIP1? Does rich HIP1 sequences from Ostreococcus spp, and Micromonas spp truly originated in cyanobacteria? How does HIP1 affect the amino acid composition and the tertiary structure of proteins? On what kind of genes does HIP1 is found more often? We hope this work stimulates new lines of research on this very peculiar feature of some cyanobacterial lineages.
Materials and Methods
Genome databases and statistical analyses.
Complete sequenced prokaryotic genomes where downloaded from KEGG database (www.genome.jp/kegg/). HIP1 abundance, GC-content content, genome size and χ2 were all estimated and calculated using Perl scripts available upon request. The expected numbers of copies of HIP1 per replicome were estimated as the product of the frequencies of individual bases conforming HIP1 multiplied by the total number of bases in each one of the replicomes. The critical value for the heterogeneity χ2 was calculated using the formula provided by.Citation14
Phylogenetic analyses.
The molecules of 16srRNA of each of the cyanobacterial genomes were downloaded, and aligned using MUSCLE software using default parameters.Citation15 A Neighbor-Joining (500 bootstrap replications, Maximum Composite Likelihood distance estimation and uniform rates among sites) and Maximum-Likelihood (model Kimura-2P plus Gamma distribution with invariant sites, selected according to the Bayesian Information Criterion, 500 bootstrap replications) phylogenetic trees were reconstructed using MEGA5 software.Citation16
Domain search.
Protein sequences from cyanobacterial genomes were searched with HMMER software using Pfam profile MethyltransfD12 (PF02086).Citation17
GenBank analyses. The GenBank nt databaseCitation18 was scanned for non-cyanobacterial DNA sequences having at least four copies of HIP1 and a maximum of 100,000 bp. The searh was implemented using a Perl script available upon request.
Disclosure of Potential Conflicts of Interest
No potential conflicts of interest were disclosed.
Abbreviations
| HIP1 | = | highly iterated palindrome 1 |
| HGT | = | horizontal gene transfer |
| SDR | = | small dispersed repeat |
| OpcA | = | glucose 6-phosphate dehydrogenase assembly protein |
Figures and Tables
Table 1 Phylogenetic distribution of DAM methylase and OpcA proteins among cyanobacterial genomes
Additional material
Download Zip (1.4 MB)Acknowledgments
L.D. wishes to thank CINVESTAV Unidad Irapuato for all facilities provided. Financial support was provided by grant PROMETEO 2009/092 from Conselleria d'Educació, Generalitat Valenciana, Spain, to A.M.
References
- Gupta A, Morby AP, Turner JS, Whitton BA, Robinson NJ. Deletion within the metallothionein locus of cadmium-tolerant Synechococcus PCC 6301 involving a highly iterated palindrome (HIP1). Mol Microbiol 1993; 7:189 - 195; PMID: 8446026; http://dx.doi.org/10.1111/j.1365-2958.1993.tb01110.x
- Robinson NJ, Robinson PJ, Gupta A, Bleasby AJ, Whitton BA, Morby AP. Singular over-representation of an octameric palindrome, HIP1, in DNA from many cyanobacteria. Nucleic Acids Res 1995; 23:729 - 735; PMID: 7708486; http://dx.doi.org/10.1093/nar/23.5.729
- Robinson PJ, Cranenburgh RM, Head IM, Robinson NJ. HIP1 propagates in cyanobacterial DNA via nucleotide substitutions but promotes excision at similar frequencies in Escherichia coli and Synechococcus PCC 7942. Mol Microbiol 1997; 24:181 - 189; PMID: 9140975; http://dx.doi.org/10.1046/j.1365-2958.1997.3391695.x
- Casadesús J, Low D. Epigenetic gene regulation in the bacterial world. Microbiol Mol Biol Rev 2006; 70:830 - 856; PMID: 16959970; http://dx.doi.org/10.1128/MMBR.00016-06
- Elhai J, Kato M, Cousins S, Lindblad P, Costa JL. Very small mobile repeated elements in cyanobacterial genomes. Genome Res 2008; 18:1484 - 1499; PMID: 18599681; http://dx.doi.org/10.1101/gr.074336.107
- Finn RD, Mistry J, Tate J, Coggill P, Heger A, Pollington JE, Gavin OL, Gunesekaran P, Ceric G, Forslund K, Holm L, Sonnhammer EL, Eddy SR, Bateman A. The Pfam protein families database. Nucleic Acids Res 2010; D211 - D222 Database Issue 38
- Castresana J. Selection of conserved blocks from multiple alignments for their use in phylogenetic analysis. Mol Biol Evol 2000; 17:540 - 552; PMID: 10742046
- Slapeta J, López-García P, Moreira D. Global dispersal and ancient cryptic species in the smallest marine eukaryotes. Mol Biol Evol 2006; 23:23 - 29; PMID: 16120798; http://dx.doi.org/10.1093/molbev/msj001
- Finn RD, Mistry J, Tate J, Coggill P, Heger A, Pollington JE, et al. The Pfam protein families database. Nucleic Acids Res 2010; 38:D211 - D222
- Dufresne A, Garczarek L, Partensky F. Accelerated evolution associated with genome reduction in a free-living prokaryote. Genome Biol 2005; 6:R14; PMID: 15693943; http://dx.doi.org/10.1186/gb-2005-6-2-r14
- Delaye L, Gil R, Pereto J, Latorre A, Moya A. Life with a few genes: a survey on naturally evolved reduced genomes. The Open Evolution Journal 2010; 4:12 - 22; http://dx.doi.org/10.2174/1874404401004010012
- Hagen KD, Meeks JC. The unique cyanobacterial protein OpcA is an allosteric effector of glucose-6-phosphate dehydrogenase in Nostoc punctiforme ATCC 29133. J Biol Chem 2001; 276:11477 - 11486; PMID: 11152472; http://dx.doi.org/10.1074/jbc.M010472200
- Poptsova MS, Gogarten JP. The power of phylogenetic approaches to detect horizontally transferred genes. BMC Evol Biol 2007; 7:45; PMID: 17376230; http://dx.doi.org/10.1186/1471-2148-7-45
- Zar HJ. Biostatistical analysis 1999; Fourth edition New Jersey Prentice Hall App16
- Edgar RC. MUSCLE: multiple sequence alignment with high accuracy and high throughput. Nucleic Acids Res 2004; 32:1792 - 1797; PMID: 15034147; http://dx.doi.org/10.1093/nar/gkh340
- Tamura K, Peterson D, Peterson N, Stecher G, Nei M, Kumar S. MEGA5: molecular evolutionary genetics analysis using maximum likelihood, evolutionary distance, and maximum parsimony methods. Mol Biol Evol 2011; 28:27319; PMID: 21546353; http://dx.doi.org/10.1093/molbev/msr121
- Eddy SR. Profile hidden markov models. Bioinformatics 1998; 14:755 - 763; PMID: 9918945; http://dx.doi.org/10.1093/bioinformatics/14.9.755
- Benson DA, Karsch-Mizrachi I, Lipman DJ, Ostell J, Sayers EW. GenBank. Nucleic Acids Res 2011; 39:D32 - D37; (Database issue) PMID: 21071399; http://dx.doi.org/10.1093/nar/gkq1079
