 ?Mathematical formulae have been encoded as MathML and are displayed in this HTML version using MathJax in order to improve their display. Uncheck the box to turn MathJax off. This feature requires Javascript. Click on a formula to zoom.
Abstract
Among cellular processes gene transcription is central. More and more evidence is mounting that transcription is tightly connected with the spatial organization of the chromosomes. Spatial proximity of genes sharing transcriptional machinery is one of the consequences of this organization. Motivated by information on the physical relationship among genes identified via chromosomal conformation capture methods, we complement the spatial organization with the idea that genes under similar transcription factor control, but possible scattered throughout the genome, might be in physically proximity to facilitate the access of their commonly used transcription factors. Unlike the transcription factory model, “interacting” genes in our “Gene Proximity Model” are not necessarily immediate physical neighbors but are in spatial proximity. Considering the stochastic nature of TF-promoter binding, this local condensation mechanism could serve as a tie to recruit co-regulated genes to guarantee the swiftness of biological reactions. We tested this idea with a simple eukaryotic organism, Saccharomyces cerevisiae. Chromosomal interaction patterns and folding behavior generated by our model re-construct those obtained from experiments. We show that the transcriptional regulatory network has a close linkage with the genome organization in budding yeast, which is fundamental and instrumental to later studies on other more complex eukaryotes.
Introduction
Gene transcription is central among all biological processes. Studies so far have indicated that transcription processes could play an architectural role and drive the genome organization.Citation1-Citation3 Transcription of a single gene is always affected by the status of other genes, directly or indirectly. All these intercorrelated relationships are built into the Transcriptional Regulatory Network (TRN).Citation4 The network consists of transcription factor (TF) coding genes and their target genes. To regulate the expression of a single gene, multiple TFs are usually recruited to form a transcription factor complex to initiate or to inhibit the transcription, while activities of multiple genes can be coordinated by the same group of TFs. Additionally, gene expressions can be controlled by internal or external stimuli.Citation5,Citation6 All these features make the transcriptional regulatory relationship a highly intermingled and complex network. This network can tune up gene activities with spatial and temporal difference in order to respond to the changing environment and to confer the organism with viability and adaptability.
In recent years, molecular biological technologies, such as ChIP-ChIP and ChIP-seq, have been increasingly productive in finding unknown TFs and their prospective targets.Citation7 Among all the model organisms, S. cerevisiae (budding yeast) is one of the most intensively studied. Numerous microarray data published by now have gradually augmented the network topology.Citation8,Citation9 Little is known about what kind of constrains the transcriptional regulatory relationship might impose on the genome physical organization.
For the correlation between the genomic function and the spatial organization of the genome, several possibilities have been put forward.Citation10-Citation12 One of ideas is the transcription induced gene co-localization.Citation11,Citation13 Transcription factories are discrete structures within the cell nucleus enriched with a transcription apparatus, like polymerases, TFs and nascent RNA splicing apparatus.Citation14 They are thought to play an architectural role in genome organization by tying up the actively expressed genes.Citation11,Citation13,Citation15 Since the number of synchronously expressed genes is far beyond that of transcription factories, multiple activated genes have to co-localize at the same expression foci. Genes occupying the same transcription factories might come from distant parts of the same chromosome or even from different chromosomes, which will induce the intra-chromosomal loops or inter-chromosomal bridges.Citation16 Transcription factories with different transcription factor components have their selectivity on genes being transcribed, but transcription of other types of genes is still possible with lower frequency.Citation17
Activated genes involved in the same biological pathway are more frequently observed at the same transcriptional foci, like globin pathway genes in mouse.Citation18 To date, an unsolved problem why some genes are more likely to meet with each other or even occupy the same transcription foci cannot be easily explained by diffusion and collision of gene loci onto transcription foci. In our view, in addition to the global TFs, gene expression regulation still needs more specific TFs for control. TFs of this kind are more stringently controlled in expression and the number of expression products is low.Citation19 Consequently, these local TFs are the key to assemble genes of specific types and could tether them closely. Intuitively, genes involved in the same pathway should be similar in their expression control profile and tend to be transcribed concurrently or even at the same transcription foci. Even though exceptions cannot be excluded, we propose that specific TFs accumulated at the expression on-going loci might recruit regulated genes close to each other more or less, which in turn will reduce their physical distances.
In various organisms, adjacent genes along the chromosome tend to show higher positive correlation in expression, when compared with random gene pairs.Citation20 As seen in this study, genes on a chromosome are prone to be organized into separated globules and genes within the same globule have comparable expression activities. However, such kind of expression correlation induced by the linear sequence proximity does not always show functional relationships among neighboring genes. This organization is not sufficient to explain significantly positive correlation found in other cases, where genes spanning large genomic distance or even on different chromosomes show strong transcriptional correlation.Citation21,Citation22 These interacting genes are more frequently proximal in space. Interactions between gene loci of this kind have shown their biological significances.Citation22
As a general rule, genome-scale studies found that target genes of many transcription factors usually spread throughout the genome, which raises the question how could transcription factors seek their binding sites on the targets spreading all over the genome. Studies on fission yeast (Schizosaccharomyces pombe) have shed light on this question. Tanizawa et al. conducted a comprehensive chromosome contact screening on fission yeastCitation23 and observed that co-regulated genes display a tendency to move toward each other once activated concurrently. More interestingly, gene loci showing higher interaction probability share a consensus sequence on their promoter regions. Accordingly, operating TFs might not disperse all over the cell nucleus, but concentrate locally to attract their target genes. In this sense, TFs can be viewed as a tie, that could tether their target genes closely. Conversely, cluster of genes under similar control could serve to draw and elevate local TFs’ concentration to make the transcription initiation more efficiently.
On the other hand, studies using chromosome conformation capture (3C) and its improved derivatives have been instrumental in investigating chromosomal contacts and chromosome higher order structures.Citation24-Citation26 With a novel method named genome conformation capture (GCC), the network of chromosome interactions for the yeast S. cerevisiae has been studied.Citation27 And more recently, in 2010 Duan et al. generated population-averaged intra-/inter-chromosomal interaction maps of budding yeast with a kilobase resolution via a 4C and massively parallel sequencing coupled method.Citation28 This study consolidated some already known features about genome organization common to most organisms. They identified some global and local features specific to budding yeast. Some large segments of a chromosome on one arm showed a tendency to interact more frequently with corresponding segment with a similar length on the other arm of the same chromosome, which forms a “zippering” structure with two chromosomal segments.Citation28 Some large segments of chromosomes also showed higher frequencies of local contacts, on the contrary other given segment pairs show very limited or no interactions. Intra-chromosomal interactions involving two telomere ends differ from one chromosome to another. Chromosome XII is spectacular in that it contains a repeated rDNA genes domain, which has 100–200 rDNA copies (1–2 Mb long).Citation29 These rDNA gene copies aggregate at the nucleolus site and function as a barrier by interrupting interactions between chromosomal segments flanking them.
Two models based on the transcription induced gene co-localization were proposed by Junier et al.Citation11 and by Dorier et al.,Citation30 respectively. These models, however, are not realistic enough to explain what we are learning from nuclei structuresCitation27,Citation28 and gene expression phenomena.Citation20,Citation22,Citation23 A more generalized looping model postulated by Bohn et al.Citation12 well explained the chromosome as a looped polymer under all scales. Especially in prokaryotes, like E. coli, transcriptional regulation did modulate the genome structure, which is clearly seen from the study conducted by Fritsche et al.Citation31 Modeling has been fruitful in addressing physical property of chromatin and genome architecture, but few efforts have been made to investigate a functional genome organization, especially for eukaryotes. And more importantly, mounting evidence indicates that genome architecture plays an important role in coordinating gene expression. Homouz et al.Citation32 have recently found in budding yeast that genes with physical contacts show significantly enhanced co-expression. When inter- or intra-chromosomal loci include function-related genes, they demonstrate significantly enriched physical contacts as well. In light of these findings, we propose a model based on the assumption that genes under highly similar transcription factor control are in spatial proximity (Gene Proximity Model). After analyzing the gene transcriptional regulatory network, we selected genes under highly similar control and treat them as being in spatial proximity within the nucleus. The nuclear structure of yeast is also taken into account. To highlight the role of gene proximity, a Null Model is constructed as a control, in which no constraint is established between presumed gene neighbors. With this model, we re-construct the genome structure of yeast and obtain compatible chromosomal interaction patterns as observed in experiments. In comparison, the “Gene Proximity Model” reconstructs much better the chromosomal interaction patterns as observed in experiments. Our results demonstrate that genome structure could be topologically constrained by gene expression and that gene expression could be reciprocally facilitated by genome structure.
Results
Neighboring genes selection
Using the method described in the Material and Methods section on the whole transcriptional regulatory network, a list of pair-wise genes’ transcription factors control similarities (TCSs) is created. By setting the minimal number of TFs operating on the respective gene of gene pairs as 2 and the TCS as 1.0 (entirely identical), we extracted a sub-network composed of 769 different genes, which gave us 1987 gene pairs with high TCSs. Among these genes, co-regulated ones were grouped as clusters. In total 485 clusters were obtained, i.e., genes that are under highly identical control. Most of the clusters consist of a small number of members, while few large clusters including up to 40 members were found. It should be noticed that some gene clusters will be topologically interrupted by the formation of others when applying gene proximity relationships to a polymer model.
Validation of the model
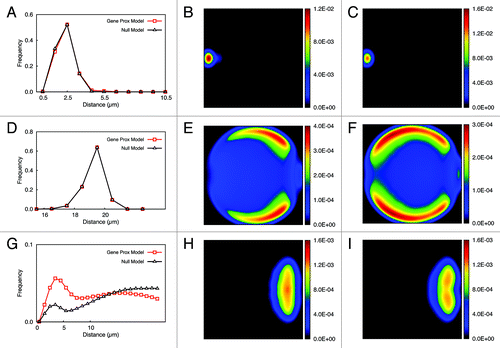
To validate our model we checked the position distributions of several genomic loci, including the centromere, the telomere and the presumed interacting gene loci. As can be seen from , the radial distributions of the centromere and the telomere loci are quite similar under either scenario (Gene Proximity Model and Null Model). While the telomeres in the Null Model were distributed peripherally, they occupied the space below the virtual nucleus membrane more uniformly compared with those in the Gene Proximity Model. Centromeres were aggregated around the spindle pole body (SPB) site in both models. For interacting gene loci, by creating bonds between genes (see Materials and Methods) that are assumed to interact their physical distances fluctuate around the mean distance set in the model with gene interaction. For the model without gene interaction, a small hump can still be observed at short scale. This might be due to short range intra-chromosomal interactions included in the interacting gene list, which are genomically close on chromosomes. By and large, in the control case, where no gene interaction was added, presumed interacting gene loci are much farther apart from each other.
Figure 1. Distribution of genomic loci in Null Model and Gene Proximity Model. Panel (A) shows the distribution of distances from the centromeres to the spindle pole body (SPB) site in the simulations with and without gene interaction. Panel (B) shows the two-dimensional projection of the position of centromeres in the simulation without gene interaction and panel (C) with gene interaction. Panel (D) shows the distribution of distances from telomeres to the SPB sites for two kinds of simulations. Panel (E) shows the two-dimensional projection of telomeres in the simulation with gene interaction and (F) shows the pattern without gene interaction. Panel (G) shows the distributions of distances between presumed interacting gene pairs for simulations with and without gene interaction. Finally panels (H) and (I) show the two-dimensional projection of rDNA genes cluster in simulations with and without gene interaction, respectively.
Comparison of single chromosome folding pattern
To study the folding of individual chromosomes, we checked genomic distances between contacting chromosome loci and their contact frequencies. For two kind of models (with and without gene interaction), we calculated genomic distances between all possible pairs on each chromosome and kept those with spatial distances below the contact threshold. From these the contact probabilities under given genomic distances were computed. Similarly, bin distances and bin pair contact frequencies were calculated for the data from the experiment.
The analysis of the data is based on ideas that come from polymer physics. If we assume that the chromosome is randomly folded like a random walk polymer (a polymer with no correlation along its contour), then the frequency with which parts come in contact is given by a power law (), where x denotes the distance between the two loci that have come in contact. The value of α characterizes the frequencies. The same holds true if we assume other polymer models, like self-avoiding walk, the globular state, fractal globular state or dynamic loop model. They differ in the exponent α. Plotting the genomic distance vs. the contact frequency on a double-logarithmical plot we can extract the exponent by fitting a straight line to the data with the slope being the α.
As shown in , the value for the slope extracted from the experimental data is around -1.5. For the Gene Proximity Model with gene pairs sharing high TCSs, we obtain a similar value for α. In contrast, for the Null Model we obtain a value of -1.34. Moreover, both for the experimental pattern and the Gene Proximity Model, a hump of higher interaction frequency can be observed extending from several hundred kb to one Mb. However, such a hump is not visible in the control model. This evident hump at larger genomic scale implies an enhanced interaction probability. Interactions between genes with short to medium genomic distances could largely decrease spatial distance between distant gene loci, as an illustration shown in , which, in turn, could enhance the contact probability between remote chromosomal loci. It be should be pointed out that in the null model, except for yeast nucleus structural features no other interaction between loci are used. Evidently, the Gene Proximity Model well explains the hump, whereas random interaction does not.
Figure 2. Power-law behavior of intra-chromosomal organization. The chromosomal contact probability is plotted double-logarithmically as a function of the genome distance. A (fitted) straight line indicates a genomic region where a power law is observed. Panels (A) shows the pattern extracted from the experimental data. Panel (B) and (C) show patterns identified from the model with or without gene interaction, respectively. In contrast to the Null Model (C), for the experimental pattern (A) and the Gene Proximity Model (B), a hump of higher interaction frequency is evident at larger genomic scale.
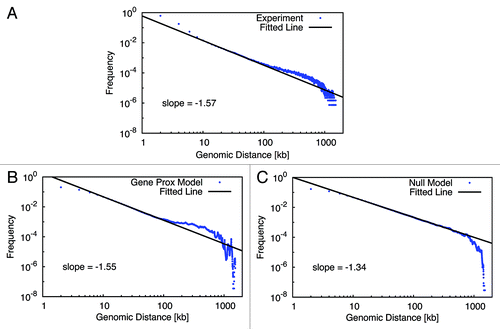
Figure 3. Gene interactions at short scale impact on genomically distant interactions. Gene interactions at short scale (red spots) can largely reduce the spatial distance between distant gene (blue spots) loci and hence increase the contact probability.

Another way of looking at the contacts within individual chromosomes is to use a heat map. In heat maps the contact frequencies among chromosome fragments are depicted color. No interaction is shown as white space. With increasing number of contact frequency the color shifts from white to a color. shows the results for the heat maps of an individual chromosome. Because interactions close to the diagonal of contact map are predominant, which means that intra-chromosomal interactions at short genomic scale are far more abundant, we only kept interaction signals between chromosome fragments with a genomic distance over 20 kb in order to focus more on the off-diagonal pattern. Since off-diagonal interaction signals on experimental contact maps are quite scattered, we used Gaussian blur to make the pattern more visible.
Figure 4. Comparison of intra-chromosomal contact patterns. Chromosome 2 is used as an example. Genomic positions along the chromosome are sized in kb. For each model, a contact pattern extracted from one possible conformation in the ensemble is shown. A raw contact pattern achieved from experiment is shown in (A). (B) for the “Gene Proximity Model” and (C) for the “Null Model”. More contact patterns can be found in the Supplementary Material.
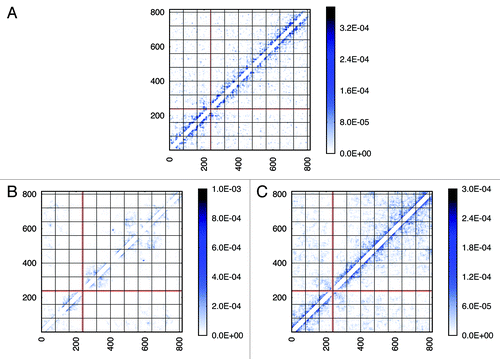
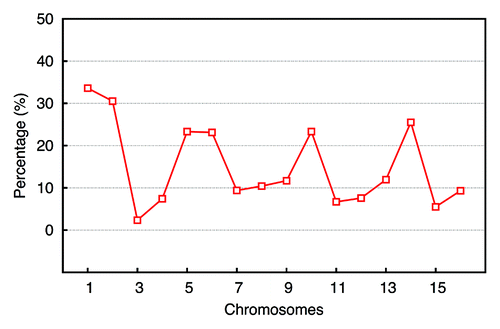
Due to the difference between the experiment and the simulation in absolute frequency numbers, the comparison of interaction patterns based on the absolute values of frequencies is difficult. As a result, a cosine similarity measurement in this case has poor discriminative power, because this method focuses on the point-to-point similarity and consequently neglects overall resemblances. Hence, we implemented a coarse-grained algorithm on the basis of eigenvalues comparison,Citation33 as described in the Material and Methods. Taking chromosome 2 as an example, raw contact maps extracted from experiment, Gene Proximity Model and Null models (see ), were filtered to picked out significant contact signals. Contact maps after being filtered (see ) were converted into normalized Laplacian matrices, whose eigenvalues were calculated. The deviation between two eigenvalue vectors were computed as a measurement of similarity. The higher the similarity is (shorter distance), the smaller the deviation between two eigenvalue vectors will be. When compared with the “Null Model,” the percentage of the distance decreased by the “Gene Proximity Model” for each chromosome is plotted, as shown in . For most chromosomes, the “Gene Proximity Model” outperforms the “Null model” by an enhancement above 10% in distance. And a 15% overall performance enhancement was achieved by the “Gene Proximity Model”. Thus, the Gene Proximity Mode captures features exhibited by the experiment much better than the random interaction.
Figure 5. Coarse-grained intra-chromosomal contact patterns. Contact patterns shown in are processed as described in the Material and Methods. After being filtered, significant interactions in contact matrices were labeled as ones and those insignificant as zeros. As a consequence, contact matrices were converted into coarse-grained adjacency matrices shown here. Pattern (A) from the experiment, pattern (B) from the “Gene Proximity Model” and pattern (C) from the “Null Model”. More contact patterns can be found in the Supplementary Material.
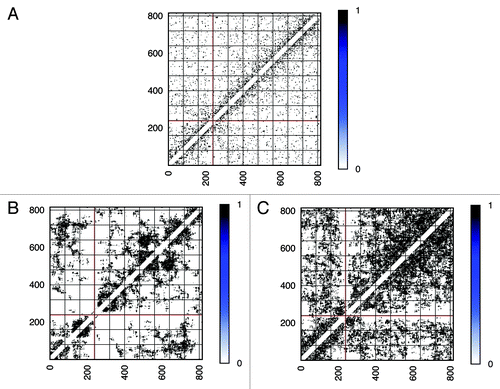
Figure 6. Similarity measurement via eigenvalues. For each chromosome, the deviations between the eigenvalues of patterns from individual model and that of the experimental pattern were compared. Smaller deviation implies higher similarity. The performance difference of individual model was computed by the formula (dN - dG)/dN, where d means the deviation between two eigenvalue vectors. The subscript N denotes the “Null Model” and the subscript G denotes the “Gene Proximity Model”. The overall performance enhancement achieved by the “Gene Proximity Model” is around 15%.
Comparison of inter-chromosomal contact pattern
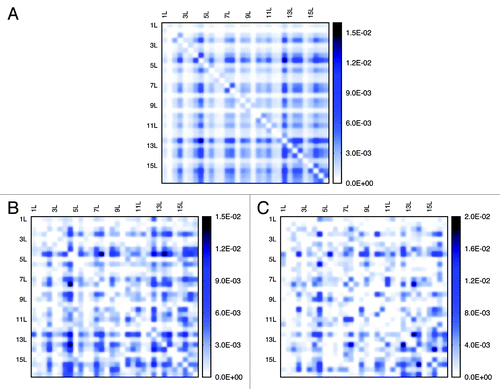
By calculating interaction numbers for any two given chromosomes, we can generate inter-chromosomal contact patterns (a 16 by 16 matrix) as heat maps (see ). Similarly, considering the existence of the centromere on every chromosome, we can view a single chromosome as two arms connected by the centromere site. By doing so, we can generate heat maps for arm-interaction (matrix dimension 32 by 32), as shown in . The interaction probability between two given chromosomes or arms are proportional to the color density.
Figure 7. Inter-chromosomal interaction patterns identified from the experiment and models. Patterns (A) is extracted from the experiment, (B) from the “Gene Proximity Model” and (C) from the “Null Model”. Pairwise interaction frequencies between two chromosomes are proportional to the color density. (B) and (C) respectively represent one possible inter-chromosomal interaction patterns for two different models.
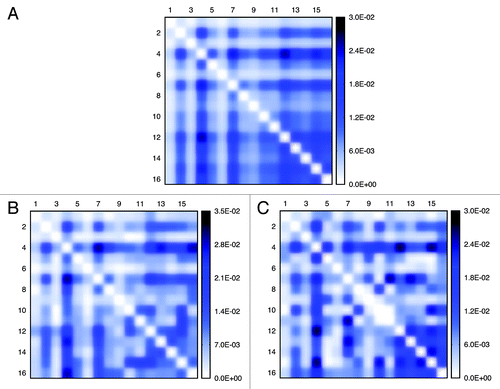
Figure 8. Patterns of chromosomal arm interaction identified from the experiment and models. Patterns (A) are extracted from the experiment, (B) from the “Gene Proximity Model” and (C) from the “Null Model”. (B) and (C) respectively represent one possible arm interaction patterns for two different models.
Using the cosine similarity measurement,Citation34 we evaluated the resemblance of contact patterns achieved from simulation and from experiment, for inter-chromosomal interaction and arm interaction, respectively. As we can see from and , by integrating gene-gene interactions in the model, we get a better resemblance, especially for inter-chromosomal interaction. Also, the similarity fluctuation of the Gene Proximity Model is much smaller than that of the Null Model. This observation underpins the assumption that specific gene interactions play a role in spatial genome organization. In addition, the characteristics of the contact matrices can also be measured by their eigenvalues. Since the dimensions of inter-chromosomal or arm contact matrices are small, a comparison of eigenvalues computed directly from the contact matrices is feasible (see ). We find that the Gene Proximity Model gives eigenvalues more close to the experiment than the Null Model. We also calculated the averaged distances between eigenvalues of contact matrices obtained from the model, random interactions and experiments. The results listed in indicate that eigenvalues of the contact matrix obtained from the interaction model are more close to the experimental pattern than the control model.
Figure 9. Similarity measurement of inter-chromosomal interaction patterns identified from the models and experiment. The red line indicates the similarity between random interaction pattern and the pattern extracted from the experimental data. Left candlestick shows the similarity between the Gene Proximity Model and the experiment. The right one indicates the result for the Null Model.
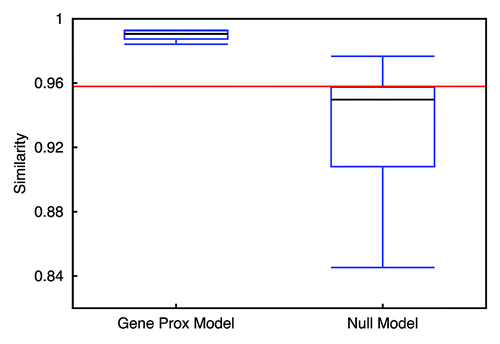
Figure 10. Similarity measurement of chromosomal arm interaction patterns identified from the models and experiment. The red line indicates the similarity between random interaction pattern and the pattern extracted from the experimental data. The left candlestick shows the similarity between the Gene Proximity Model and the experiment. The right one indicates the result for the Null Model.
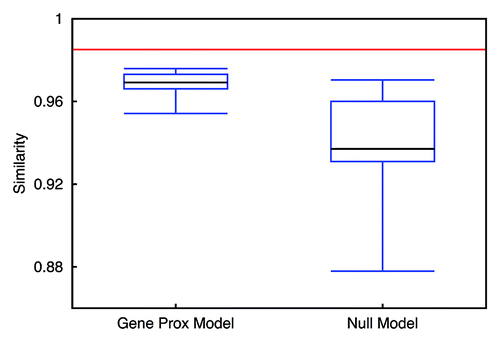
Figure 11. Comparison of eigenvalues of contact matrices. The characteristics of contact matrices seen from and can be mathematically depicted by computing their eigenvalues. We used the eigenvalue comparison as a measurement of contact pattern similarity. The higher the similarity between two patterns, the closer two eigenvalue curves will stay. (A) for inter-chromosomal contact pattern and (B) for arm interaction pattern.
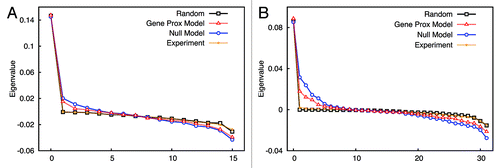
Table 1. Average distances between eigenvalues computed for the Gene Proximity Model, Null Model, random interaction and experiment
Discussion
The interplay between function and structure is becoming more and more apparent for chromosomes. Mechanisms, like transcription induced gene co-localization, have been postulated to explain how specific physical chromosome interactions can be induced. Improved chromosomal contact screening technology gives us more insight into the nature of the neighboring genes. Inspired by recently published findings that genes sharing highly homologs control sequences at their promoter regions will move toward each other and have higher interaction probabilities once activated,Citation28 we propose here a genome organization model for budding yeast (Gene Proximity Model). The model emphasizes the role of gene transcriptional regulatory profile. We propose that the aggregation of specific TFs within the nucleus might function as a recruiter to draw their target genes close in space and probably to nearby transcription factories for coordinated expression. Our results show that our model does work to some extent. When constraints between presumed neighboring genes are removed, chromosomal contact patterns disclosed are less similar to the experimental observation. The model is able to explain some genome organization features of budding yeast. Admittedly, not all of the structural features from the experiment can be reconstructed, especially for interaction pattern at higher resolution.
At present, our model focuses only on the population-averaged chromosome behavior (which is also true for chromosomal conformation capture results available so far). This attribute largely limits the power of chromosomal contact screening technology in discovering cell-to-cell variable genome architectures. Cells could stay in the same cell cycles, but take different genome organizations in different subpopulations. Since chromatin contacts are sampled and averaged over a huge number of cells, significant but possibly mutually exclusive contacts would be merged on the same contact map. In addition, contacts only occurring in a small cell population might not be distinguishable from noises. It’s also possible that cells under undesired cell cycles would give rise to noises, if cell samples are not well synchronised. Once advance in technology could enhance signal-to-noise ratio, or a single-cell based approach will be developed, contact map with better quality will shed more light on the genome architecture.
In the scope of our model, interacting genes can be assumed active or inactive depending on the distance among them. In reality, activation of some genes are mutually exclusive, and unlike house-keeping genes, expression transducible genes can be periodically expressed along the cell-cycle.Citation35 Furthermore studies show that cell cycle transcriptional factors activated in one cell cycle stage could regulate those activated in the next cell cycle stepCitation36 in a cyclic way. All of these factors make the genome conformation cell cycle and status specific. The model could take thus into account according to the time-resolved expression data to see the genome rearrangement along the cell cycle. However, so far we are lacking time-resolved conformation capture data.
Materials and Methods
Neighboring genes selection
The transcriptional regulatory network of budding yeast was adapted from the study of Balaji et al.Citation9 They reconstructed a regulatory network consisting of 157 transcription factors and 4,410 target genes involving 12,873 regulatory interactions in total. We determined transcription factors control similarities (TCSs), a notation proposed by Batada et al.Citation37 between all possible genes pairs involved in this network. For a given gene pair its TCS is defined as one minus the ratio between the number of transcription factors regulating only one of two target genes and the total number of regulatory interactions. For instance, Gene I is regulated by TFs A, B and C, while Gene II is regulated by TFs B, C, D and F. Their TCS is calculated as: 1 – (1 + 2)/(3 + 4) = 4/7. We assume gene pairs with high TCS as spatial neighbors in the nucleus. To make a small, robust and reliable neighboring list, neighboring genes are selected as those being co-regulated by a set of identical TFs, which means that their TCSs are 1.0. And the minimal number of common TFs for each group of neighboring genes are set as two. By doing so, we cluster genes spatially according to their transcription regulatory control profiles.
Modeling and simulation
To test our idea, we selected S. cerevisiae, one of the most thoroughly studied species, either on its genome sequences or more importantly on its transcriptional regulatory control profile. The genome information of budding yeast is shown in . The nucleus of budding yeast is covered with a nuclear envelope and has a radius of approximately one micrometre. In the interface cell, its genome takes a Rabl configuration,Citation38,Citation39 in which centromeres are attached via protein fibers to the spindle pole body (SPB), a structure inserted into the nuclear envelope. Telomeres are positioned close to the nuclear envelope.Citation40 Such a conformation makes the chromatin within centromeres or telomeres less flexible than in other parts (). Another distinguishable structural feature inside the budding yeast nucleus is the nucleolus, where amplified in tandem rRNA (rDNA) genes on chromosome XII form a cluster sitting opposite to the pole of the spindle pole body (SPB) next to the nuclear envelop.Citation41,Citation42 These intensively duplicated genes are vital house-keeping genes. While a large proportion of them are always kept silent, they are indispensable to DNA repairing by homologous recombination and to nucleus structure maintenance.Citation43
Figure 12. Genome structure of S. cerevisiae. The haploid genome of S. cerevisiae includes 16 euchromosomes and an extra mitochondria chromosome (not shown here). Scales on each chromosome indicate its length (unit in kb). On each chromosome “C” indicates the position of its centromere in the form of its affixed chromosome name.
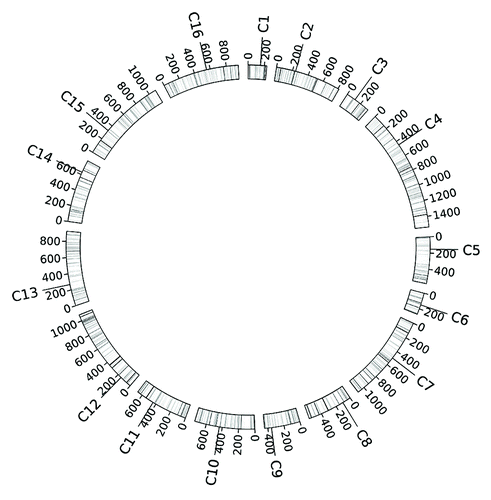
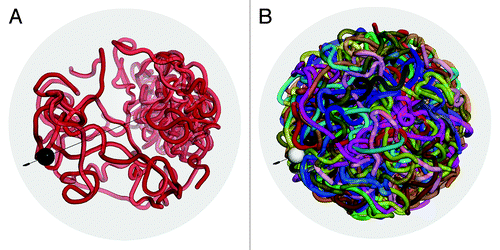
Figure 13. Modeling structural features of yeast nucleus. Figure (A) shows a conformation of chromosome 12, where bulk rDNA genes clustered on the pole opposite to the SPB. Small black spheres represent the structure spindle pole body (SPB) where centromeres assemble. The surrounding transparent gray sphere defines a confining surface corresponding to the nucleus member. The black line indicates the axle extending from the SPB to the rDNA genes cluster. Harmonic bonds are employed to congregate centromeres and rDNA genes and to drive telomeres to the periphery of the confining sphere. Figure (B) shows a snapshot of genome conformation with 16 chromosomes included. White sphere represents the SPB focus.
All molecular dynamics simulations were performed with ESPResSo software package.Citation44 A chromosome was simplified as a fragment of a polymer composed of homogenous monomers with excluded volumeCitation45 and bonded via a FENE potential.Citation46 The Weeks-Chandler-Andersen (WCA) potentialCitation47 (a special case of Lennard-Jones potentialCitation48) was applied for the non-bonded interaction. The attractive part of the interaction between particles was turned off. More explanation about the potentials can be found in the Supplementary Material. Due to the large scale genomic studies conducted on the budding yeast its gene profile has largely been clarified. This makes simulations with high resolution possible. To make the simulation computationally affordable we constructed coarse-grained polymers. For all of 16 chromosomes in budding yeast, for every 2 kb a monomer is set. Assumed gene neighbors were mapped onto coarse-grained polymers by taking the gene’s middle position for simplicity. The genome information was taken from the Ensembl genome database of budding yeast (saccharomyces_cerevisiae_core_58_1j).Citation49 Also, to mimic the duplicated rDNA gene cluster on chromosome XII, we inserted a patch of a 1,500 kb long polymer (corresponding to 750 monomers) into the position 450 kb far away from the left end of chromosome XII. All these constructions gave a system containing 6,800 monomers. A typical monomer volume fraction of 0.15 was used,Citation10 from which the radius of a simulated nucleus sphere was calculated. To construct the SPB structure, we set up an extra particle on the surface of sphere and deemed it as one pole. Genomic positions of centromeres were taken from the Saccharomyces Genome Database (SGD). Harmonic bonds between virtual centromere on each polymer and the particles that function as SPB were assigned. To simulate the rDNA cluster, we put another particle at the pole opposite to the SPB and on the surface of the confining sphere, which corresponds to the nucleolus site. Multiple harmonic bonds were used to connect the inserted rDNA polymer with the nucleolus particle. Telomeres have been shown to prefer localizations at the peripheral region of the nucleus. Thus, harmonic bonds were created between both ends of each polymer and the center point of confining sphere, which will push polymer ends outwards to sit close to the virtual nuclear membrane.
Initially the 16 polymers were randomly distributed. A spherical confinement was defined by a Lennard-Jones potential between all the particles and the constraint surface to mimic the nuclear envelope. Depending on the particle density at the beginning of the simulation and the initial arrangement of the chains, the radius of the confining sphere was about 30 times larger than the final radius with monomer occupancy of 15%. At the first stage of the simulation, the large constraint sphere was slowly shrunk between every integration cycle. When the radius of the sphere reached its expected value, the telomere interactions and rDNA interactions were created. To speed up the equilibration, the parameters of FENE potential was selected so as to make the back-bone extensible and allow chains to pass through each other. Also, the Lennard-Jones potential was capped and increased gradually to get rid of the overlapping of particles and to facilitate the equilibrium. The simulation ran continually until various energies, the end-to-end distance and the radius of gyration kept stabilized. To evaluate the role of specific gene-gene interaction, we constructed specific control simulations where no gene-gene interaction was included. To get an ensemble of genome conformations, we ran 10 independent simulations with totally different initial polymer arrangement both for the control simulations and for non-control simulations. More detailed information about parameters of bonded and none-bonded interactions used in the simulation can be found at .
Table 2. Parameter List. A length scale of μm is used
Experimental data
Chromosomal contact data was kindly provided by Justin M O’Sullivan, who performed a genome-wide screening of chromosome physical interactions in S. cerevisiae.Citation50 In brief, chromosomal contacts in yeast nuclei are chemically fixed and digested with restriction enzyme. Ligated chromosome fragment pairs are sequenced before genome mapping. Those ambiguously mapped fragments are filtered out. The rest of the fragments, which can be uniquely mapped onto the genome, are used to construct chromosomal contact map. Chromosomal contacts are grouped with genomic bins 2 kb sized. Each chromosome is divided into a series of equally long segments (except the last segment on chromosome tail) and chromosomal contacts are assigned into involved segment pairs. For the last segment of each chromosome, which is usually less than 2kb long, it is treated as an individual and integrate segment. Since a fragment could possibly spanning several genomic bins, a proportional assignment method is used by assigning interactions to a bin based on the ratio of its overlapped length with the fragment to the full length of that fragment, as indicated in .
Inter-chromosomal interactions analysis
The inter-chromosomal interaction maps of any two given chromosomes were obtained by determining those pairs of monomers having a distance below a given threshold 2.5 μm. If the centromere sites were taken into consideration, a chromosome can be treated as two chains connected by a hinge (the centromere site) and an arm-based interaction map was generated. To construct individual ensemble of genome conformations for two different models (the Gene Proximity Model and the Null Model), equal numbers of conformations (1,000) were randomly sampled from each simulation of respective models. For both models, an ensemble of 10,000 conformations was created. Next, for each time, 100 conformations were randomly selected from respective ensemble as a sample of genome organization. After averaging each specimen of conformations, contact patterns (100 patterns for each model) achieved were used as snapshots of genome organizations on a population-averaged basis.
For the inter-chromosome or arm interactions, we constructed respective random interaction matrix based on lengths of two given interacting chromosomes or arms by assuming that they are arbitrarily arranged in the cell nucleus. To estimate the similarity between contact patterns, we used the cosine similarity measurement, which calculates the cosine of the angle between two vectors. Here a matrix is interpreted as an N × N vector, where N is the number of chromosomes or arms. The more the resulting cosine value approaches to 1, the higher the similarity is. For different models, the similarities between averaged contact patterns and the pattern from the experiment were calculated and plotted as a candlestick chart for comparison.
Another measure uses the eigenvalues of the contact matrix. These are invariant under unitary transformations and thus should provide information on the similarity irrespective of the absolute values of the matrix (a problem with the cosine similarity measure). Eigenvalues of normalized contact matrices from the experiment, models, random interaction were computed and plotted for comparison. Distance between any two eigenvalue vectors was calculated as well.
Intra-chromosomal interactions analysis
At first, genomic distances between interacting loci and their interaction frequencies were calculated. To determine their mathematical relationship the data was plotted on a double-logarithmic. Any straight line behavior indicates a power law relationship ().
Similar to the measurement of inter-chromosomal interactions, contact matrices of individual chromosomes were created. Interacting monomers on each chromosome were determined by a distance cutoff. From the ensembles of genome conformations constructed as mentioned above, contact frequencies of all possible monomer pairs on individual chromosomes were organized as matrices. To emphasize medium- and long-range intra-chromosomal interactions, interactions with a genomic distance smaller than 20 kb were eliminated, which is predominantly displayed on contact maps. The resting off-diagonal elements on contact maps correspond to monomers pairs separated at least by 10 monomers. Considering the absolute contact counts between the experiment and the simulation, comparison of contact patterns based on the absolute values of interaction frequencies is not easy. Consequently, an eigenvalues-based algorithm was implemented to compute the similarities between coarse-grained contact patterns. At first, we picked out significant contacts from each intra-chromosomal interaction map. Due to the Rabl configurationCitation38,Citation39 associated with budding yeast genome, two arms of each chromosome are hinged by the centromere locus. Therefore, for the left and right arms of a chromosome, we separately calculated their average and standard deviation of contact frequencies under a given monomer distance. Likewise, interaction frequencies between two arms were treated independently. Therefore, the calculation of the average interaction frequency under a given monomer distance can be formulated as:
where i and j represent monomers’ sequential numbers and f(i, j) indicates the contact frequency between ith and jth monomers. The symbol N equals to the number of all possible monomer pairs, whose monomer distances equal to d. Contacting monomer pairs with a frequency above the average value for a given monomer distance were kept. After filtering, the contact matrices were converted into unweighted adjacency matrices (A) with their non-zero elements being weighted as one, which means if the interaction frequency between any two possible sites exceeds the threshold, these two sites are simply considered as being contacted. Then, the Laplacian matrix of each adjacency matrix was computed via L = D - A, where D represents the diagonal matrix of degrees of an adjacency matrix A. Laplacian matrices were further normalized by
The similarity between modeling and experimental contact graphs was defined by calculating the deviation between eigenvalues of respective normalized Laplacian matrices for each chromosome:
where subscript G, N and E represent the Gene Proximity Model, the Null Model and the Experiment. Symbol D is the dimension of two compared Laplacians matrices and symbol λ corresponds to the eigenvalue vector of Laplacian matrices of different patterns. The closer to zero the d value is, the more similar the two graphs are.
For each chromosome, performance difference between two models is evaluated by comparing corresponding dG and dN calculated in Equation 3,
| Abbreviations: | ||
| TRN | = | transcriptional regulatory network |
| TF | = | transcription factor |
| TCSs | = | transcription factors control similarities |
| 3C | = | chromosome conformation capture |
| GCC | = | genome conformation capture |
| SPB | = | spindle pole body |
Additional material
Download Zip (13.6 MB)Acknowledgments
The authors appreciate here the assistance from Justin M O’Sullivan for kindly providing experimental data and the resources from the Heidelberg Graduate School of Mathematical and Computational Methods for the Sciences (HGSMathComp). SL gratefully acknowledges funding from the Heinz-Goetze-Foundation and the Heidelberg Graduate School of Mathematical and Computational Methods for the Sciences.
Disclosure of Potential Conflicts of Interest
No potential conflict of interest was disclosed.
References
- Lanctôt C, Cheutin T, Cremer M, Cavalli G, Cremer T. Dynamic genome architecture in the nuclear space: regulation of gene expression in three dimensions. Nat Rev Genet 2007; 8:104 - 15; http://dx.doi.org/10.1038/nrg2041; PMID: 17230197
- Fedorova E, Zink D. Nuclear architecture and gene regulation. Biochim Biophys Acta 2008; 1783:2174 - 84; http://dx.doi.org/10.1016/j.bbamcr.2008.07.018; PMID: 18718493
- Dong X, Li C, Chen Y, Ding G, Li Y. Human transcriptional interactome of chromatin contribute to gene co-expression. BMC Genomics 2010; 11:704; http://dx.doi.org/10.1186/1471-2164-11-704; PMID: 21156067
- Davidson E, Levin M. Gene regulatory networks. Proc Natl Acad Sci U S A 2005; 102:4935; http://dx.doi.org/10.1073/pnas.0502024102; PMID: 15809445
- Estruch F. Stress-controlled transcription factors, stress-induced genes and stress tolerance in budding yeast. FEMS Microbiol Rev 2000; 24:469 - 86; http://dx.doi.org/10.1111/j.1574-6976.2000.tb00551.x; PMID: 10978547
- Smith EN, Kruglyak L. Gene-environment interaction in yeast gene expression. PLoS Biol 2008; 6:e83; http://dx.doi.org/10.1371/journal.pbio.0060083; PMID: 18416601
- Qin J, Li MJ, Wang P, Zhang MQ, Wang J. ChIP-Array: combinatory analysis of ChIP-seq/chip and microarray gene expression data to discover direct/indirect targets of a transcription factor. Nucleic Acids Res 2011; 39:Web Server issue W430-6; http://dx.doi.org/10.1093/nar/gkr332; PMID: 21586587
- Lee TI, Rinaldi NJ, Robert F, Odom DT, Bar-Joseph Z, Gerber GK, et al. Transcriptional regulatory networks in Saccharomyces cerevisiae. Science 2002; 298:799 - 804; http://dx.doi.org/10.1126/science.1075090; PMID: 12399584
- Balaji S, Babu MM, Iyer LM, Luscombe NM, Aravind L. Comprehensive analysis of combinatorial regulation using the transcriptional regulatory network of yeast. J Mol Biol 2006; 360:213 - 27; http://dx.doi.org/10.1016/j.jmb.2006.04.029; PMID: 16762362
- de Nooijer S, Wellink J, Mulder B, Bisseling T. Non-specific interactions are sufficient to explain the position of heterochromatic chromocenters and nucleoli in interphase nuclei. Nucleic Acids Res 2009; 37:3558 - 68; http://dx.doi.org/10.1093/nar/gkp219; PMID: 19359359
- Junier I, Martin O, Képès F. Spatial and topological organization of DNA chains induced by gene co-localization. PLoS Comput Biol 2010; 6:e1000678; http://dx.doi.org/10.1371/journal.pcbi.1000678; PMID: 20169181
- Bohn M, Heermann DW. Topological interactions between ring polymers: Implications for chromatin loops. J Chem Phys 2010; 132:044904; http://dx.doi.org/10.1063/1.3302812; PMID: 20113063
- Chuang CH, Belmont AS. Close encounters between active genes in the nucleus. Genome Biol 2005; 6:237; http://dx.doi.org/10.1186/gb-2005-6-11-237; PMID: 16277755
- Carter DR, Eskiw C, Cook PR. Transcription factories. Biochem Soc Trans 2008; 36:585 - 9; http://dx.doi.org/10.1042/BST0360585; PMID: 18631121
- Sutherland H, Bickmore WA. Transcription factories: gene expression in unions?. Nat Rev Genet 2009; 10:457 - 66; http://dx.doi.org/10.1038/nrg2592; PMID: 19506577
- Carter DR, Eskiw C, Cook PR. Transcription factories. Biochem Soc Trans 2008; 36:585 - 9; http://dx.doi.org/10.1042/BST0360585; PMID: 18631121
- Xu M, Cook PR. Similar active genes cluster in specialized transcription factories. J Cell Biol 2008; 181:615 - 23; http://dx.doi.org/10.1083/jcb.200710053; PMID: 18490511
- Xu M, Cook PR. Similar active genes cluster in specialized transcription factories. J Cell Biol 2008; 181:615 - 23; http://dx.doi.org/10.1083/jcb.200710053; PMID: 18490511
- Janga SC, Salgado H, Martínez-Antonio A. Transcriptional regulation shapes the organization of genes on bacterial chromosomes. Nucleic Acids Res 2009; 37:3680 - 8; http://dx.doi.org/10.1093/nar/gkp231; PMID: 19372274
- Gierman HJ, Indemans MH, Koster J, Goetze S, Seppen J, Geerts D, et al. Domain-wide regulation of gene expression in the human genome. Genome Res 2007; 17:1286 - 95; http://dx.doi.org/10.1101/gr.6276007; PMID: 17693573
- Jeong KS, Ahn J, Khodursky AB. Spatial patterns of transcriptional activity in the chromosome of Escherichia coli. Genome Biol 2004; 5:R86; http://dx.doi.org/10.1186/gb-2004-5-11-r86; PMID: 15535862
- Osborne CS, Chakalova L, Brown KE, Carter D, Horton A, Debrand E, et al. Active genes dynamically colocalize to shared sites of ongoing transcription. Nat Genet 2004; 36:1065 - 71; http://dx.doi.org/10.1038/ng1423; PMID: 15361872
- Tanizawa H, Iwasaki O, Tanaka A, Capizzi JR, Wickramasinghe P, Lee M, et al. Mapping of long-range associations throughout the fission yeast genome reveals global genome organization linked to transcriptional regulation. Nucleic Acids Res 2010; 38:8164 - 77; http://dx.doi.org/10.1093/nar/gkq955; PMID: 21030438
- Cope NF, Fraser P. Chromosome conformation capture. Cold Spring Harb Protoc 2009; 2009:t5137; http://dx.doi.org/10.1101/pdb.prot5137; PMID: 20147067
- Gavrilov A, Eivazova E, Priozhkova I, Lipinski M, Razin S, Vassetzky Y. Chromosome conformation capture (from 3C to 5C) and its ChIP-based modification. Methods Mol Biol 2009; 567:171 - 88; http://dx.doi.org/10.1007/978-1-60327-414-2_12; PMID: 19588093
- van Berkum NL, Lieberman-Aiden E, Williams L, Imakaev M, Gnirke A, Mirny LA, et al. Hi-C: a method to study the three-dimensional architecture of genomes. J Vis Exp 2010; 39:1 - 7; PMID: 20461051
- Rodley CD, Bertels F, Jones B, O’Sullivan JM. Global identification of yeast chromosome interactions using Genome conformation capture. Fungal Genet Biol 2009; 46:879 - 86; http://dx.doi.org/10.1016/j.fgb.2009.07.006; PMID: 19628047
- Duan Z, Andronescu M, Schutz K, McIlwain S, Kim YJ, Lee C, et al. A three-dimensional model of the yeast genome. Nature 2010; 465:363 - 7; http://dx.doi.org/10.1038/nature08973; PMID: 20436457
- Venema J, Tollervey D. Ribosome synthesis in Saccharomyces cerevisiae. Annu Rev Genet 1999; 33:261 - 311; http://dx.doi.org/10.1146/annurev.genet.33.1.261; PMID: 10690410
- Dorier J, Stasiak A. The role of transcription factories-mediated interchromosomal contacts in the organization of nuclear architecture. Nucleic Acids Res 2010; 38:7410 - 21; http://dx.doi.org/10.1093/nar/gkq666; PMID: 20675721
- Fritsche M, Li S, Heermann DW, Wiggins PA. A model for Escherichia coli chromosome packaging supports transcription factor-induced DNA domain formation. Nucleic Acids Res 2012; 40:972 - 80; http://dx.doi.org/10.1093/nar/gkr779; PMID: 21976727
- Homouz D, Kudlicki AS. The 3D organization of the yeast genome correlates with co-expression and reflects functional relations between genes. PLoS One 2013; 8:e54699; http://dx.doi.org/10.1371/journal.pone.0054699; PMID: 23382942
- Watts DJ. Small worlds: the dynamics of networks between order and randomness 1999; volume 19. Princeton University Press.
- Tan PN, Steinbach M, Kumar V. Introduction to data mining 2006; Boston: Pearson Addison Wesley, 1st edition, xxi, 769 pp.
- Rustici G, Mata J, Kivinen K, Lió P, Penkett CJ, Burns G, et al. Periodic gene expression program of the fission yeast cell cycle. Nat Genet 2004; 36:809 - 17; http://dx.doi.org/10.1038/ng1377; PMID: 15195092
- Simon I, Barnett J, Hannett N, Harbison CT, Rinaldi NJ, Volkert TL, et al. Serial regulation of transcriptional regulators in the yeast cell cycle. Cell 2001; 106:697 - 708; http://dx.doi.org/10.1016/S0092-8674(01)00494-9; PMID: 11572776
- Batada NN, Urrutia AO, Hurst LD. Chromatin remodelling is a major source of coexpression of linked genes in yeast. Trends Genet 2007; 23:480 - 4; http://dx.doi.org/10.1016/j.tig.2007.08.003; PMID: 17822800
- Bystricky K, Laroche T, van Houwe G, Blaszczyk M, Gasser SM. Chromosome looping in yeast: telomere pairing and coordinated movement reflect anchoring efficiency and territorial organization. J Cell Biol 2005; 168:375 - 87; http://dx.doi.org/10.1083/jcb.200409091; PMID: 15684028
- Schober H, Kalck V, Vega-Palas MA, Van Houwe G, Sage D, Unser M, et al. Controlled exchange of chromosomal arms reveals principles driving telomere interactions in yeast. Genome Res 2008; 18:261 - 71; http://dx.doi.org/10.1101/gr.6687808; PMID: 18096749
- Heun P, Laroche T, Shimada K, Furrer P, Gasser SM. Chromosome dynamics in the yeast interphase nucleus. Science 2001; 294:2181 - 6; http://dx.doi.org/10.1126/science.1065366; PMID: 11739961
- Thompson M, Haeusler RA, Good PD, Engelke DR. Nucleolar clustering of dispersed tRNA genes. Science 2003; 302:1399 - 401; http://dx.doi.org/10.1126/science.1089814; PMID: 14631041
- Haeusler RA, Pratt-Hyatt M, Good PD, Gipson TA, Engelke DR. Clustering of yeast tRNA genes is mediated by specific association of condensin with tRNA gene transcription complexes. Genes Dev 2008; 22:2204 - 14; http://dx.doi.org/10.1101/gad.1675908; PMID: 18708579
- Ide S, Miyazaki T, Maki H, Kobayashi T. Abundance of ribosomal RNA gene copies maintains genome integrity. Science 2010; 327:693 - 6; http://dx.doi.org/10.1126/science.1179044; PMID: 20133573
- Limbach HJ, Arnold A, Mann B, Holm C. Espresso–an extensible simulation package for research on soft matter systems. Comput Phys Commun 2006; 174:704 - 27; http://dx.doi.org/10.1016/j.cpc.2005.10.005
- Hill TL. An introduction to statistical thermodynamics 1986; New York: Dover Publications, xiv, 508 pp.
- Warner HR. Kinetic theory and rheology of dilute suspensions of finitely extendible dumbbells. Ind Eng Chem Fundam 1972; 11:37987; http://dx.doi.org/10.1021/i160043a017
- Weeks JD, Chandler D, Andersen HC. Role of repulsive forces in determining the equilibrium structure of simple liquids. J Chem Phys 1971; 54:5237 - 48; http://dx.doi.org/10.1063/1.1674820
- Jones JE. On the determination of molecular fields. ii. from the equation of state of a gas. Proc R Soc Lond, A Contain Pap Math Phys Character 1924; 106:463 - 77; http://dx.doi.org/10.1098/rspa.1924.0082
- The ensembl budding yeast genome database. ftp://ftp.ensembl.org/pub/release-58/mysql/ saccharomyces_cerevisiae_core_58_1j/.
- Gehlen LR, Gruenert G, Jones MB, Rodley CD, Langowski J, O’Sullivan JM. Chromosome positioning and the clustering of functionally related loci in yeast is driven by chromosomal interactions. Nucleus 2012; 3:370 - 83; http://dx.doi.org/10.4161/nucl.20971; PMID: 22688649
