Abstract
Interleukin (IL)-10 is a major cancer-related immunosuppressive factor, exhibiting a unique ability to hamper the maturation of dendritic cells (DCs). We have previously reported that IL-10 induces the conversion of activated, migratory CD1a+ DCs found in the human skin to CD14+CD141+ macrophage-like cells. Here, as a model of tumor-conditioned DC maturation, we functionally assessed CD14- and CD14+ DCs that matured in vitro upon exposure to IL-10. IL-10-induced CD14+ DCs were phenotypically characterized by a low maturation state as well as by high levels of BDCA3 and DC-SIGN, and as such they closely resembled CD14+ cells infiltrating melanoma metastases. Compared with DC matured under standard conditions, CD14+ DCs were found to express high levels of B7-H1 on the cell surface, to secrete low levels of IL-12p70, to preferentially induce TH2 cells, to have a lower allogeneic TH cell and tumor antigen-specific CD8+ T-cell priming capacity and to induce proliferative T-cell anergy. In contrast to their CD14+ counterparts, CD14- monocyte-derived DCs retained allogeneic TH priming capacity but induced a functionally anergic state as they completely abolished the release of effector cytokines. Transcriptional and cytokine release profiling studies indicated a more profound angiogenic and pro-invasive signature of CD14+ DCs as compared with DCs matured in standard conditions or CD14− DCs matured in the presence of IL-10. Importantly, signal transducer and activator of transcription 3 (STAT3) depletion by RNA interference prevented the development of the IL-10-associated CD14+ phenotype, allowing for normal DC maturation and providing a potential means of therapeutic intervention.
Introduction
Dendritic cells (DCs) are professional antigen-presenting cells (APCs) that are unique in their ability to initiate and maintain primary immune responses. Immature DCs (iDCs) can efficiently capture and process antigens and—upon activation—migrate to draining lymph nodes, where they can present processed antigens to naïve T cells and hence induce primary T-cell and B-cell responses. As neoplastic cells frequently produce mutated proteins that can serve as targetable tumor-associated antigens (TAAs),Citation1 DCs should be capable of raising a TAA-specific immune response that may lead to tumor eradication. Unfortunately, the differentiation and activation of DCs is hampered within the tumor microenvironment, leading to an accumulation of iDCs.Citation2 Thus, even in the presence of appropriate danger signals, DCs often do not function efficiently in cancer patients owing to a pronounced immunosuppression that is mediated by high levels of tumor-derived soluble factors, de facto promoting T-cell tolerance or anergy rather than activation.Citation2 In addition, tumor-derived factors can promote the accumulation of myeloid-derived suppressor cells (MDSCs), a rather heterogeneous population of myeloid cells at early stages of differentiation that exert potent immunosuppressive functions. MDSCs can indeed suppress T-cell proliferation in vitro and can stimulate the development of regulatory T cells (Tregs) in vivo.Citation3
Interleukin (IL)-10 is secreted at high levels by tumors of many different origins,Citation4,Citation5 in particular by progressive and metastatic melanoma lesions.Citation6 IL-10 is a potent regulator of DC maturation and DC effector functions, as it can downregulate the expression of co-stimulatory molecules and the secretion of pro-inflammatory cytokines including IL-12 and tumor necrosis factor α (TNFα).Citation7-Citation10 IL-10 has the unique ability to inhibit DC maturation and differentiation.Citation7,Citation9-Citation12 In line with this notion, increased IL-10 levels in the serum of cancer patients correlate with an increased frequency of circulating DC precursors.Citation13 Although IL-10 efficiently blocks phenotypic DC maturation and the ability of mature DCs (mDCs) to prime T cells, IL-10-conditioned mDCs may still be able to migrate to lymph nodes, resulting in the induction of T-cell tolerance.Citation14 Velten et al. have described the development of a population of monocyte-like cells during the maturation of monocyte-derived DCs (MoDCs) exposed to IL-10 in vitro, which re-expressed CD14 on the cell surface. Interestingly, these CD14+ cells (but not monocytes and iDCs) also express thrombomodulin (best known as CD141 or BDCA3), a protein that is important for antigen cross-presentation.Citation15-Citation18 We have previously demonstrated that DCs exhibiting the same phenotype (CD14+BDCA3+) migrate from the human skin upon the intradermal delivery of IL-10.Citation19 These macrophage-like cells display a poor T-cell stimulatory ability, in agreement with the T-cell inhibitory characteristics of BDCA3+ MoDC-derived cells described by Velten et al.Citation18 These data suggest that IL-10 is able to convert DCs into macrophage-like cells with poor T-cell stimulatory abilities. This was recently confirmed in a mouse model, showing that fully differentiated DCs can adopt a regulatory macrophage-like phenotype, a phenomenon that commonly occurs in tumor-bearing animals.Citation20 Along similar lines, ovarian cancer cells have been shown to stimulate the accumulation of a CD14+ cell subpopulation among maturing MoDC through the release of IL-10.Citation21
Here, we demonstrate that CD14+BDCA3+ DCs constitute a physiologically relevant DC subset that predominates myeloid cell populations that infiltrate melanoma metastases, which are known to express high levels of IL-10.Citation6 Employing MoDCs matured in the presence of a cytokine cocktail including IL-10, we studied in detail the functional characteristics of CD14+ mDCs in terms of T-cell activation and pro-tumorigenic activities. In addition, we report that the IL-10-driven development of CD14+ mDCs depends on signal transducer and activator of transcription 3 (STAT3), as it can be blocked by STAT3-targeting small-interfering RNAs (siRNAs).
Results
Immature CD14+ APCs massively outnumber CD1a+ DCs in melanoma metastases and co-express BDCA3 and DC-SIGN
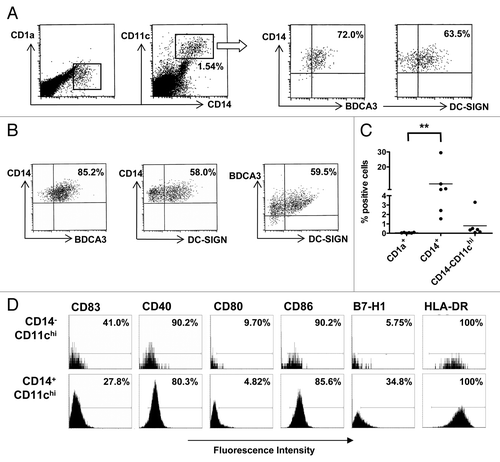
We have previously shown that conditioning the human skin in situ by IL-10 leads to a post-migrational trans-differentiation of mature CD1a+CD83+ DCs exhibiting intermediate CD11c levels to immature CD14+ macrophage-like cells characterized by high levels of CD11c and BDCA3Citation19 on the cell surface as well as by intracellular DC-SIGN expression (Lindenberg et al. submitted). As metastatic melanomas are known to release high levels of IL-10, that potentially could interfere with CD1 expression by developing DCs,Citation22 we assessed the balance between CD1a+ DCs and CD14+BDCA3+ APCs by 4-color flow cytometry analysis in single-cell suspensions obtained from melanoma metastases (n = 6). In this context, CD1a+ DCs were virtually absent whereas CD14+ cells were readily detectable (). These CD14+ cells expressed high levels of CD11c and BDCA3 on their surface, and the majority of them also stained positively for intracellular DC-SIGN (). The frequencies of metastasis-associated CD14+ myeloid cells averaged 8.78% (range: 1.54–29.5%), which is consistent with recent results from Gros et al.Citation23 and significantly outnumbered CD1a+ DCs (average: 0.05%, range: 0.005–0.1%, ). Beside CD14+ APCs, CD11chi myeloid cells that expressed neither CD1a nor CD14 were detectable at a relatively low frequency (range: 0.07–3.30%, ). Further phenotypic studies revealed that both CD11chiCD14− and CD14+ APCs were immature, exhibiting high HLA-DR expression levels but generally low levels of co-stimulatory markers. A notable difference between these cell subsets was represented by the comparatively higher expression levels of the co-inhibitory molecule B7-H1 (also known as PD-L1) by CD14+ APCs (). These data indicate a disturbed DC maturation within metastatic melanoma lesions, leading to a rise in immature CD14+ APCs exhibiting a distinct CD11chiBDCA3+DC-SIGN+ phenotype, with as yet unclear functional implications.
Figure 1. CD14+BDCA3+ myeloid cells with an immature phenotype outnumber CD1a+ dendritic cells in metastatic melanoma suspensions. (A) CD14 vs. CD1a staining in a representative single-cell suspension from a melanoma metastasis, upon gating of CD14+CD11chi cells to reveal their surface expression of BDCA3 and intracellular expression of DC-SIGN. (B) CD14, BDCA3 and DC-SIGN triple-staining in a representative melanoma single-cell suspension. (C) Percentage of CD1a+ dendritic cells (DCs) vs. CD14+ or CD14−CD11chi antigen-presenting cells (APCs) in single-cell suspensions from metastatic melanomas (n = 6). CD1a was gated out of the CD14+ and CD14−CD11chi APCs. **p < 0.01 in a repeated measures Friedman test with post-hoc multiple comparisons Dunn’s test. (D) Cytofluorometric analysis of gated CD14− or CD14+CD11chi cells from a representative metastatic melanoma single-cell suspension. The percentage of positive cells among total cell suspensions is indicated and markers denote fluorescence intensity of the IgG1 isotype control.
The administration of IL-10 during MoDC maturation promotes the development of a CD14+BDCA3+ cell subpopulation exhibiting a tolerogenic macrophage-like phenotype
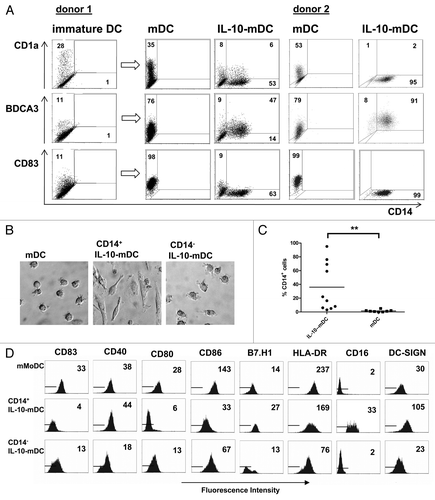
As comparative functional analyses of DC subsets from clinical samples are complicated by low cell numbers, we turned to an in vitro model to assess and compare the functionality of CD14+ and CD14− cells arising during IL-10-conditioned DC maturation. Velten et al. have previously reported the trans-differentiation of CD14+BDCA3+ cells from CD1a+ MoDCs during IL-10-exposed DC maturation.Citation18 Also in our hands CD14 was expressed on fully differentiated MoDCs matured by an inflammatory cytokine cocktail including IL-6, TNFα, IL-1β and prostaglandin E2 (PGE2) in the presence of IL-10 (hereafter referred to as CD14+ IL-10-mDCs) (). This CD14+ cell population also expressed high levels of BDCA3, lacked CD83 () and adopted a macrophage-like morphology (), all of which contrasted with CD14− IL-10-mDCs, yet it exhibited a phenotype and morphology that closely resembled those of skin-emigrated CD14+ APCs trans-differentiated from CD1a+ DCs (Fig. S1).Citation19 The percentage of post-maturation CD14+ IL-10-MoDCs varied considerably between donors (as exemplified for two subjects in ): in eight independent experiments the frequency of CD14+ IL-10-mDCs ranged from 3 to 95% (mean: 35.9%), which was significantly higher than the percentage CD14+ MoDCs detected upon maturation in standard conditions (mean: 1.5%, range: 0–5%, p = 0.002 by Wilcoxon Signed Rank test, ). Compared with control mDCs and CD14− IL-10-mDCs, the CD14+ IL-10-mDC population expressed lower levels of the co-stimulatory molecules CD80, CD83 and CD86, whereas the expression levels of the inhibitory molecule B7-H1 were elevated (). Similarly, the surface levels of CD16 and DC-SIGN, both of which have previously been linked to tumor-conditioned DCs and macrophages,Citation24,Citation25 were specifically elevated on CD14+ IL-10-mDCs. Again, the absence of CD83 and CD80 combined with expression of B7-H1 and DC-SIGN is consistent with the phenotype of CD14+ APCs emigrated from IL-10 conditioned skin explants (Fig. S1), confirming the validity of our in vitro trans-differentiation model of IL-10-exposed MoDC maturation. In addition, the immature state of these cells and their BDCA3 and B7-H1 expression levels are consistent with the phenotype displayed by the CD14+ myeloid cell subset that is abundantly found within melanoma metastases ().
Figure 2. A CD14+BDCA3+ cell population exhibiting macrophage-like morphology and phenotype arises during the maturation of monocyte-derived dendritic cells. (A) Expression of CD1a, CD14, CD83 and BDCA3 on immature monocyte-derived dendritic cells (MoDCs), MoDC matured for 2 d by a mixture of prostaglandin E2 (PGE2), tumor necrosis factor α (TNFα), interleukin (IL)-1β and IL-6 (mDCs), and DCs matured in the presence of IL-10 (IL-10-mDCs). (B) Light microscopic images of mDCs and FACS-sorted CD14+ and CD14− IL-10-mDCs (400× magnification). (C) Percentages of CD14+ DCs matured in the presence (IL-10-mDCs) or absence (mDCs) of IL-10. **p < 0.01 in a Wilcoxon Signed Rank paired analysis. (D) Expression of CD83, CD40, CD80, CD86, B7-H1, HLA-DR, CD16 and DC-SIGN on the indicated mDC subsets. Data are representative of at least eight independent experiments.
CD14+ IL-10-mDCs have a reduced T-cell stimulatory capacity and display tolerogenic traits
In keeping with their immature phenotype, FACS-sorted CD14+ IL-10-mDCs proved to be poor activators of naïve allogeneic TH cells (). While CD14− IL-10-DCs were more proficient that their CD14+ counterparts in this respect, they were still inferior to normally matured MoDCs (). To assess the ability of IL-10-mDCs to induce proliferative anergy, allogeneic T cells were co-cultured for 8 days with differentially matured and sorted MoDC populations, harvested, labeled with CFSE and re-stimulated with anti-CD3 and anti-CD28 antibodies. Proliferation was then determined after 3, 4 and 5 days. As shown in , T cells primed by control mDCs or CD14− IL-10-mDCs displayed equivalent proliferation rates whereas CD14+ IL-10-mDCs lagged behind with on average a 4-fold reduction in T-cell proliferation levels, pointing to a proliferative T-cell anergy.
Figure 3. T-cell stimulatory characteristics of CD14+ and CD14− dendritic cells matured in the presence of interleukin-10. (A) Allostimulation of T cells by monocyte-derived dendritic cells (DCs) matured in the absence (mDCs) or in the presence (IL-10-mDCs) of interleukin (IL)-10 sorted by CD14 expression. Mean proliferation ± SEM from n = 3 mixed leukocyte reactivity (MLR) tests. (B) After 8 d of allostimulation with different mDC subsets, T cells were pulsed with CFSE and re-stimulated with anti-CD3 and anti-CD28 monoclonal antibodies, and proliferation was followed over time by CFSE dilution. Data from one representative experiment out of three are shown. (C) CD4+CD25- TH cells were stimulated with anti-CD3 monoclonal antibody (OKT3)-loaded autologous mDC populations and—after 14 d—expansion factors were measured. Data are shown as means ± SEM of n = 4 experiments, *p < 0.05. Representative microphotographs are reported (100× magnification). (D and E) Secretion of IL-6 (D) or IL-12p70 and IL-10 (E) by mDCs and IL-10-mDCs sorted by CD14 expression, upon CD40 ligation. Mean IL-12p70 and IL-10 concentrations were divided to obtain IL-12p70:IL-10 ratios for the indicated conditions. Data represent means ± SEM from n = 5 experiments, *p < 0.05. (F) After co-culturing CD4+CD25− TH cells with different OKT3-loaded autologous mDC populations for 14 d, they were re-stimulated with anti-CD3 and −CD28 monoclonal antibodies and tested for the release of interferon γ (IFNγ), tumor necrosis factor α (TNFα), IL-4, IL-6, IL-10 and IL-17 (TH1/TH2/TH17) 24 h later. Data represent means ± SD from n = 5 experiments, *p < 0.05.
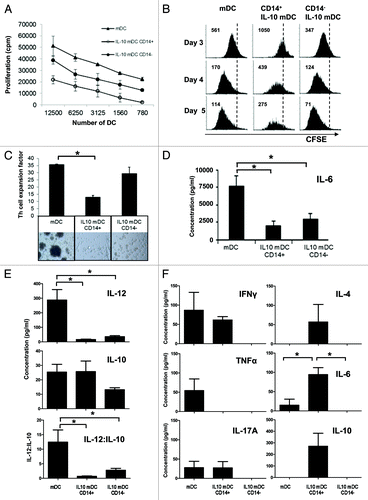
The poor ability of CD14+ IL-10-mDCs to prime TH cells was also demonstrated upon anti-CD3 antibody (OKT-3) loading and co-culture with isolated CD4+CD25− T cells, resulting in the production of considerably lower levels of expansion factors than those achieved with mDCs or CD14− IL-10-mDCs (). Next, the release of cytokines known to support and skew T-cell responses was assessed in mDC subsets upon CD40 ligation. Both CD14+ and CD14− IL-10-mDCs released significantly reduced levels of IL-6 () and IL-12p70 () than control mDCs, the latter resulting in significantly lower IL12:IL-10 ratios (). After a 14-day culture, the cytokine secretion profile of TH cells as promoted by anti-CD3-pulsed mDC populations was determined. Control mDCs preferentially induced TH1 cells that released high levels of interferon γ (IFNγ) and TNFα but low amounts of IL-17 and IL-6, whereas CD14+ IL-10-mDCs also induced TH2 cells that secreted IL-4 and relatively high levels of the potentially immunosuppressive cytokines IL-6 and IL-10 (). Remarkably, CD14− IL-10-mDCs failed to induce any cytokine release by primed TH cells. Taken together with the ability of CD14− IL-10-mDCs to induce normal levels of TH-cell expansion, these findings constitute a clear indication that CD14− IL-10-mDCs can promote a selective and profound functional anergy.
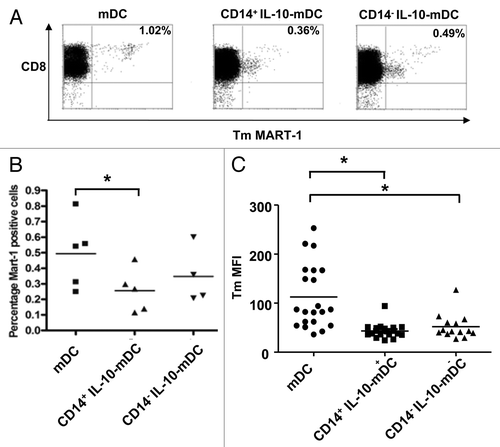
To evaluate the antigen-specific CD8+ T-cell priming ability of different MoDC populations, MoDCs were loaded with peptides covering the immunodominant HLA-A2-binding epitope MART-126–35L derived from the melanoma antigen Melan-A/MART-1 and co-cultured with autologous CD8β+ T-cell precursors and irradiated CD8β− autologous peripheral blood mononuclear cells (PBMC). After a 10-day priming culture, the frequency of MART-126–35L specific CD8+ T cells was determined by tetramer (Tm) binding (). Results from five independent priming experiments clearly demonstrate the superior priming efficiency of normally matured MoDCs and the low frequency of Tm+ T cells upon priming by CD14+ IL-10-mDCs (p < 0.05, as compared with mDCs) (). Interestingly, Tm fluorescence intensity levels appeared to be lower on T cells primed by IL-10-mDCs than on their counterparts primed by normally matured MoDCs. This was confirmed by the combined analysis of data from priming co-cultures, showing that the differences in Tm binding levels were significant () and hence pointing to the priming of CD8+ T cells exhibiting a relatively low binding avidity.
Figure 4. Induction of MART-1 specific CD8+ T cells by CD14+ and CD14− dendritic cells matured in the presence of interleukin-10. (A–C) Autologous HLA-A2+ monocyte-derived dendritic cells (MoDCs) matured in the presence (IL-10-DCs) or in the absence (mDCs) of interleukin-10 (IL-10) and sorted by CD14 expression were loaded with MART-126–35L and co-cultured with MART-1-specific CD8β+ T cells in multiple (n = 6) parallel cultures per condition per donor. (A) Representative examples of MART-126–35L HLA-A2 tetramer binding by CD8+ T cells after a single 10-d in vitro stimulation for different mDC cultures. (B) Mean 10-d priming efficiencies (in % HLA-A2+ tetramer-bound T cells) from 5 healthy donors, *p < 0.05. (C) Tetramer binding levels (by mean fluorescence intensity) from tetramer-positive priming cultures, *p < 0.05.
CD14+ IL-10-mDCs display angiogenic, pro-invasive and immunosuppressive transcriptional profiles
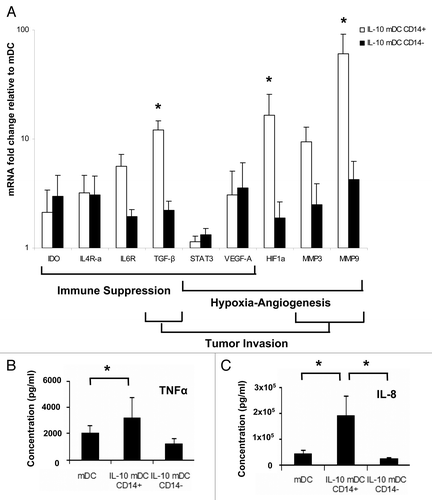
To obtain further indications of the ability of CD14+ and CD14− IL-10-mDCs to influence tumor growth and local spread, we performed transcriptional profiling focusing on key genes linked to angiogenesis, invasion and immunosuppression. In , the fold changes of mRNA expression levels in IL-10-mDCs as compared with control mDCs are shown. In both IL-10-mDC populations, a relative increase in the levels of transcripts related to (1) immunosuppression, such as those coding for indoleamine 2,3-dioxygenase (IDO), IL-4Ra, IL-6R, STAT3, transforming growth factor β (TGFβ) and vascular endothelial growth factor A (VEGFA); (2) angiogenesis, such as those encoding STAT3, VEGFA, hypoxia-inducible factor 1α (HIF1α), and matrix metalloproteinases 3 and 9 (MMP3 and MMP9); and (3) tumor invasiveness, such as those coding for TGFβ, MMP3 and MMP9, were observed. Interestingly, CD14+ IL-10-mDCs exhibited a particular overexpression of TGFβ, HIF1α, MMP3 and MMP9, indicative of a specific ability of this cell subset to induce endothelial migration and tumor invasion. Further corroborating this notion, CD14+ IL-10-mDCs released high levels of the pro-angiogenic and pro-invasive cytokines TNFα and IL-8 ().
Figure 5. CD14+ dendritic cells matured in the presence of interleukin-10 display an angiogenic, pro-invasive and immune suppressive transcriptional profile. (A) Relative mRNA expression levels of the indicated genes in CD14+ (open bars) and CD14− (closed bars) dendritic cells (DCs) matured in the presence of interleukin (IL)-10 (IL-10-mDCs), upon normalization to the values of DCs matured in the absence of IL-10 (mDCs), as assessed by qRT-PCR. Data are means ± SEM from n = 6 experiments, *p < 0.05. (B) Secretion of tumor necrosis factor α (TNFα) and IL-8 by mDCs and IL-10-mDCs sorted by CD14 expression, upon CD40 ligation. Data represent means ± SEM from n = 5 experiments, *p < 0.05.
STAT3 depletion blocks the development of CD14+ IL-10-mDCs
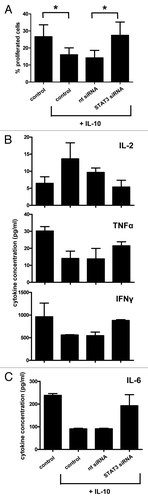
The JAK2/STAT3 signaling pathway has previously been implicated in tumor-related DC suppression. To ascertain the possible involvement of this signal transduction cascade in the development of CD14+ IL-10-mDCs, MoDCs were transfected with a STAT3-targeting siRNA prior to maturation in the presence of IL-10. Non-targeting and CD83-specific siRNAs served as negative and positive controls, respectively. The siRNA-mediated depletion of STAT3 effectively blocked the development of CD14+ DCs while facilitating the upregulation of CD80 and CD83 to levels that were similar to those expressed by normally matured MoDCs (). Combined data from five independent RNA interference experiments clearly demonstrate that the depletion of STAT3 completely abolishes the suppressive effects of IL-10 on MoDC maturation (). Of note, a partial depletion of STAT3 () was sufficient for the prevention of CD14+ IL-10-mDC development. Importantly, STAT3 knockdown also prevented the functional impairment of IL-10-mDCs, as indicated by their restored allogeneic T-cell priming capacity (). Moreover, the depletion of STAT3 preserved TH1 differentiation in spite of the immunosuppressive effects of IL-10, as evidenced by reduced IL-2 and increased TNFα and IFNγ release in allogeneic T-cell priming experiments (). Finally, the release of IL-6 by co-cultures involving STAT3-depleted cells () suggests that STAT3 is required for IL-10 to inhibit the production of this immunostimulatory cytokine at the DC level (see also ).
Figure 6. STAT3 is required for the development of CD14+ dendritic cells upon maturation in the presence of interleukin-10. (A–C) Effects of STAT3-targeting small-interfering RNAs (siRNAs) on CD14, CD80, and CD83 expression of monocyte-derived dendritic cells (MoDCs) matured in the absence (mDCs) or in the presence (IL-10-mDCs) of interleukin-10 (IL-10). (A) Representative results from five experiments, mean fluorescence intensities (MFI) and % positive cells are reported. (B) Mean percentages of positive cells ± SEM from n = 5 experiments, *p < 0.05. Non-targeting and CD83-specific siRNAs served as negative and positive controls, respectively. (C) Immunoblotting analysis of STAT3 expression levels upon transfection in IL-10-mDCs.
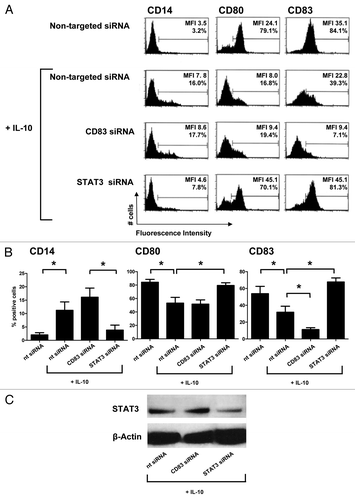
Figure 7. STAT3-depleted dendritic cells matured in the presence of interleukin-10 maintain allogeneic T-cell priming and TH1-inducing capacities. (A) Mixed leukocyte reactivity upon RNA interference as indicated. Means ± SEM of n = 3 separate experiments are shown, *p < 0.05. (B and C) Interleukin (IL)-2, tumor necrosis factor α (TNFα), interferon γ (IFNγ) (B) and IL-6 (C) release at day 6 upon RNA interference as indicated, for n = 2 experiments.
Discussion
A large number of studies attest the remarkable plasticity of the myeloid lineage.Citation26 Tumors abuse this phenotypic plasticity by secreting factors that (1) block normal myeloid differentiation and maturation pathways, both locally and systemically, and (2) re-direct the differentiation of myeloid cells toward the development of immunosuppressive cell subsets that effectively interfere with antitumor immunity through the induction of anergy and Tregs.Citation2,Citation3 Consequently, tumors are often infiltrated by high amounts of monocyte/macrophage-like cells but low numbers of DCs, which is generally a poor prognostic indicator. A number of in vitro studies have shown that the differentiation of DCs from monocytes can be blocked by tumor-derived supernatants (TDSNs) resulting in the development of CD14+ M2 macrophage-like cells with poor T-cell stimulatory abilities,Citation27-Citation29 or even MDSC-like cells with T-cell suppressive activity.Citation30 Beside monocytes, fully differentiated DCs may also be recruited to the tumor microenvironment, where they may lose their characteristic CD1 expression owing to the immunosuppressive action of IL-10, as shown in melanoma metastases.Citation13,Citation22 Indeed, a growing number of studies indicate that tumor-associated IL-10 has the unique ability to convert even fully differentiated DCs into macrophage-like cells.Citation18-Citation21,Citation31 We have previously demonstrated the existence of an IL-10-dependent phenotypic shift of mature CD1a+ DCs into CD14+ macrophage-like cells over the course of their migration from human skin explants.Citation19,Citation31 These CD14+ macrophage-like DCs displayed poor T-cell stimulatory properties and were characterized by BDCA3 expression.Citation19 These observations have been confirmed by Chu et al., who have additionally shown that dermis-derived CD14+BDCA3+ DCs induce inflammation-attenuating Tregs.Citation32
Velten et al. reported the conversion of CD1a+ DCs to a CD14+BDCA3+ cell subset exhibiting immunoregulatory effects in the course of IL-10-conditioned MoDC maturation.Citation18 This in vitro model enabled us to sort sufficient numbers of CD14+BDCA3+ IL-10-mDCs to perform comparative transcriptional and functional studies in comparison with CD14− IL-10-mDCs and normally matured mDCs.
Previous studies have shown that the addition of IL-10 during MoDC differentiation (prior to maturation, IL-10-iDC) results in high levels of CD14, DC-SIGN, CD68 and CD16 expression.Citation7,Citation12,Citation33 These macrophage-like cells induce TH2 cells owing to a hampered secretion of IL-12p70.Citation34 We found similar traits for CD14+ mDCs arising during inflammatory cytokine-induced MoDC maturation in the presence of IL-10. In fact, the only features apparently distinguishing CD14+ IL-10-mDCs and IL-10-iDCs were higher expression levels of the macrophage marker CD16 and the inhibitory receptor B7-H1 (PD-L1) on the former. In all other respects, that is, phenotypically, morphologically and functionally, IL-10-iDCs proved to be very similar to CD14+ IL-10-mDCs (Fig. S2). In this regard, the presence of B7-H1 on CD14+ APCs associated with melanoma metastases indicates that they may at least in part represent IL-10-mDCs (). In contrast, CD14+ IL-10-mDCs differed considerably from their CD14− counterparts, exhibiting comparatively lower levels of CD83 and co-stimulatory markers, higher levels of BDCA3, CD16, DC-SIGN and B7-H1 as well a typical macrophage-like morphology, whereas CD14− IL-10-mDCs were phenotypically and morphologically more reminiscent of control mDCs. Compared with control mDCs, both CD14+ and CD14− IL-10-mDCs secreted reduced levels of IL-6 and IL-12p70, a feature shared with M2 macrophages.Citation35 Altogether, these features resulted in a profound inability of CD14+ IL-10-mDCs to activate both CD4+ and CD8+ T cells. In addition, CD14+ IL-10-mDCs promoted to some extent proliferative anergy in allogeneic T cells, whereas CD14− IL-10-mDCs did not. Conversely, CD14− IL-10-mDCs entirely failed to support TH cell differentiation, inducing neither TH1 nor TH2 responses, whereas CD14+ IL-10-mDCs induced a balanced TH1/TH2 response. This might be related to the particularly relatively low CD40 expression levels of CD14− IL-10-mDCs (). Both CD14+ and CD14− cell subsets differed from control mDCs in this respect, the latter primarily inducing the release of TH1 cytokines including IFNγ and TNFα. Both CD14+ and CD14− IL-10-mDCs exhibited a relatively poor priming efficiency for MART-126–35L-specific CD8+ T cells with an apparently low avidity, indicating that these DC subsets may be inefficient at supporting antitumor immune responses. This is further supported by the fact that CD14+ and CD14− IL-10-mDCs exhibited increased levels of transcripts coding for IDO, STAT3, TGFβ, VEGFA, IL-4Ra and IL-6R, all of which have been associated with immunosuppressive myeloid cell subsets.Citation3 Of note, despite these immunosuppressive features and the apparent anergy-inducing qualities of CD14+ and CD14− IL-10-mDCs, we were unable to unequivocally demonstrate the induction of Treg or a direct suppression of T-cell proliferation by either subset (data not shown). This is in line with a recent report by Gros et al., who shown that CD14+ cells infiltrating melanoma metastases neither suppress T-cell proliferation nor positively correlate (in amounts) with infiltrating Tregs.Citation23
Beside a profound inability to support T-cell activation and expansion, CD14+ IL-10-mDCs also displayed a transcriptional profile pointing to the ability of these cells to induce angiogenesis and invasion, again features that they share with tumor-conditioned M2 macrophages. The tumor-induced activation of a HIF1α transcriptional signature has been reported in macrophages, even under normoxic conditions.Citation36 This is consistent with the transcriptional and cytokine profile observed in CD14+ IL-10-mDCs, involving a coordinated expression of HIF1α, TGFβ, VEGFA, MMP3, MMP9, IL-8 and TNFα, all of which can contribute to tumor progression by supporting the migration and proliferation of endothelial cells as well as tumor growth and invasion.Citation2,Citation3 These observations warrant further functional investigation using both in vitro generated and primary tumor-derived CD14+BDCA3+ myeloid cells.
In our hands BDCA3 was also upregulated on mDCs that were matured by an inflammatory cytokine cocktail per se consisting of TNFα, IL-6, PGE2 and IL-1β, all of which are often present within the tumor microenvironment and can activate tumor-conditioned DCs, macrophages and MDSCs.Citation3 Although BDCA3 was expressed at higher levels by CD14+ IL-10-mDCs as compared with their CD14− counterparts, caution is clearly warranted in the use of BDCA3 as a standalone marker to identify tumor-suppressed myeloid cells. Rather, the combined expression of CD14, BDCA3, DC-SIGN, CD163 and CD16 appears to provide a phenotypic profile that would be useful for the identification of macrophage-like cell subsets that arise in the course of tumor-conditioned myeloid cell differentiation or maturation. We and others have identified such cell subsets in breast, colon, head and neck and melanoma lesions.Citation24,Citation37 A phenotypically distinct human BDCA3+ DC subset found in the blood and the spleen efficiently cross-presents soluble or cell-associated antigens to CD8+ T cells.Citation15-Citation17,Citation38 The functional significance of BDCA3 for cross-presenting and tumor-suppressed DC subsets remains unclear, yet some clues are emerging. BDCA3 (thrombomodulin) is known as an anticoagulant factor that neutralizes thrombin and is expressed on the membrane of endothelial cells, from which it can also be shed. BDCA3 consists of an extracellular lectin-like domain and a short cytoplasmic tail that—upon thrombin binding—activates a PI3K/NOS3/SRC signaling axis.Citation39 The lectin-like domain of BDCA3 can downregulate NF-κB and mitogen-activated protein kinase (MAPK) signaling pathways, and thus interfere with endothelial-cell activation.Citation40 If BDCA3 would mediate similar effects in DCs, this might interfere with DC maturation, drive IL-10 release and sustain a TH2 response skewing.Citation41 In support of this hypothesis, BDCA3 is upregulated by circulating mDC-2 cells upon allergen exposure, resulting in TH2 skewing.Citation42 In addition, in vitro generated or skin-derived CD14+BDCA3+ DCs release elevated levels of IL-10.Citation18,Citation32 Of note, we successfully depleted BDCA3 with siRNAs but did not observe any changes in the IL-10-induced expression of CD14 during MoDC maturation (data not shown).
Importantly, STAT3 depletion completely protected DCs from the effects of IL-10 during maturation and ensured the acquisition of a mature T cell-stimulatory phenotype featuring high levels of CD80, CD83 and CD86, while preventing the accumulation of CD14+ mDCs. Accordingly, the allogeneic T-cell priming and TH1-stimulating capacities of IL-10-exposed mDCs were preserved upon STAT3 depletion. This is in line with previous reports indicating that STAT3 inhibition or depletion protects DCs against the immunosuppressive effects of tumor-associated factors like IL-6 and IL-10, prevents the upregulation of B7-H1 (as observed on CD14+ IL-10-mDCs), and preserves the TH1-skewing propensity of mDCs.Citation43-Citation45
In conclusion, the exposure of maturing DCs to IL-10 may result in a STAT3-dependent acquisition of an immature CD14+BDCA3+ macrophage-like phenotype featuring immunosuppressive and limited T cell-stimulatory traits as well as the potential to promote endothelial cell migration and tumor invasion. The development of such tumor-promoting cells within the cancer microenvironment may be therapeutically targeted by cytokines or by agents that interfere with STAT3 signaling.
Materials and Methods
Monocyte isolation and MoDC generation
PBMCs were isolated by density centrifugation (Lymphoprep; Nycomed AS) from buffy coats obtained from healthy blood donors (Sanquin). Monocytes were isolated from PBMCs using anti-CD14 magnetic microbeads, according to the manufacturer’s instructions (Miltenyi Biotec). CD14+ cells were cultured at a density of 4.0 × 10⁵ cells/mL for 7 d in Iscove’s Modified Dulbecco’s Medium (IMDM) (Lonza BioWhittaker) supplemented with 10% fetal bovine serum (FBS; HyClone), 100 IU/mL sodium penicillin (Yamanouchi Pharma), 100 μg/mL streptomycin sulfate (Radiumfarma-Fisiopharma), 2 mM L-glutamine (Invitrogen Life Technologies), 10 μM 2-mercaptoethanol (2-ME, Merck), 100 ng/mL granulocyte macrophage colony-stimulating factor (GM-CSF; Berlex) and 10 ng/mL IL-4 (Strathmann Biotec), at 37°C, 95% humidity and 5% CO2. Subsequently, a cytokine maturation cocktail was added constisting of 50 ng/mL TNFα (R&D Systems), 100 ng/mL IL-6 (R&D Systems), 25 ng/mL IL-1β (R&D Systems) and 1 μg/mL PGE2 (Sigma-Aldrich). To obtain IL-10-conditioned mature MoDCs (IL-10-mDCs), 40 ng/mL IL-10 (Strathmann Biotec) were included in the maturation cocktail.Citation10,Citation18 mDCs were harvested two days later.
Cell sorting
IL-10-MoDCs were harvested and labeled with an anti-CD14 PE-conjugated antibody (BD Biosciences) for 30 min on ice. Sorting was performed using a FACSAria (BD Biosciences) cytofluorometer. Sorted cells were centrifuged, counted and used in functional experiments.
Tumor dissociation
Single-cell suspensions prepared from human melanoma metastases were handled within 24 h after surgical removal from patients as previously described and upon informed consent, in the context of an IRB-approved trial conducted at the VU University medical center in Amsterdam (The Netherlands).Citation46 In short, the tumor specimen was minced with a scalpel and dissociated over the course of 1–3 1-h cycles involving 0.02% DNase and 0.14% type IV collagenase in IMDM. The cell suspension was then filtered through a 100 μm sterile cell strainer and washed to remove tissue debris prior to FACS analysis.
Flow cytometry
Cells were incubated at 4°C for 30 min in PBS with 0.1% BSA and 0.01% NaN3, in the presence of appropriate dilutions of FITC- or PE-labeled mouse mAbs targeting CD83 (Coulter Immunotech), CD86, HLA-DR, CD1a, CD14, CD16, CD40, CD80 (all from BD Biosciences), B7-H1 (BD PharMingen), DC-SIGN (BD PharMingen), BDCA3 (Miltenyi Biotec) or appropriate IgG isotype controls (BD Biosciences). After washing, samples were acquired on a FACSCalibur cytofluorometer and data analyzed with CellQuest software (BD Biosciences). For the intracellular staining of DC-SIGN, surface markers CD14, CD1a and CD11c were first stained as described above. Subsequently, cells were fixed and permeabilized using the BD Fix-Perm kit, following manufacturer’s guidelines. Intracellular straining was performed for 30 min at 4°C in 1× permeabilization buffer. Cells were then washed once with 1× permeabilization buffer and once with FACS buffer before analysis.
Mixed leukocyte reaction (MLR) and TH cytokine release
To determine the functional capacity of the different DC subsets to induce allogeneic T-cell proliferation, sorted DCs were added at titered amounts to round-bottom 96-well tissue culture plates (Costar) pre-seeded with allogeneic responder peripheral blood lymphocytes (PBLs), which were obtained from PBMCs upon the removal of monocytes with CD14 microbeads (Miltenyi). Stimulations were performed in triplicate instances. Cells were cultured for 5 d in IMDM supplemented with 10% HPS, sodium penicillin, streptomycin sulfate, L-glutamine and 2-ME. During the last 18 h of culture, 0.4 μCi/well [3H]TdR was added (Amersham), after which cells were harvested onto fiberglass filters, and [3H]TdR incorporation was determined using a flatbed liquid scintillation counter (Wallac). Alternatively, DCs were added as stimulator cells to 105 monocyte-depleted PBLs, labeled with 3 μM 5(6)-carboxyfluorescein (CFSE, Sigma Aldrich). PBL stimulation was performed in triplicate instances. At day 6, samples were taken from each well and T-cell proliferation was determined by flow cytometry. To determine the levels of T-cell cytokines, supernatants were taken at day 6 and analyzed by flow cytometry using the TH1/TH2/TH17 CBA kit (BD Biosciences, 560484).
TH cell differentiation
Forty thousand MoDCs were incubated with 0.5 μg/mL human anti-CD3 antibody (OKT-3, eBioscience) in 200 μL complete IMDM for 15 min at 4°C. After incubation, MoDCs were co-cultured with 2 × 10⁴ CD4+CD25− T cells (isolated by magnetic bead separation using the untouched CD4 isolation kit and anti-CD25 beads from Miltenyi, according to the manufacturer’s instructions) for 14 d. At day 7, 10 U/mL IL-2 (Strathmann Biotec) were added to the cultures. To determine the cytokines that were released by T cells co-cultured with the different MoDC subsets, 1 × 10⁵ cells were subsequently stimulated with 1 μg/mL anti-CD3 (16A9) and 1 μg/mL anti-CD28 (15A9) antibodies in 200 μL complete medium (both antibodies were kind gifts of Dr René van Lier, Sanquin). The supernatants were harvested the next day and tested for cytokine content with a TH1/TH2/TH17 cytometric bead array (CBA) according to the manufacturer’s instructions (BD Biosciences).
Cytokine release by DCs
The different DC subsets were analyzed for the release of IL-12p70, IL-10, IL-6, IL-1β, TNFα, VEGF and IL-8. DCs were cultured together with irradiated (5000 rad) mCD40L-transfected J558 cells (a kind gift of Dr. M. Kapsenberg, Amsterdam Medical Center) at a 1:1 ratio in complete medium supplemented with 1000 U/mL IFNγ (R&D Systems). After 24 h, supernatants were collected and tested with an inflammatory cytokine CBA (BD Biosciences).
CD8+ T-cell priming
To determine the capacity of the different MoDC subsets to induce antigen-specific CD8+ T cells, MoDCs were loaded with 1 μg/mL MART-126–35L (ALGIGILTV) in the presence of 3 μg/mL β2-microglobulin (Sigma-Aldrich) for 4–5 h at room temperature. A total of 1 × 10⁵ peptide-loaded DCs were cultured for 10 d together with 1 × 10⁶ CD8β+ T cells and 1 × 10⁶ irradiated (5000 rad) CD8β− autologous PBMCs in Yssel mediumCitation47 supplemented with 1% human AB serum (ICN Biochemicals) in a 24-well tissue culture plate. After 10 d, T cells were analyzed by flow cytometry using PE-labeled tetramers presenting the relevant epitope, as previously described.Citation48
Proliferative T-cell anergy assay
To assess the induction of proliferative T-cell anergy, different MoDC subsets were cultured with PBLs (ratio 1:5) in IMDM supplemented with 10% HPS for 8 d. Thereafter, T cells were harvested, washed with PBS containing 5% FBS and incubated with 5 μM CFSE (Molecular Probes) for 3.5 min at room temperature, and washed twice with PBS supplemented with 5% FBS. CFSE-labeled T cells were incubated for 1 h on ice with 2 μg anti-CD3 and 0.4 μg anti-CD28 antibodies per 1 × 10⁶ cells. After incubation and washing, cells were placed in 24-well plates, coated with affinity-purified goat anti-mouse immunoglobulin (1:100; Dako) in complete medium supplemented with 10% HPS at a concentration of 1 × 10⁶ cells/mL/well for 1 h at 4°C. Cells were subsequently cultured for 5 d in a humidified 5% CO2 incubator at 37°C. After 3, 4 and 5 d of culture, T-cell profliferation was assessed by flow cytometry.
RNA isolation and cDNA synthesis
Total RNA was isolated from MoDCs using the RNeasy kit (QIAgen) according to the supplier’s protocol. All isolations were subjected to on-column DNase treatment (QIAgen) to remove any possible genomic DNA contamination. The concentration and purity of RNA was analyzed using the NanoDrop ND-1000 system (NanoDrop Technologies). cDNA synthesis was performed by means of the iScript cDNA synthesis kit (Bio-Rad) on 1 μg of RNA, according to the supplier’s protocol. After cDNA synthesis, nuclease-free water was added up to a final volume of 50 μL.
Primer design
Primers were designed and validated as described previously.Citation49 Primers specific for human IDO, IL-4R-a, IL-6R, TGFβ, STAT3, VEGF-A HIF1α, MMP3 and MMP9 (Table S1) were synthesized by Eurogentec.
Real-time PCR
Quantitative real-time PCR (qRT-PCR) was performed essentially as describedCitation49 on a CFX96 system (BioRad) using the iQ SYBR Green PCR master mix (BioRad). Each PCR reaction was performed in a 25 μL volume containing 30 ng cDNA, 12.5 μL 2x iQ SYBR Green PCR master mix and 1 μL of primer mix (10 μM forward primer, 10 μM reverse primer). The thermal profile was as follows: 10 min at 95°C, followed by 40 cycles of 15 sec at 95°C and 30 sec at 60°C. Subsequently, a melting curve analysis was performed which consisted of 70 cycles of 10 sec with a temperature increment of 0.5°C/cycle starting at 60°C. The obtained Ct value of each gene of interest was normalized to the Ct of the reference genes as follows: Ctnorm = Ctgoi - Ctref with Ctref = (CtbACT × CtCycloA × Ctb2MG × CtHPRT)^(1/4) with norm = normalized, goi = gene of interest and ref = reference gene. Data are shown as mean values ± SEM.
siRNA transfection
Immature MoDCs were resuspended in antibiotic free IMDM supplemented with 10% FCS, 1000 U/mL GM-CSF and 10 ng/ml IL-4 at 1 × 10⁶ mL, then plated out at 1 × 10⁵ cells per well in 96-well round bottom plates (Greiner) and transfected with 25 nM ON-TARGETplus SMARTpool RNAi (Dharmacon) for 48 h at 37°C, 5% CO2. Transfected siRNAs included siRNAs specific for CD83 (L-012680-00-0005), BDCA3 (L-012551-00-0005) and STAT3 (L-003544-00-0005), a non-targeting siRNA (D-001810-10-05), as well as the siGlo transfection indicator (D-001630-01-05). A mock (non transfected) control was also utilized. After 48 h, transfection medium was replaced with complete medium supplemented with 1000 U/mL GM-CSF, 10 ng/mL IL-4 and a DC maturation cytokine cocktail (2400 U/mL TNFα, 100 ng/mL IL-6, 25 ng/mL IL-1β and 1 μg/mL PGE2), alone or combined with 40 ng/mL IL-10.
Immunoblotting analysis
siRNA-transfected mDCs were resuspended in lysis buffer containing 100 μL phosphatase inhibitor cocktail 1, 100 μL phosphatase inhibitor cocktail 2 (both from Sigma-Aldrich) and 1 Complete Mini Protease inhibitor tablet (Roche Diagnostics) in 1% NP40 in PBS. The total protein content of cell lysates was quantified in duplicate instances by means of the BCA protein assay kit (Pierce Biotechnology). Samples containing 15 μg protein were denatured before separation on SDS-PAGE gels, after which they were transferred to a polyvinylidene difluoride membrane (Bio-Rad) by electrotransfer. Membranes were blocked with 5% powdered milk in PBS and probed overnight with an anti-STAT3 antibody (Cell Signaling Technology Inc.). After washing, membranes were incubated with horseradish peroxidase-conjugated antibody (Dako) for 1 h at room temperature. Immunoreactive bands were then visualized on film using the enhanced chemiluminescence (ECL) detection kit (Amersham Biosciences). As loading control, membranes were probed with a monoclonal anti-β actin antibody (Sigma-Aldrich).
Statistical analyses
The frequency of DC subsets and specific T cells, cytokine release data, and transcriptional data were compared between conditions using either paired Student’s t tests, Wilcoxon Signed Rank tests, the repeated measures one-way ANOVA with post-hoc Tukey multiple comparison analysis or the Friedman test with post-hoc multiple comparison Dunn’s test. The Prism 4.0 statistical software package (GraphPad Software Inc.) was used. Differences and correlations were considered significant when p < 0.05 in two-sided analyses.
| Abbreviations: | ||
| DC | = | dendritic cell |
| IL | = | interleukin |
| MoDC | = | monocyte-derived DC |
| PGE2 | = | prostaglandin E2 |
| STAT3 | = | signal transducer and activator of transcription 3 |
Additional material
Download Zip (1.4 MB)Acknowledgments
This study was supported by a grant from the Netherlands Organization for Scientific Research (NWO) to T.D.d.G. (NWO Vidi grant 917-56-321); V.L.T. and A.W.G. are supported by grants of the Dutch Cancer Society (UM2008-4101; VU2009-4358).
Disclosure of Potential Conflicts of Interest
No conflicts of interest were disclosed.
Related Research Data
References
- Segal NH, Parsons DW, Peggs KS, Velculescu V, Kinzler KW, Vogelstein B, et al. Epitope landscape in breast and colorectal cancer. Cancer Res 2008; 68:889 - 92; http://dx.doi.org/10.1158/0008-5472.CAN-07-3095; PMID: 18245491
- Lindenberg JJ, Fehres CM, van Cruijsen H, Oosterhoff D, de Gruijl TD. Cross-talk between tumor and myeloid cells: how to tip the balance in favor of antitumor immunity. Immunotherapy 2011; 3:77 - 96; http://dx.doi.org/10.2217/imt.10.95; PMID: 21174559
- Gabrilovich DI, Ostrand-Rosenberg S, Bronte V. Coordinated regulation of myeloid cells by tumours. Nat Rev Immunol 2012; 12:253 - 68; http://dx.doi.org/10.1038/nri3175; PMID: 22437938
- Krüger-Krasagakes S, Krasagakis K, Garbe C, Schmitt E, Hüls C, Blankenstein T, et al. Expression of interleukin 10 in human melanoma. Br J Cancer 1994; 70:1182 - 5; http://dx.doi.org/10.1038/bjc.1994.469; PMID: 7981073
- Smith DR, Kunkel SL, Burdick MD, Wilke CA, Orringer MB, Whyte RI, et al. Production of interleukin-10 by human bronchogenic carcinoma. Am J Pathol 1994; 145:18 - 25; PMID: 8030748
- Conrad CT, Ernst NR, Dummer W, Bröcker EB, Becker JC. Differential expression of transforming growth factor beta 1 and interleukin 10 in progressing and regressing areas of primary melanoma. J Exp Clin Cancer Res 1999; 18:225 - 32; PMID: 10464712
- Allavena P, Piemonti L, Longoni D, Bernasconi S, Stoppacciaro A, Ruco L, et al. IL-10 prevents the differentiation of monocytes to dendritic cells but promotes their maturation to macrophages. Eur J Immunol 1998; 28:359 - 69; http://dx.doi.org/10.1002/(SICI)1521-4141(199801)28:01<359::AID-IMMU359>3.0.CO;2-4; PMID: 9485215
- De Smedt T, Van Mechelen M, De Becker G, Urbain J, Leo O, Moser M. Effect of interleukin-10 on dendritic cell maturation and function. Eur J Immunol 1997; 27:1229 - 35; http://dx.doi.org/10.1002/eji.1830270526; PMID: 9174615
- Enk AH, Angeloni VL, Udey MC, Katz SI. Inhibition of Langerhans cell antigen-presenting function by IL-10. A role for IL-10 in induction of tolerance. J Immunol 1993; 151:2390 - 8; PMID: 8103065
- Steinbrink K, Wölfl M, Jonuleit H, Knop J, Enk AH. Induction of tolerance by IL-10-treated dendritic cells. J Immunol 1997; 159:4772 - 80; PMID: 9366401
- Allavena P, Piemonti L, Longoni D, Bernasconi S, Stoppacciaro A, Ruco L, et al. IL-10 prevents the generation of dendritic cells from CD14+ blood monocytes, promotes the differentiation to mature macrophages and stimulates endocytosis of FITC-dextran. Adv Exp Med Biol 1997; 417:323 - 7; PMID: 9286381
- Buelens C, Verhasselt V, De Groote D, Thielemans K, Goldman M, Willems F. Interleukin-10 prevents the generation of dendritic cells from human peripheral blood mononuclear cells cultured with interleukin-4 and granulocyte/macrophage-colony-stimulating factor. Eur J Immunol 1997; 27:756 - 62; http://dx.doi.org/10.1002/eji.1830270326; PMID: 9079819
- Beckebaum S, Zhang X, Chen X, Yu Z, Frilling A, Dworacki G, et al. Increased levels of interleukin-10 in serum from patients with hepatocellular carcinoma correlate with profound numerical deficiencies and immature phenotype of circulating dendritic cell subsets. Clin Cancer Res 2004; 10:7260 - 9; http://dx.doi.org/10.1158/1078-0432.CCR-04-0872; PMID: 15534100
- Halliday GM, Le S. Transforming growth factor-beta produced by progressor tumors inhibits, while IL-10 produced by regressor tumors enhances, Langerhans cell migration from skin. Int Immunol 2001; 13:1147 - 54; http://dx.doi.org/10.1093/intimm/13.9.1147; PMID: 11526095
- Bachem A, Güttler S, Hartung E, Ebstein F, Schaefer M, Tannert A, et al. Superior antigen cross-presentation and XCR1 expression define human CD11c+CD141+ cells as homologues of mouse CD8+ dendritic cells. J Exp Med 2010; 207:1273 - 81; http://dx.doi.org/10.1084/jem.20100348; PMID: 20479115
- Crozat K, Guiton R, Contreras V, Feuillet V, Dutertre CA, Ventre E, et al. The XC chemokine receptor 1 is a conserved selective marker of mammalian cells homologous to mouse CD8alpha+ dendritic cells. J Exp Med 2010; 207:1283 - 92; http://dx.doi.org/10.1084/jem.20100223; PMID: 20479118
- Jongbloed SL, Kassianos AJ, McDonald KJ, Clark GJ, Ju X, Angel CE, et al. Human CD141+ (BDCA-3)+ dendritic cells (DCs) represent a unique myeloid DC subset that cross-presents necrotic cell antigens. J Exp Med 2010; 207:1247 - 60; http://dx.doi.org/10.1084/jem.20092140; PMID: 20479116
- Velten FW, Duperrier K, Bohlender J, Metharom P, Goerdt S. A gene signature of inhibitory MHC receptors identifies a BDCA3(+) subset of IL-10-induced dendritic cells with reduced allostimulatory capacity in vitro. Eur J Immunol 2004; 34:2800 - 11; http://dx.doi.org/10.1002/eji.200324732; PMID: 15368296
- de Gruijl TD, Sombroek CC, Lougheed SM, Oosterhoff D, Buter J, van den Eertwegh AJ, et al. A postmigrational switch among skin-derived dendritic cells to a macrophage-like phenotype is predetermined by the intracutaneous cytokine balance. J Immunol 2006; 176:7232 - 42; PMID: 16751366
- Diao J, Mikhailova A, Tang M, Gu H, Zhao J, Cattral MS. Immunostimulatory conventional dendritic cells evolve into regulatory macrophage-like cells. Blood 2012; 119:4919 - 27; http://dx.doi.org/10.1182/blood-2011-11-392894; PMID: 22490680
- Chen F, Hou M, Ye F, Lv W, Xie X. Ovarian cancer cells induce peripheral mature dendritic cells to differentiate into macrophagelike cells in vitro. Int J Gynecol Cancer 2009; 19:1487 - 93; http://dx.doi.org/10.1111/IGC.0b013e3181bb70c6; PMID: 19955923
- Gerlini G, Tun-Kyi A, Dudli C, Burg G, Pimpinelli N, Nestle FO. Metastatic melanoma secreted IL-10 down-regulates CD1 molecules on dendritic cells in metastatic tumor lesions. Am J Pathol 2004; 165:1853 - 63; http://dx.doi.org/10.1016/S0002-9440(10)63238-5; PMID: 15579430
- Gros A, Turcotte S, Wunderlich JR, Ahmadzadeh M, Dudley ME, Rosenberg SA. Myeloid cells obtained from the blood but not from the tumor can suppress T-cell proliferation in patients with melanoma. Clin Cancer Res 2012; 18:5212 - 23; http://dx.doi.org/10.1158/1078-0432.CCR-12-1108; PMID: 22837179
- Domínguez-Soto A, Sierra-Filardi E, Puig-Kröger A, Pérez-Maceda B, Gómez-Aguado F, Corcuera MT, et al. Dendritic cell-specific ICAM-3-grabbing nonintegrin expression on M2-polarized and tumor-associated macrophages is macrophage-CSF dependent and enhanced by tumor-derived IL-6 and IL-10. J Immunol 2011; 186:2192 - 200; http://dx.doi.org/10.4049/jimmunol.1000475; PMID: 21239715
- Metharom P, Velten FW, Goerdt S. Highly phagocytic, CD4hi, CD14hi and CD16hi antigen-presenting cells modulated by tumour-conditioned media retain the capacity to mature and induce TH1 T-cell proliferation. Mol Immunol 2006; 43:2070 - 82; http://dx.doi.org/10.1016/j.molimm.2005.12.008; PMID: 16455138
- Raes G, De Baetselier P, Van Ginderachter JA. Clinical and fundamental aspects of monocyte, macrophage and dendritic cell plasticity. Eur J Immunol 2012; 42:13 - 6; http://dx.doi.org/10.1002/eji.201190081; PMID: 22213043
- Heusinkveld M, de Vos van Steenwijk PJ, Goedemans R, Ramwadhdoebe TH, Gorter A, Welters MJ, et al. M2 macrophages induced by prostaglandin E2 and IL-6 from cervical carcinoma are switched to activated M1 macrophages by CD4+ Th1 cells. J Immunol 2011; 187:1157 - 65; http://dx.doi.org/10.4049/jimmunol.1100889; PMID: 21709158
- Oosterhoff D, Lougheed S, van de Ven R, Lindenberg JJ, van Cruijsen H, Hiddingh L, et al. Tumor-mediated inhibition of human dendritic cell differentiation and function is consistently counteracted by combined p38 MAPK and STAT3 inhibition. Oncoimmunology 2012; 1:649 - 58; http://dx.doi.org/10.4161/onci.20365; PMID: 22934257
- Sombroek CC, Stam AG, Masterson AJ, Lougheed SM, Schakel MJ, Meijer CJ, et al. Prostanoids play a major role in the primary tumor-induced inhibition of dendritic cell differentiation. J Immunol 2002; 168:4333 - 43; PMID: 11970975
- Obermajer N, Muthuswamy R, Lesnock J, Edwards RP, Kalinski P. Positive feedback between PGE2 and COX2 redirects the differentiation of human dendritic cells toward stable myeloid-derived suppressor cells. Blood 2011; 118:5498 - 505; http://dx.doi.org/10.1182/blood-2011-07-365825; PMID: 21972293
- Ouwehand K, Oosterhoff D, Breetveld M, Scheper RJ, de Gruijl TD, Gibbs S. Irritant-induced migration of Langerhans cells coincides with an IL-10-dependent switch to a macrophage-like phenotype. J Invest Dermatol 2011; 131:418 - 25; http://dx.doi.org/10.1038/jid.2010.336; PMID: 21068755
- Chu CC, Ali N, Karagiannis P, Di Meglio P, Skowera A, Napolitano L, et al. Resident CD141 (BDCA3)+ dendritic cells in human skin produce IL-10 and induce regulatory T cells that suppress skin inflammation. J Exp Med 2012; 209:935 - 45; http://dx.doi.org/10.1084/jem.20112583; PMID: 22547651
- Torres-Aguilar H, Aguilar-Ruiz SR, González-Pérez G, Munguía R, Bajaña S, Meraz-Ríos MA, et al. Tolerogenic dendritic cells generated with different immunosuppressive cytokines induce antigen-specific anergy and regulatory properties in memory CD4+ T cells. J Immunol 2010; 184:1765 - 75; http://dx.doi.org/10.4049/jimmunol.0902133; PMID: 20083662
- Li X, Yang A, Huang H, Zhang X, Town J, Davis B, et al. Induction of type 2 T helper cell allergen tolerance by IL-10-differentiated regulatory dendritic cells. Am J Respir Cell Mol Biol 2010; 42:190 - 9; http://dx.doi.org/10.1165/rcmb.2009-0023OC; PMID: 19372244
- Mantovani A, Sica A, Sozzani S, Allavena P, Vecchi A, Locati M. The chemokine system in diverse forms of macrophage activation and polarization. Trends Immunol 2004; 25:677 - 86; http://dx.doi.org/10.1016/j.it.2004.09.015; PMID: 15530839
- Herr B, Zhou J, Werno C, Menrad H, Namgaladze D, Weigert A, et al. The supernatant of apoptotic cells causes transcriptional activation of hypoxia-inducible factor-1alpha in macrophages via sphingosine-1-phosphate and transforming growth factor-beta. Blood 2009; 114:2140 - 8; http://dx.doi.org/10.1182/blood-2009-01-201889; PMID: 19549990
- Ramanathapuram LV, Hopkin D, Kurago ZB. Dendritic Cells (DC) Facilitate Detachment of Squamous Carcinoma Cells (SCC), While SCC Promote an Immature CD16(+) DC Phenotype and Control DC Migration. Cancer Microenviron 2011; In press http://dx.doi.org/10.1007/s12307-011-0077-4; PMID: 21809059
- Poulin LF, Salio M, Griessinger E, Anjos-Afonso F, Craciun L, Chen JL, et al. Characterization of human DNGR-1+ BDCA3+ leukocytes as putative equivalents of mouse CD8alpha+ dendritic cells. J Exp Med 2010; 207:1261 - 71; http://dx.doi.org/10.1084/jem.20092618; PMID: 20479117
- Koutsi A, Papapanagiotou A, Papavassiliou AG. Thrombomodulin: from haemostasis to inflammation and tumourigenesis. Int J Biochem Cell Biol 2008; 40:1669 - 73; http://dx.doi.org/10.1016/j.biocel.2007.06.024; PMID: 17709273
- Conway EM, Pollefeyt S, Collen D, Steiner-Mosonyi M. The amino terminal lectin-like domain of thrombomodulin is required for constitutive endocytosis. Blood 1997; 89:652 - 61; PMID: 9002969
- Bansal K, Sinha AY, Ghorpade DS, Togarsimalemath SK, Patil SA, Kaveri SV, et al. Src homology 3-interacting domain of Rv1917c of Mycobacterium tuberculosis induces selective maturation of human dendritic cells by regulating PI3K-MAPK-NF-kappaB signaling and drives Th2 immune responses. J Biol Chem 2010; 285:36511 - 22; http://dx.doi.org/10.1074/jbc.M110.158055; PMID: 20837474
- Yerkovich ST, Roponen M, Smith ME, McKenna K, Bosco A, Subrata LS, et al. Allergen-enhanced thrombomodulin (blood dendritic cell antigen 3, CD141) expression on dendritic cells is associated with a TH2-skewed immune response. J Allergy Clin Immunol 2009; 123:209 - 16, e4; http://dx.doi.org/10.1016/j.jaci.2008.09.009; PMID: 18947863
- Iwata-Kajihara T, Sumimoto H, Kawamura N, Ueda R, Takahashi T, Mizuguchi H, et al. Enhanced cancer immunotherapy using STAT3-depleted dendritic cells with high Th1-inducing ability and resistance to cancer cell-derived inhibitory factors. J Immunol 2011; 187:27 - 36; http://dx.doi.org/10.4049/jimmunol.1002067; PMID: 21632716
- Sumpter TL, Thomson AW. The STATus of PD-L1 (B7-H1) on tolerogenic APCs. Eur J Immunol 2011; 41:286 - 90; http://dx.doi.org/10.1002/eji.201041353; PMID: 21267998
- Wölfle SJ, Strebovsky J, Bartz H, Sähr A, Arnold C, Kaiser C, et al. PD-L1 expression on tolerogenic APCs is controlled by STAT-3. Eur J Immunol 2011; 41:413 - 24; http://dx.doi.org/10.1002/eji.201040979; PMID: 21268011
- Baars A, Claessen AM, van den Eertwegh AJ, Gall HE, Stam AG, Meijer S, et al. Skin tests predict survival after autologous tumor cell vaccination in metastatic melanoma: experience in 81 patients. Ann Oncol 2000; 11:965 - 70; http://dx.doi.org/10.1023/A:1008363601515; PMID: 11038032
- Yssel H, De Vries JE, Koken M, Van Blitterswijk W, Spits H. Serum-free medium for generation and propagation of functional human cytotoxic and helper T cell clones. J Immunol Methods 1984; 72:219 - 27; http://dx.doi.org/10.1016/0022-1759(84)90450-2; PMID: 6086760
- Santegoets SJ, Schreurs MW, Masterson AJ, Liu YP, Goletz S, Baumeister H, et al. In vitro priming of tumor-specific cytotoxic T lymphocytes using allogeneic dendritic cells derived from the human MUTZ-3 cell line. Cancer Immunol Immunother 2006; 55:1480 - 90; http://dx.doi.org/10.1007/s00262-006-0142-x; PMID: 16468034
- Thijssen VL, Hulsmans S, Griffioen AW. The galectin profile of the endothelium: altered expression and localization in activated and tumor endothelial cells. Am J Pathol 2008; 172:545 - 53; http://dx.doi.org/10.2353/ajpath.2008.070938; PMID: 18202194