Abstract
The immune system plays an important role in shaping the clinical course of colorectal cancer (CRC). However, it is still unclear how the immune infiltrates of primary CRC lesions and distant metastases by immune effector cells are related to each other. To address this issue, we quantified CD3+, CD8+ and granzyme B+ lymphocytes in primary CRC samples and corresponding liver metastases. This analysis showed that the prognostic predictions that can be drawn from the infiltration of immune cells in primary CRCs and their metastases are heterogeneous. To investigate whether such heterogeneity would also be observed within CRC hepatic metastases, the density of the immune infiltrate and cytokine production were assessed in opposite sides of the same metastatic lesion. In addition, tumor-infiltrating lymphocytes were assessed in sequential sections of the same metastatic lesion, with a spacing of 30 μm. In summary, consistent cell counts and cytokine levels were detected within the same lesion. The study of a case of synchronous metastases, however, suggested that different metastatic lesions within the same patient may be heterogeneous, perhaps indicating a major impact for local causes on tumor infiltration by immune cells. In summary, our study demonstrates a consistent degree of heterogeneity between primary tumors and hepatic metastases but an excellent intra-lesional homogeneity. These findings may be of key importance for patient stratification and the development of personalized strategies against CRC.
Introduction
The occurrence of liver metastases in patients affected by colorectal cancer (CRC) typically heralds a bad prognosis. Despite consistent therapeutic improvements that have been achieved over the last decade, the average survival for patients bearing inoperable or diffuse hepatic metastases is around 24 months.Citation1 As these patients are typically treated with palliative chemotherapy, the cost on their quality of life is very high. In addition, first-line therapies against CRC have been associated with rates are around 50–60%.Citation2,Citation3 It is therefore crucial to identify parameters that predict chemotherapeutic responses in these patients. We have recently reported an analysis of immune cell infiltration in specimens from CRC hepatic metastases and their relationship with disease outcome upon treatment.Citation4 As recent data obtained in lung metastases suggest, the density of tumor-infiltrating lymphocytes may be similar in primary lesions and distant metastases. The immune infiltrate is recognized as an important parameter that determine the clinical course of CRC patients.Citation5-Citation11 In particular, the presence of high levels of effector T cells has been repeatedly identified as a key prognostic factor.Citation12-Citation17 However, fundamental differences exist in the local microenvironment of primary tumors and their metastases, especially in the case of CRC hepatic metastases.Citation18-Citation20
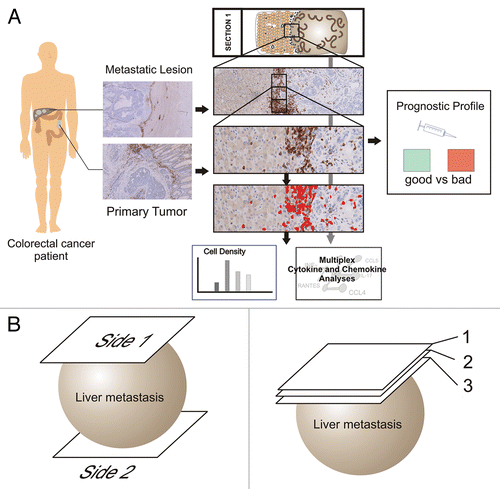
With respect to the prognostic value of the immune cell infiltrate, it is still unclear whether primary CRC lesions and their hepatic metastases contain a similar immune infiltrate. In other words: would it be possible to derive the immune signatures of hepatic metastases by studying primary lesions? To get further insights into this issue, we addressed four questions that are crucial for the determination of immunological profiles. First, is there a positional heterogeneity with regard to the density of the immune infiltrate? That is, is the density of the immune infiltrate on opposite sides of the same metastatic lesion similar or not? Second, is the density of the immune infiltrate similar in different sections of the same metastasis? Third, is the cytokine and chemokine profile observed on opposite sides of the same metastatic lesion concordant? Forth, is the immune profile of concurring hepatic metastases always homogeneous? Our analytical approach is depicted in .
Figure 1. Analytical steps. (A) Workflow for immune cell quantification, cytokine analysis and subsequent generation of a prognostic profile. (B) Analysis of opposite sides of a metastatic lesion. (C) Analysis of serial sections of a metastatic lesion.
Results
Average CD3+ cell densities converge during the analysis of larger tissue areas
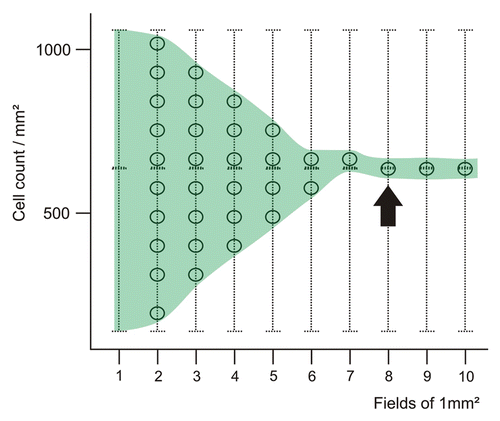
In a stepwise approach, we quantified CD3+ T cells in primary CRC lesions, increasing the number of evaluated fields, using an imaginary overlaying grid. Beginning with a single field of 1 mm2, numerous randomly selected fields from the complete section were added, and the resulting average cell density was noted. Typically, after analyzing five or more fields, the measured average cell density reached a point after which the analysis of additional fields did not change the average value significantly (). Further detailed studies will determine the “minimal required tissue area for analysis” for each staining. A precise definition of this parameter would indeed allow for precisely planning tissue requirements for immunohistochemical studies and—as a consequence—for determining the size of patient cohorts to be involved in investigational clinical trials.
Figure 2. Convergence of the average cell number with increasing surface tissue area. The circles on the vertical lines indicate the possible resulting average cell number. Increasing the number of analyzed 1 mm2 fields (as indicated on the x-axis) results in a stabilization of the average cell number for a given tissue section.
The immune infiltrate of primary CRC lesions and corresponding hepatic metastases are heterogeneous
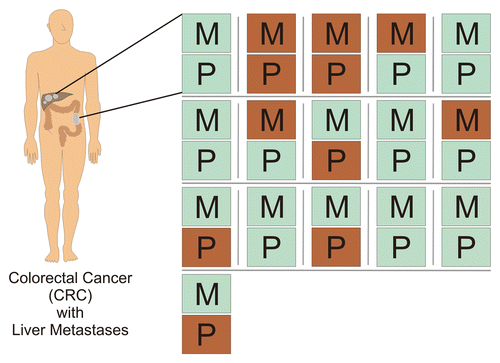
A set of 16 pairs of samples was used for this analysis, consisting of 16 primary CRC lesions and corresponding hepatic metastases (from the same patients). The intensity of the immune infiltrate in primary tumors and the corresponding metastases is reported in . depicts four examples from this data set, showing the three parameters that we have investigate (i.e., the abundance of CD3+, CD3+ and granzyme B+ cells) for each pair. To exemplify the prognostic relevance of the immune infiltrates in this setting, shows the differences between the density of the immune infiltrate for these paired specimens based on a favorable or unfavorable prognostic signature related to the center of primary lesions and the invasive margins of metastases. Data on the center of metastatic lesions were excluded as it has previously been shown that the density of immune cells in this compartment and clinical outcome fail to correlate.Citation4 In general, the numbers of lymphocytes infiltrating the core of metastatic lesions are rather low, especially as compared the abundance of T cells infiltrating primary lesions. Galon et al. have shown that the invasive margins of primary CRC lesions can be studied to obtain prognostic information linked to the tumor core, that is, to determine if the lesion exhibit a favorable or unfavorable immunological profile, yet with different cut-off values.Citation15 We used these cut-off values for the cores of primary lesions the cut-off values as defined by Halama et al. for hepatic metastases.Citation4
Table 1. Cell densities in primary tumors and metastases
Figure 3. Immune cell infiltration of primary colorectal carcinoma lesions and hepatic colorectal carcinoma metastases. (A–D) Triangles represent the amount of CD3+,CD8+ and granzyme B+ cells detected in primary tumors and the corresponding metastasis. All axes show cell density (cells/mm2) and have the same scale.
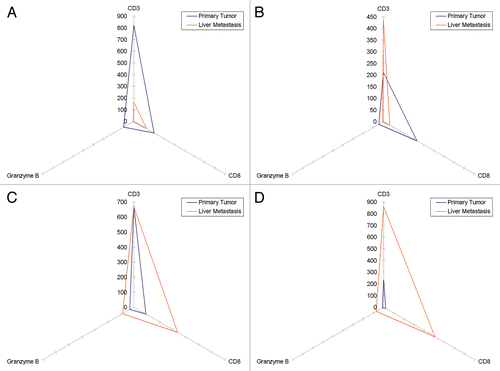
Figure 4. Prognostic signature of immune cell infiltration in primary colorectal carcinoma lesions and hepatic colorectal carcinoma metastases. CD3+,CD8+ and granzyme B+ cell densities were translated into a favorable (good) or unfavorable (bad) prognostic signature as described by Galon et al. and Halama et al. Each of presented doublets (P, primary tumor; M, metastasis) represents the samples of a single patient. Green, favorable signature; Red, unfavorable signature.
The immune infiltrate of metastatic lesions is homogeneous across serial tumor sections
By comparing three serial tissue sections with a spacing of 30 μm between adjacent slides (), we observed an elevated degree of homogeneity in immune cell infiltration. A variation of 3–5% across all three sections was noted (Sperman’s correlation coefficient R = 0.95, p = 0.002,), which persisted when all three layers (1 to 2, 1 to 3 and 2 to 3) were compared.
The density of the immune infiltrate on opposite sides of metastatic lesions is nearly identical
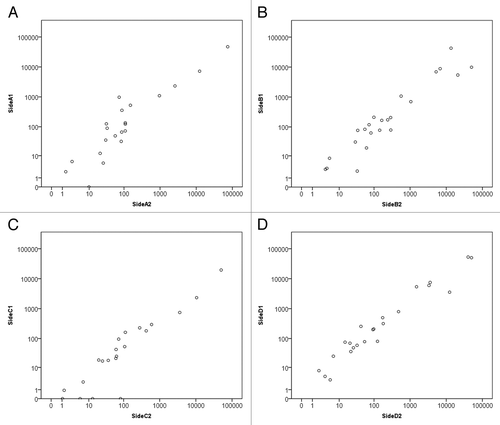
Comparing whole slide sections from opposite sides of the same hepatic CRC metastases () revealed a high concordance of immune infiltration (details can be found in ). A variation of 5–10% was noted, with a Spearman’s correlation coefficient of R = 0.9 (p = 0.001). These data indicate that the amount of immune cells infiltrating single lesions is homogeneous, provided that it is evaluated on a sufficient tissue surface. Thus, the quantification of the immune infiltrate in a single tumor section can be taken as representative for the whole lesion.
Table 2. TNM classification and prognostic profile (based on immune cell densities)*
Cytokines and chemokines in opposite zones of metastatic lesions are nearly identical
Comparing fresh frozen tissue from opposite sides of the same metastatic lesions revealed a high concordance in terms of cytokine and chemokine levels. The following cytokines were measured in two metastatic lesions: interleukin (IL)-1α, IL-2Rα, IL-3, IL-12p40, IL-16, IL-18, interferon α2 (IFNα2), CCL7 (MCP-3), CCL27 (CTACK), CXCL1 (GROα), CXCL9 (MIG), CXCL12 (SDF1α), CLEC11A (SCGF), KIT ligand (KITL, also known as SCF), hepatocyte growth factor (HGF), nerve growth factor (NGF), leukemia inhibitory factor (LIF), macrophage colony-stimulating factor (M-CSF), macrophage migration inhibitory factor (MIF), tumor necrosis factor β (TNFβ) and TNF-related apoptosis-inducing ligand (TRAIL). In additional two lesions, the levels of the same cytokines and chemokines were measured plus those of intercellular adhesion molecule 1 (ICAM1) and vascular cell adhesion molecule 1 (VCAM1). Spearman’s correlation coefficients revealed a strong homogeneity between the two sides of the same metastatic lesion (), with a median absolute difference between of 70 pg/mL. Of note, each of these lesions was from a distinct patient.
Figure 5. Correlation between cytokine profiles detected on opposite sides of hepatic metastases. (A–D) Scatterplots of four different hepatic metastases from four different patients Units displayed on both axes are pg/mL (logarithmic scale) and each axis represents a different side of the lesion, with each spot representing a single analyte. Spearman’s correlation coefficients (Rs) were calculated for each of the four data sets, yielding the following statistics. (A) Rs = 0.882, p = 0.0001; (B) Rs = 0.922, p = 0.0001; (C) Rs = 0.9, p = 0.0001; (D) Rs = 0.975, p = 0.0001. Samples (A) and (C) were analyzed for 21 analytes, samples (B) and (D) for 23 (for the detailed list of analytes, please see the Results section).
The immunological profiles of two synchronous metastases can be heterogeneous
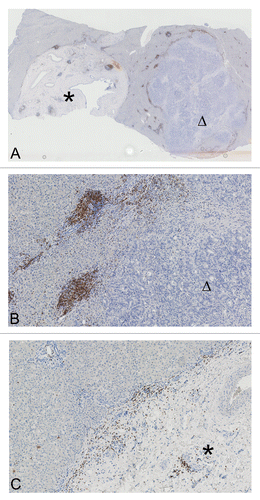
No material from large patient cohorts was available, but a case of synchronous hepatic metastases revealed a possible heterogeneity in this setting. The patient had not received any chemotherapy or other medical treatment and went directly to surgery for two synchronous hepatic metastases from CRC. Histological studies revealed that the metastatic lesions themselves as well as the immune cells infiltrating their invasive margin differed (). The pathological diagnosis of hepatic CRC metastases was confirmed by conventional analyses performed at the local Institute of Pathology. No other primary malignancies were identified and—upon surgical tumor resection—the patient was treated according to the standard protocols for CRC.
Figure 6. (A) Heterogeneity of synchronous hepatic metastases of colorectal carcinoma. Overview image of two synchronous hepatic metastases of colorectal carcinoma stained for CD3+ cells, showing a liver section with two round metastases (marked with an asterisk and a triangle, magnification 1.5×). (B) Magnification (10×) of the right metastatic lesion in (A) (triangle). CD3+ cell infiltrates are clearly discernible at the invasive margin and in the adjacent liver. (C) Magnification (10×) of the left metastatic lesion in (A) (asterisk). CD3+ cell infiltrates at the invasive margin are scarce, tumor cells accumulate at the same location, and the core of lesion exhibits large arterial vessels but mainly consists of stromal components.
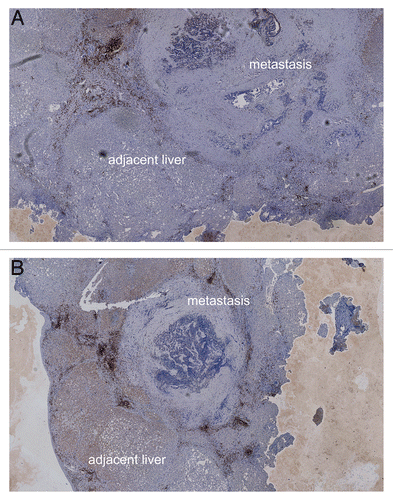
Although this finding is highly interesting, two other cases of synchronous liver metastases were comparatively more homogeneous with regard to the density of immune cell infiltration at the invasive margin ( and ). Also in this case, no other primary malignancies were identified and patients received standard therapies.
Figure 7. Homogeneity of synchronous hepatic metastases of colorectal carcinoma. (A and B) Overview image (2.5× magnification) of synchronous hepatic metastases of colorectal carcinoma stained for CD3+ cells. In this case, CD3+ cell infiltration in both metastases is comparable.
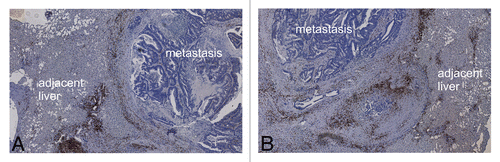
Figure 8. Homogeneity of synchronous hepatic metastases of colorectal carcinoma. (A and B) Overview image (2.5× magnification) of synchronous hepatic metastases of colorectal carcinoma stained for CD3+ cells. In this case, CD3+ cell infiltration in both metastases is comparable.
Discussion
In CRC patients, the density and profile (“good” vs. “bad”) of immune cells infiltrating the primary tumor and metastases influence prognosis and treatment outcome.Citation4,Citation10,Citation15,Citation21 To improve patient care, especially in the case of CRC patients bearing advanced, metastatic disease, the robustness of clinical predictors is of highest priority. The quantification of immune cell infiltrate as an indicator of the local immunological microenvironment has great potential in this sense.
Still, it is still unclear how the density of immune cells infiltrating primary CRC lesions and hepatic CRC metastases correlated and whether it is possible to obtain information on the immune infiltrate of metastases (and hence attempt a prognostic estimation) based on data collected in primary lesions. We observed a very heterogeneous distribution between the amounts of immune cells infiltrating primary tumors and metastatic lesions. Thus, in some cases, the infiltration of primary lesions and metastases by a given cell subtype was very similar, whereas in other cases, the density of the same immune cell type was rather different. Moreover, not always reduced extents of tumor infiltration in the primary tumor had parallel in metastases. The frequency of this heterogeneity could not be estimated in a large patient cohort, and 16 cases are too few for robust correlative statistics. We clearly observed a heterogeneity, but we cannot conclude on how often such a heterogeneity between primary tumors and metastases occurs. Similar studies in large cohorts of patients are required to obtain further insights into this issue.
We also wanted to assess how much the “good” or “bad” prognostic profiles of primary lesions and metastases correspond. Again, we observed a considerable heterogeneity. Thus, our findings indicate that it is not possible to predict the immunological profile of the hepatic metastases by analyzing only primary tumor lesions. Contrarily to the often high heterogeneity of primary lesions, single metastatic lesions displayed low internal variability in terms of immune cell density at the invasive margin, both across serial sections and at opposite anatomical sides.Citation16,Citation22 Even more surprising, complex cytokine profiles measured in different parts of the invasive margin of the same metastatic lesion were highly concordant to each other. Thus, the density of the immune infiltrate as well as the local cytokines and chemokines appear to be consistent at the invasive margins of a single lesion. The variability in the extent of cell infiltration across serial sections of the same hepatic metastases was also very low.
These findings suggest that individualized treatment approaches based on the local immune microenvironment are possible, but low levels of heterogeneity can only be expected if large tissue sections are evaluated. With smaller sections, heterogeneity increases and hence the analysis of limited tumor regions alone can lead to the misinterpretation of immunological profiles and the misclassification of patients.Citation22 Another issue relates to how the density of the immune infiltrate differ in distinct hepatic metastases of the same patient.
In a single case, we observed that the density of the immune infiltrate can vary across multiple hepatic metastases of the same patient. This perhaps stems from different malignant clones of the primary tumor that invade the liver simultaneously or at different time points. Such a heterogeneity in metastatic liver lesions is well known in medical oncology, as in response to chemotherapy a “mixed response” often occurs, with some lesions regressing and others progressing. The fact that these single metastatic lesions differentially respond to chemotherapy may be suggestive of a difference in their immunological profile. Data from mouse models and clinical observations suggest that tumor can trigger a variety of immune responses, including prominent immunosuppressive responses such as those driven by regulatory T cells and myeloid derived suppressor cells.Citation23-Citation25 Understanding which specific “immunological setup” leads to which specific pathway of “immune evasion” is an ongoing project. Another important issue that is raised by our results is whether host immune responses or the tumor biology define the density of immune cells infiltrating hepatic CRC metastases. As different metastatic lesions (infiltrated to different extents by immune cells) co-exist within the same patient, a tumor biology-linked cause for such a heterogeneity in immune infiltration (e.g., related to lymphangiogenesis) appears to be more plausible than a cause linked to the host immune system. As for effector T cells, a limited number of antigens within metastatic lesions may lead to a reduced infiltrate as metastatic cells are not efficiently recognized by T cells. Other explanations include sophisticated immune evasion mechanisms that are more developed in one specific metastatic lesion than in others. A key question here is whether the primary tumor already harbors different malignant cell clones or whether they arise on their way to metastatic sites. In addition to differences in tumor biology, there could be other (hitherto uncharacterized) factors within the seemingly homogeneous liver that account for the differential immune infiltration of two metastases, suggesting that an influence of the host in this process cannot be excluded. Indeed, in two additional cases of synchronous hepatic metastases within, the density of the immune infiltrate was concordant. As mentioned above, large patients cohort are required to reliably estimate the frequency of this phenomenon.
The finding that patients can bear an unfavorable immune infiltration in the primary tumor and a favorable on in metastases may indicate that there are multiple factors that influence the progression/selection of tumor cells that are on the way to metastasis. One possible explanation could relate to the selection of tumor cells that exhibit increased invasive properties while potently attracting immune cells. Moreover, the local microenvironment clearly plays a prominent role and for example differences between liver and lung metastases are obvious on a clinical as well as on a histological level. Thus, CRC patients bearing lung metastases typically have a better prognosis than similar patients bearing liver metastases. Moreover, there are fundamental differences in the composition of the immune infiltrate of lung and hepatic metastases.Citation26,Citation27
The main factors that guide decision making in oncology generally are the patient’s overall status and histological information as provided by pathologists, which offers great opportunities for improvement.Citation28-Citation30 We surmise that combined information on the immune infiltrate and/or cytokine profiles from multiple sites (primary tumors and metastatic lesions) will be the basis for better patient management. Understanding immunological tumor heterogeneity at different levels is important to reach this goal.
Materials and Methods
Patient material
Tissue samples were obtained from the Surgical Department of the University Hospital in Heidelberg and serial sections for immunohistochemistry were prepared from material provided by the tissue bank of the NCT Heidelberg. Written informed consent was obtained from all patients prior to analysis, after approval by the local ethics committee. lists the TNM classification and the corresponding concordance or discordance in immune cell classifications between primary tumors and hepatic metastases, as well as the timing of the diagnosis of the latter.
Immunohistochemistry
Tissue specimens were immunohistochemically analyzed for their infiltration by CD3+, CD8+ or granzyme B+ cells. Tissue sections (4 μm) were prepared from formalin-fixed, paraffin-embedded tissue. Upon deparaffinization and rehydration, slides were transferred to a fully automated staining facility (Leica BOND-MAX™, Leica Microsystems) to optimize comparability. The slides were boiled in 10 mM citrate buffer (pH 6) for 20 min to retrieve antigens. Endogenous peroxidase activity was quenched by incubation with 0.6% H2O2 in methanol for 10 min. Sections were blocked with 10% normal goat serum (Vectastain® Elite ABC kit, Vector). Mouse monoclonal antibodies recognizing human CD3ε (1:50 dilution, clone PS1, Acris), CD8 (1:40 dilution, clone 4B11, Novocastra) and granzyme B (1:50 dilution, clone 11F1, Novocastra) were applied as primary antibodies at room temperature for 30 min. Slides were then incubated with secondary antibody (rabbit-anti-mouse IgG, Bond Refine Detection Kit, Leica) for 8 min at room temperature. Further amplification of the signal was achieved through incubation with a third antibody, conjugated with horseradish peroxidase and coupled to dextrane molecules, for 8 min at room temperature (mouse-anti-rabbit IgG, Bond Refine Detection Kit, Leica). Revelation was performed by a colorimetric reaction with 3,3-di-amino-benzidine (DAB+ chromogen, Leica). Sections were counterstained with hematoxylin (Leica) and mounted with Aquatex (Merck).
Evaluation of immunohistochemical variables
The number of positively stained immune cells was counted using a computerized image analysis system consisting of a NDP Nanozoomer (Hamamatsu Photonics) and a personal computer. Complete microscopic images of full tissue sections were automatically obtained for later automatic or visual analysis (virtual microscopy), allowing large-scale histological evaluations with high precision across the complete section. In this analysis, the average cell density across the measured region as well as the individual density of cells for each mm2 of tissue analyzed was used. In metastases, the “invasive margin” was defined as a region of 500-µm width on each side of the border between malignant cells (“metastases” and peritumoral stroma) and the hepatic tissue. For primary tumors a similar approach was taken, but the whole center of the tumor was also analyzed. This approach is supported by the findings of Galon et al.Citation15 For this publication, we used the cut-off values for the center of the primary tumor of 370 CD3+, 80 CD8+, 80 CD45RO+ and 30 GZMB+ cells/mm2. For the invasive margins of hepatic metastases we used our own published data.Citation4 For primary tumor profiles, a good (or a bad) profile was assumed when two of the three markers were above (or below) given cut-off values, as suggested by Galon et al.Citation15 For details on the heterogeneity of these markers please consult ref. Citation22· Hepatic metastases were classified as having a good profile with a score of 3 and 4, and a score below 3 was considered as an indicator of bad profile. In the metastatic setting, no clear concordance between the density of the immune infiltrate at the invasive margin and the center of metastases was found.Citation16 Further data from 17 cases of CRC hepatic metastases corroborate this notion (see Table S1, Spearman’s correlation coefficient R = 0.39, p = 0.12).
All results are expressed as the mean of positively stained cells per mm2. Full sections were analyzed, with all evaluable tissue on the slide being used for quantification. Cell counts were performed with a dedicated software (VIS software suite, Visiopharm) to measure cell densities across a given region of interest (average = 10 mm2, max = 40 mm2) as previously reported.Citation4,Citation22,Citation31 All evaluations were visually checked for consistency.
Chemokine and cytokine detection in tissue lysates from dissected tissue sections
Tissues were sectioned and compartments (tumor tissue from hepatic metastasis) dissected using a vacutome (Microm HM550) and a modified Leica AS LMD system, when needed. Hemalaun staining was used on separate sections to identify regions of interest. After dissection, small pieces of frozen tissue were transferred in 250 μL cold lysis buffer, vortexed, frozen at −80°C (10 min) and thawed on ice. After incubation in a cold ultrasonic bath (10 min), samples were frozen again at −80°C, thawed on ice and centrifuged (13.000 rpm, 20 min, 4°C). The protein concentration of the supernatant was determined and the concentration of lysates was adjusted to 1 mg/mL using human serum diluent (BioRad). Cytokine and chemokine concentrations in tissue lysates and sera were quantified by multiplex protein arrays, according to manufacturer’s instructions (BioRad Laboratories).
Statistical analyses
To estimate correlation between cell populations or cytokine levels between different sides of the same lesion, non-parametric Spearman’s rank correlation tests were computed on SPSS 19.0 (IBM) ().
Table 3. TNM classification and cytokine profile*
Additional material
Download Zip (71.9 KB)Disclosure of Potential Conflicts of Interest
No potential conflicts of interest were disclosed.
Notes
† These authors contributed equally to this work.
Related Research Data
References
- Kopetz S, Chang GJ, Overman MJ, Eng C, Sargent DJ, Larson DW, et al. Improved survival in metastatic colorectal cancer is associated with adoption of hepatic resection and improved chemotherapy. J Clin Oncol 2009; 27:3677 - 83; http://dx.doi.org/10.1200/JCO.2008.20.5278; PMID: 19470929
- Alberts SR, Wagman LD. Chemotherapy for colorectal cancer liver metastases. Oncologist 2008; 13:1063 - 73; http://dx.doi.org/10.1634/theoncologist.2008-0142; PMID: 18838438
- Van Cutsem E, Köhne CH, Hitre E, Zaluski J, Chang Chien CR, Makhson A, et al. Cetuximab and chemotherapy as initial treatment for metastatic colorectal cancer. N Engl J Med 2009; 360:1408 - 17; http://dx.doi.org/10.1056/NEJMoa0805019; PMID: 19339720
- Halama N, Michel S, Kloor M, Zoernig I, Benner A, Spille A, et al. Localization and density of immune cells in the invasive margin of human colorectal cancer liver metastases are prognostic for response to chemotherapy. Cancer Res 2011; 71:5670 - 7; http://dx.doi.org/10.1158/0008-5472.CAN-11-0268; PMID: 21846824
- Deschoolmeester V, Baay M, Van Marck E, Weyler J, Vermeulen P, Lardon F, et al. Tumor infiltrating lymphocytes: an intriguing player in the survival of colorectal cancer patients. BMC Immunol 2010; 11:19; http://dx.doi.org/10.1186/1471-2172-11-19; PMID: 20385003
- Katz SC, Pillarisetty V, Bamboat ZM, Shia J, Hedvat C, Gonen M, et al. T cell infiltrate predicts long-term survival following resection of colorectal cancer liver metastases. Ann Surg Oncol 2009; 16:2524 - 30; http://dx.doi.org/10.1245/s10434-009-0585-3; PMID: 19568816
- Menon AG, Janssen-van Rhijn CM, Morreau H, Putter H, Tollenaar RAEM, van de Velde CJH, et al. Immune system and prognosis in colorectal cancer: a detailed immunohistochemical analysis. Lab Invest 2004; 84:493 - 501; http://dx.doi.org/10.1038/labinvest.3700055; PMID: 14968119
- Ohtani H. Focus on TILs: prognostic significance of tumor infiltrating lymphocytes in human colorectal cancer. Cancer Immun 2007; 7:4; PMID: 17311363
- Okano K, Maeba T, Moroguchi A, Ishimura K, Karasawa Y, Izuishi K, et al. Lymphocytic infiltration surrounding liver metastases from colorectal cancer. J Surg Oncol 2003; 82:28 - 33; http://dx.doi.org/10.1002/jso.10188; PMID: 12501166
- Pagès F, Berger A, Camus M, Sanchez-Cabo F, Costes A, Molidor R, et al. Effector memory T cells, early metastasis, and survival in colorectal cancer. N Engl J Med 2005; 353:2654 - 66; http://dx.doi.org/10.1056/NEJMoa051424; PMID: 16371631
- Pagès F, Galon J, Dieu-Nosjean MC, Tartour E, Sautès-Fridman C, Fridman WH. Immune infiltration in human tumors: a prognostic factor that should not be ignored. Oncogene 2010; 29:1093 - 102; http://dx.doi.org/10.1038/onc.2009.416; PMID: 19946335
- Pihl E, Nairn RC, Milne BJ, Cuthbertson AM, Hughes ES, Rollo A. Lymphoid hyperplasia: a major prognostic feature in 519 cases of colorectal carcinoma. Am J Pathol 1980; 100:469 - 80; PMID: 7406021
- Ropponen KM, Eskelinen MJ, Lipponen PK, Alhava E, Kosma VM. Prognostic value of tumour-infiltrating lymphocytes (TILs) in colorectal cancer. J Pathol 1997; 182:318 - 24; http://dx.doi.org/10.1002/(SICI)1096-9896(199707)182:3<318::AID-PATH862>3.0.CO;2-6; PMID: 9349235
- Diederichsen ACP, Hjelmborg Jv, Christensen PB, Zeuthen J, Fenger C. Prognostic value of the CD4+/CD8+ ratio of tumour infiltrating lymphocytes in colorectal cancer and HLA-DR expression on tumour cells. Cancer Immunol Immunother 2003; 52:423 - 8; http://dx.doi.org/10.1007/s00262-003-0388-5; PMID: 12695859
- Galon J, Costes A, Sanchez-Cabo F, Kirilovsky A, Mlecnik B, Lagorce-Pagès C, et al. Type, density, and location of immune cells within human colorectal tumors predict clinical outcome. Science 2006; 313:1960 - 4; http://dx.doi.org/10.1126/science.1129139; PMID: 17008531
- Halama N, Michel S, Kloor M, Zoernig I, Pommerencke T, von Knebel Doeberitz M, et al. The localization and density of immune cells in primary tumors of human metastatic colorectal cancer shows an association with response to chemotherapy. Cancer Immun 2009; 9:1; PMID: 19226101
- Prall F, Dührkop T, Weirich V, Ostwald C, Lenz P, Nizze H, et al. Prognostic role of CD8+ tumor-infiltrating lymphocytes in stage III colorectal cancer with and without microsatellite instability. Hum Pathol 2004; 35:808 - 16; http://dx.doi.org/10.1016/j.humpath.2004.01.022; PMID: 15257543
- Camus M, Tosolini M, Mlecnik B, Pagès F, Kirilovsky A, Berger A, et al. Coordination of intratumoral immune reaction and human colorectal cancer recurrence. Cancer Res 2009; 69:2685 - 93; http://dx.doi.org/10.1158/0008-5472.CAN-08-2654; PMID: 19258510
- Mlecnik B, Tosolini M, Charoentong P, Kirilovsky A, Bindea G, Berger A, et al. Biomolecular network reconstruction identifies T-cell homing factors associated with survival in colorectal cancer. Gastroenterology 2010; 138:1429 - 40; http://dx.doi.org/10.1053/j.gastro.2009.10.057; PMID: 19909745
- Halama N, Braun M, Kahlert C, Spille A, Quack C, Rahbari N, et al. Natural killer cells are scarce in colorectal carcinoma tissue despite high levels of chemokines and cytokines. Clin Cancer Res 2011; 17:678 - 89; http://dx.doi.org/10.1158/1078-0432.CCR-10-2173; PMID: 21325295
- Pagès F, Kirilovsky A, Mlecnik B, Asslaber M, Tosolini M, Bindea G, et al. In situ cytotoxic and memory T cells predict outcome in patients with early-stage colorectal cancer. J Clin Oncol 2009; 27:5944 - 51; http://dx.doi.org/10.1200/JCO.2008.19.6147; PMID: 19858404
- Halama N, Zoernig I, Spille A, Michel S, Kloor M, Grauling-Halama S, et al. Quantification of prognostic immune cell markers in colorectal cancer using whole slide imaging tumor maps. Anal Quant Cytol Histol 2010; 32:333 - 40; PMID: 21456345
- Jensen SM, Twitty CG, Maston LD, Antony PA, Lim M, Hu HM, et al. Increased frequency of suppressive regulatory T cells and T cell-mediated antigen loss results in murine melanoma recurrence. J Immunol 2012; 189:767 - 76; http://dx.doi.org/10.4049/jimmunol.1103822; PMID: 22723522
- Vincent J, Mignot G, Chalmin F, Ladoire S, Bruchard M, Chevriaux A, et al. 5-Fluorouracil selectively kills tumor-associated myeloid-derived suppressor cells resulting in enhanced T cell-dependent antitumor immunity. Cancer Res 2010; 70:3052 - 61; http://dx.doi.org/10.1158/0008-5472.CAN-09-3690; PMID: 20388795
- Ladoire S, Arnould L, Apetoh L, Coudert B, Martin F, Chauffert B, et al. Pathologic complete response to neoadjuvant chemotherapy of breast carcinoma is associated with the disappearance of tumor-infiltrating foxp3+ regulatory T cells. Clin Cancer Res 2008; 14:2413 - 20; http://dx.doi.org/10.1158/1078-0432.CCR-07-4491; PMID: 18413832
- Chua TC, Liauw W, Koong HN, Esquivel J. Surgical therapies in metastatic colorectal cancer with a potential for cure. Am J Clin Oncol 2011; 34:326 - 31; http://dx.doi.org/10.1097/COC.0b013e3181dbb9ad; PMID: 20498587
- Keim S, Zoernig I, Spille A, Lahrmann B, Brand K, Herpel E, et al. Sequential metastases of colorectal cancer: Immunophenotypes and spatial distributions of infiltrating immune cells in relation to time and treatments. Oncoimmunology 2012; 1:593 - 9; http://dx.doi.org/10.4161/onci.20179; PMID: 22934251
- Zitvogel L, Kepp O, Kroemer G. Immune parameters affecting the efficacy of chemotherapeutic regimens. Nat Rev Clin Oncol 2011; 8:151 - 60; http://dx.doi.org/10.1038/nrclinonc.2010.223; PMID: 21364688
- Zitvogel L, Kepp O, Aymeric L, Ma Y, Locher C, Delahaye NF, et al. Integration of host-related signatures with cancer cell-derived predictors for the optimal management of anticancer chemotherapy. Cancer Res 2010; 70:9538 - 43; http://dx.doi.org/10.1158/0008-5472.CAN-10-1003; PMID: 21098713
- Zitvogel L, Apetoh L, Ghiringhelli F, André F, Tesniere A, Kroemer G. The anticancer immune response: indispensable for therapeutic success?. J Clin Invest 2008; 118:1991 - 2001; http://dx.doi.org/10.1172/JCI35180; PMID: 18523649
- Halama N, Zoernig I, Spille A, Westphal K, Schirmacher P, Jaeger D, et al. Estimation of immune cell densities in immune cell conglomerates: an approach for high-throughput quantification. PLoS One 2009; 4:e7847; http://dx.doi.org/10.1371/journal.pone.0007847; PMID: 19924291