Abstract
Cultured DRGs in different gel scaffolds were analyzed using CARS microscopy to determine its possible use as a label-free imaging option for tracking cellular growth in a gel scaffold. This study demonstrates for the first time the applicability of CARS microscopy to the imaging of live neuronal cells in GAG hydrogels. By tuning the laser beating frequency, ωp − ωs, to match the vibration of C-H bonds in the cell membrane, the CARS signal yields detailed, high-quality images of neurites with single membrane detection sensitivity. The results demonstrate that CARS imaging allows monitoring of cellular growth in a tissue scaffold over time, with a contrast that shows comparable cellular structures to those obtained using standard fluorescent staining techniques. These findings show the potential of CARS microscopy to assist in the understanding of organogenesis processes in a tissue scaffold.
Introduction
With the increasing importance of regenerative medicine, the study of cellular proliferation, migration, and other processes in a 3-D construct is critical for the rapid advancement of tissue engineering. Microscopy provides a key tool to monitor cellular activities as a function of matrix properties. Histological and immunohistochemical staining methods have been the standard in imaging cell and tissue samples in vitro. While yielding detailed, high-quality images, and allowing visualization of specific cellular structures or proteins, histology and immunohistochemistry generally necessitate sample fixation, which inhibits dynamic study over time. Fluorescence microscopy has thus been extensively used to image live cells and tissues with the development of versatile probes. However, in light of the additional considerations required in fluorescence labeling, such as photobleaching or processing time, it is intriguing to explore label-free imaging techniques that provide specific contrast between the cells and the supporting matrix to track the growth or changes of live samples over long periods of time.
Recent advances in CARS microscopy have realized high-speed bond-selective chemical imaging of biological samples.Citation1–Citation5 CARS is a nonlinear optical process related to Raman scattering. The resonance CARS signal is generated when the frequency difference between a pump beam at ωp, and a Stokes beam at ωs, is tuned to match a Raman-active vibration.Citation6 The coherent nature and the focus of excitation energy on a single vibrational band render the CARS signal orders of magnitude stronger than a spontaneous Raman signal. CARS microscopy was first reported in 1982 with a non-collinear beam geometry,Citation7 and was revived in 1999 with a collinear beam geometry.Citation8 Since the development of laser-scanning CARS microscopy with near infrared picosecond pulse excitation,Citation9 various applications have been demonstrated. Specifically, CARS microscopy has been employed for label-free imaging of biological and biomedical samples including single lipid bilayers,Citation10–Citation12 native drug molecules,Citation13 axonal myelin sheath,Citation14–Citation16 lipid bodies,Citation17–Citation20 and lipid-related lesions.Citation21–Citation24 Furthermore, CARS microscopy has been employed for in vivo studies of skin,Citation25 sciatic nerve,Citation15 C. elegansCitation26,Citation27 and small intestine.Citation28 However, CARS imaging of cellular growth in a gel scaffold has not been explored to date.
In this study, we demonstrate the applicability of CARS microscopy to label-free imaging of live neuronal cells in GAG hydrogels. By tuning the laser beating frequency, ωp-ωs, to match the vibration of C–H bonds in the cell membrane, the CARS signals yield detailed, high-quality images of neurites with single membrane detection sensitivity. In addition, CARS imaging enabled us to monitor cell growth in a tissue scaffold over time. These findings show the promise of CARS microscopy to assist in the understanding of organogenesis processes in a tissue scaffold.
Results
Twenty four unstained DRGs (12 in 0.5% HA gels and 12 in 1% CS gels) were inspected by forward-detected CARS. exemplifies the contrast and detail possible with the resonant CARS signal from CH2 stretch vibrations. Live neurites at the proximity to the DRG body () and at the growth cone () were observed with a signal to background ratio above 4, as shown by the intensity profile in . We found that the gel background was largely contributed by the nonresonant CARS signal from water. Furthermore, the intensity profile shows that the lateral resolution, measured at full width at half maximum, was approximately 500 nm when the 40× objective was used (). With this resolution and single membrane detection sensitivity,Citation30,Citation31 individual neurites were observed over time using CARS imaging.
The inherent 3-D spatial resolution of CARS microscopy enabled us to examine the neurites at different depths, as shown in . Using optical sectioning, the distribution of neurites was visualized by changing the focal plane. Notably, although the CARS signal is only produced at the focal center, scattering of the incident laser beam by the neurites right below the focal plane reduced the level of CARS intensity from the gel. Consequently, negative contrast was observed at each depth. We were able to obtain CARS contrast from the neurites as deep as 500 µm into the gel. Importantly, although the sample has a thickness of 2 mm, we found the forward-detected CARS signal to be about 20 times stronger than the epi-detected CARS signal, and we have used forward-detection for the following studies.
To observe progression of neurite growth, CARS images of cell outgrowth were taken daily at the same location. shows representative images of neurite growth over time at an area near the DRG body in different hydrogel matrices. In one case, the distribution of the CARS signal from day 1 to day 3 shows a fan-shaped outward cell growth (). In other instances, an outgrowth pattern that appeared more linear () was observed. With each time point, increases in both neurite length and density were observed in our samples.
In addition to monitoring in situ neurite growth with time, the relative density of neurites was determined according to the intensity of the CARS signal (). Both increased outgrowth and increased cell density were observed from day 1 through day 3 (). The linear trend observed in the CARS signal intensity over these three time points implied that neurite growth had not reached a plateau by day 3 (). These results demonstrate the possibility of using CARS for quantitative assessment of neurite growth. It is important to note that, although we observed significant neurite growth and thus associated the signal increase with an increase in neurite density, it is uncertain how much of this signal increase may have potentially come from increases in the membrane thicknesses of individual neurites.
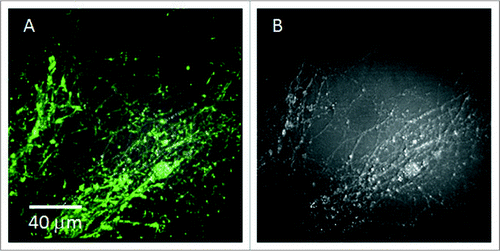
The morphological structure derived in CARS imaging was compared to those obtained with standard F-actin labeling. The confocal fluorescence image in and the CARS image in were acquired for comparison on a fixed, F-actin-labeled sample. The cell morphology in both images appears similar. Taking into consideration that the CARS imaging in the current study visualizes the cell membrane and/or lipid bodies, the similarity in overall morphology is likely due to the ubiquitous distribution of actin in cells. A detailed comparison revealed small discrepancies in local areas, possibly because the two imaging approaches target different molecules in the sample. The CARS contrast comes from lipid membranes and/or lipid bodies, while the phalloidin label targets F-actin that has been localized cytoplastically.
Discussion
The current study demonstrates the capability of CARS microscopy to image neuronal cell growth in a hydrogel. To visualize the cells, we tuned the laser beating frequency, ωp-ωs, to match the stretch vibration of C–H bonds. Because they are enriched in CH2 groups, the cell membranes largely contribute to the resonant CARS signal. Meanwhile, we also observed a weaker CARS signal from the gel, contributed by the C–H bonds in the 0.5% or 1.0% GAG matrix, and we observed the non-resonant CARS signal, mainly from water. Despite the background noise, our method is able to produce a clear contrast between the cells and the gel, with a signal to background ratio as high as 4, as shown in . In the CARS image of a fixed sample () the contrast was a bit less than that obtained from live samples. There are two possible reasons for the reduced CARS contrast. One is due to sample fixation with 4% paraformaldehyde, which increased the background signal from the gel, and the other is due to permeabilization of membranes during the labeling procedure, which reduced the resonant CARS signal from the cell membrane.
Our study demonstrates CARS as a viable tool for imaging 3-D matrix constructs without the use of labels. Label-free imaging is especially advantageous for imaging cells in gel matrices, where permeability of labels through these matrices becomes a concern. In addition, extended, fixation, washing and staining steps need to be performed during labeling to ensure adequate penetration into the matrix. Such procedures can be sub-optimal if the matrix is not hydrolytically stable, and degrades significantly during the fixation and staining processes.
It is notable that label-free CARS imaging enables time-lapse monitoring of a sample over long periods of time without the problems of photobleaching and phototoxicity. In addition, because laser-scanning and wide-field CARS microscopes allow fast imaging at 30 frames per second,Citation25,Citation32 it is promising to use CARS microscopy to resolve rapid events on the scale of minutes or seconds. Relatively long-term real-time monitoring can be performed with a cell culture chamber adapted with a common laser scanning microscope. From such studies, important information such as growth rate and cell migration can be derived.
It is also notable that multiplex CARS (M-CARS) is able to provide spectral information by utilizing a narrowband and a broadband excitation field.Citation33,Citation34 In M-CARS microscopy, not only vibrational imaging, but also simultaneous acquisition of a vibrational spectrum can be achieved. Raman line-shapes, hidden in the complex combination of spectrum contributions from different vibrational modes and non-resonant contribution, can be extracted with or without priori information of vibrational spectrum of each element.Citation19,Citation35–Citation37 Recent advances in fiber-based light sources have provided alternative ways for M-CARS implementations.Citation38–Citation41 M-CARS microscopy is generally implemented with a sample-scanning scheme that hinders high-speed imaging. To achieve high-speed vibrational imaging and fulfill fast spectral analysis at a specific location in the meantime, the combination of coherent Raman scattering microscopy and confocal Raman microspectroscopy, named compound Raman, has been developed.Citation27,Citation42 By employing the above technological advances, different elements in the gel scaffolds and tissue reconstructs could thus be precisely resolved.
Finally we would note that multimodal nonlinear optical imaging can be readily implemented on a CARS microscope either with picosecondCitation43,Citation44 or femtosecond excitation.Citation45,Citation46 The coupling of CARS with second harmonic generation would greatly enhance the capability of visualizing cells grown in a collagen matrix, such as immune cells in a collagen-infused hydrogel.Citation47 By coupling CARS with two-photon excited fluorescence from green fluorescent proteins, one could monitor the expression of specific proteins in specific location of cells in a 3-D culture. More importantly, a compact CARS microscope is becoming available with the development of fiber laser sources.Citation48–Citation50 In consideration of these opportunities, we expect CARS microscopy to be become a significant platform for tissue engineering research.
Materials and Methods
Polysaccharide-DTP conjugate synthesis.
Chondroitin-6-sulfate-3,3′-dithiobis(propanoic hydrazide) (CS-DTP) and hyaluronic acid-3,3′-dithiobis(propanoic hydrazide) (HA-DTP) conjugates were synthesized using the methods described by Shu and Prestwich.Citation29 Briefly, CS (avg. MW = 19.9 kDa, Sigma-Aldrich) or HA (avg. MW = 110 kDa, Genzyme Corp.,) were dissolved in Milli-Q water. DTP was added, and the pH was lowered to 4.75 through addition of 1 N HCl. After 90 minutes, the reaction was quenched by raising the pH to 7.0 by addition of 1 N NaOH. Dithiothreitol (Sigma-Aldrich) was added, the pH was raised to 8.5 by addition of 1 N NaOH, and the reaction was stirred for 24 hours. pH was lowered to 3.5 by addition of 1 N HCl, and the reaction was dialyzed against 0.3 mM HCl containing 100 mM NaCl for 2 weeks, followed by dialysis against 0.3 mM HCl for several days. Reaction products were then lyophilized and stored at −80°C under nitrogen until use. The degree of GAG modification was determined through NMR and an Ellman's assay, and found to be 60% for CS and 67% for HA.
Dorsal root ganglia culture.
Fertilized White Leghorn eggs were obtained from the Purdue Animal Sciences Research Farm. DRGs were dissected from day 8 embryos and stored in Puck's saline until use. DRGs were added using forceps to 100 µl of a solution of PEG-DA (MW = 3,400 Da, Sunbio Systems, Inc.,) crosslinker in Neurobasal medium (Invitrogen) modified with N2 supplement (100 µg/ml transferrin, 5 µg/ml insulin, 6.3 ng/ml progesterone, 16.11 µg/ml putrescine, 5.2 ng/ml selenite, Invitrogen), 5 µg/ml fibronectin (Invitrogen), 20 ng/ml NGF (Invitrogen), 0.1% BSA (Sera Care Life Sciences), 0.5 mM L-glutamine (Invitrogen), 25 µM L-glutamate (Calbiochem), and 1% Antibiotic-Antimycotic (Invitrogen), in 8-well chamber slides. One DRG was added per well. Then, 100-µl solutions of either CS-DTP or HA-DTP dissolved in modified Neurobasal medium were added to form solutions of either 0.5% (w/v) HA or 1% (w/v) CS. Samples were incubated for one hour at 37°C, 5% CO2, and humidified, until gelation occurred. 300 µl of modified Neurobasal medium was then added on top of the gels to prevent dehydration, and DRGs were incubated for 72 hours. For monitoring neuronal growth, CARS images were taken at 24, 48 and 72-hour timepoints.
Fluorescent staining.
After 72 hours of culture, DRGs were fixed with 4% paraformaldehyde in PBS, washed twice with PBS, then simultaneously fixed and stained using a solution of 0.1% Triton X-100 containing 1% BSA and 2.5% Alexa Fluor 488 phalloidin (Invitrogen) stock solution in PBS, and finally washed 3 times with PBS. Fixation, staining and washing steps were all allowed to incubate overnight at 4°C.
CARS microscopy and confocal imaging.
Both CARS and confocal imaging were performed using a laser scanning microscope (FV300/IX71, Olympus America). A 40× water immersion objective (LUMPlanFL, Olympus America) with a 0.8 numerical aperture and a working distance of 3.3 mm was used to focus laser beams for imaging.
For CARS imaging, two mode-locked 5-ps lasers (Tsunami, Spectra-Physics) operating at 80 MHz were synchronized through an electronic module controller (Lok-to-Clock, Spectra-Physics). The two lasers were parallel-polarized, collinearly combined, and sent into the microscope. The pump beam was tuned to ∼14,140 cm−1 (ωp) and the Stokes beam was tuned to ∼11,300 cm−1 (ωs), generating a frequency difference of ∼2,840 cm−1, which matches the symmetric CH2 stretch vibration for CARS imaging. The average powers of the pump and the Stokes beams were 40 mW and 20 mW, respectively, at the sample. External photomultiplier tube detectors (PMT, H7422–40, Hamamatsu, Japan) were installed for receiving signals in forward and backward directions (). The forward signal was collected using a 0.55 NA condenser, while the backward signal was collected with the 40× objective. Bandpass filters (600/65 nm, Ealing Catalog, Rocklin, CA) were used to transmit the CARS signal at approximately 588 nm.
For confocal microscopy, a 488 nm Argon ion laser was used for fluorescent imaging of the stained samples. Two bandpass emission filters centered at 520 nm with a bandwidth of 40 nm were used to transmit the fluorescence signal from the Alexa Fluor 488 phalloidin.
Quantitative analysis of neurite growth.
Relative density of neurites was measured according to the CARS signal. 3-D images of 60 µm were taken on day 1 to day 3 of growth. The images were then transferred to an 8-bit (256) gray scale, and a value of 26, which was calculated to be the mean intensity of the nonresonant CARS signal and electronic background, was deducted from each image. This deducted value was calculated according to the nonresonant signal from water, at an off-resonant frequency at around 2,840 cm−1. Three areas, designated according to the distribution of neurite growth for each of the three timepoints, were used for the signal analysis. Within these designated areas, the average total intensity of all pixels through all 60, 1-µm layers was obtained. The derived value represents the relative density of neuronal membrane mass within the entire 60-µm layer.
Abbreviations
| CARS | = | coherent anti-stokes raman scattering |
| GAG | = | glycosaminoglycan |
| DTP | = | 3,3′-dithiobis (propanoic hydrazide) |
| CS | = | chondroitin-6-sulfate |
| HA | = | hyaluronic acid |
| NMR | = | nuclear magnetic resonance |
| DRG | = | dorsal root ganglion |
| PEG-DA | = | poly(ethylene glycol) diacrylate |
| NGF | = | 2.5S nerve growth factor |
| PBS | = | phosphate buffered saline |
| BSA | = | bovine serum albumin |
| 2-D | = | two-dimensional |
| 3-D | = | three-dimensional |
Figures and Tables
Figure 1 Experimental approaches. (A) Schematic drawing of a CA RS microscope. The inset window shows the energy diagram of CA RS. ωp: pump frequency; ωs: Stokes frequency; DM: dichroic mirror; PMT: photomultiplier tube. (B) Schematic of the composition of the gel scaffolds for the growth of DRG neurites. The figure is not to scale.
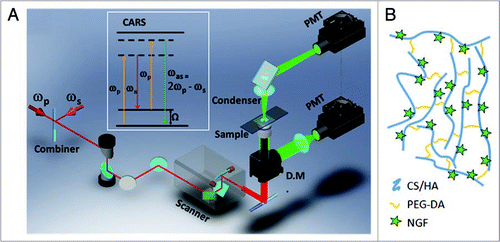
Figure 2 CA RS images of unstained live neurites growing from the DRG body cultured in 1% CS gel matrix. CA RS images of (A) live neurites at the proximity to the DRG body and (B) neurites and bulbs observed around the end of a neuronal growth cone. (C) Signal profile along a line indicated by the arrows in the inset image.
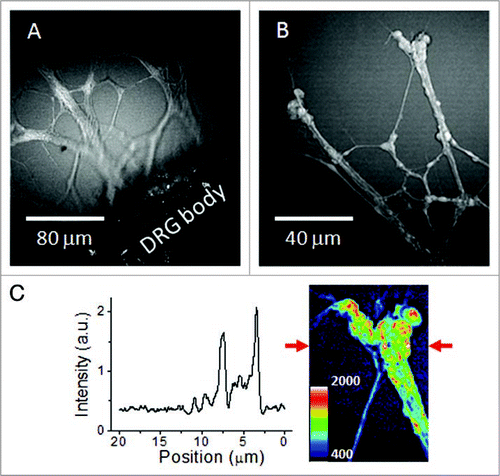
Figure 3 3-D structure of unstained neurites growing in a 1% CS gel matrix inspected by a laser-scanning CA RS microscope. Representative images at different depths show the 3-D distribution of the neurite growth. The number marked in each image indicates the depth relative to the bottom layer of neurite observed in the field of view.
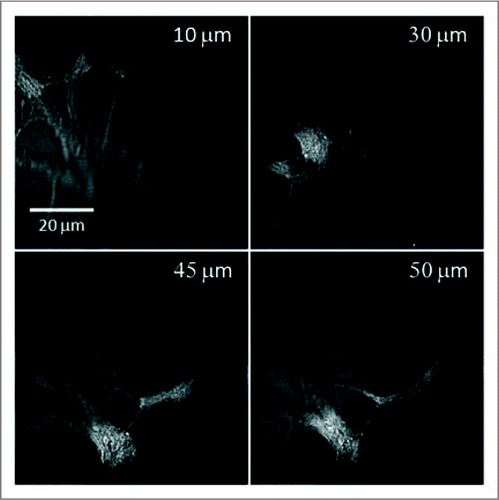
Figure 4 Monitoring growth of unstained neurites in hydrogels of 1% CS or 0.5% HA. (A–C) CA RS images of the neurite growth in a 1% CS matrix on day 1 to day 3. (D–E) images of the neurite growth in a 0.5% HA matrix on day 1 to day 3. The images are z-stacks of 15 µm in depth comprised of 16 optical sections. Arrows represent the direction of the neurite growth.
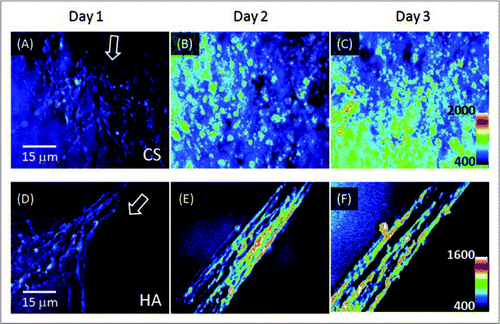
Figure 5 Analysis of CA RS signal of neurite growth: (A–C) In situ neurite growth in a 0.5% HA matrix on day 1 to day 3. (D) Relative density of neurites on day 1 through day 3. The analysis was performed according to the intensity in the 8-bit gray-scale 3-D images. Each data point represents the average number of the intensity results analyzed according to areas of three days (method).
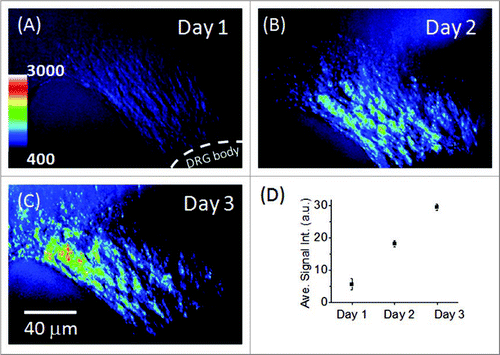
Figure 6 Phalloidin labeling of F-actin of neurites compared to CA RS images. (A) Overlaid image of signals from phalloidin labeling and CA RS. (B) CA RS image of the location shown in (A). The image exhibited lower contrast due to the higher non-resonant CARS signal resulting from the fixation of the sample.
Acknowledgements
This work was supported by NIHR01 grant EB007243 to Cheng and ABRC 0017 to Panitch.
References
- Evans CL, Xie XS. Coherent Anti-Stokes Raman Scattering Microscopy: Chemical Imaging for Biology and Medicine. Ann Rev Anal Chem 2008; 1:883 - 909
- Muller M, Zumbusch A. Coherent anti-Stokes Raman Scattering Microscopy. Chem Phys Chem 2007; 8:2156 - 2170
- Volkmer A. Vibrational imaging and microspectroscopies based on coherent anti-Stokes Raman scattering microscopy. J Phys D: Appl Phys 2005; 38:49 - 81
- Cheng JX. Coherent anti-stokes Raman scattering microscopy. Appl Spectroscopy 2007; 61:197 - 208
- Krafft C, Dietzek B, Popp J. Raman and CARS microspectroscopy of cells and tissues. The Analyst 2009; 134:1046 - 1057
- Levenson MD, Kano SS. Introduction to nonlinear laser spectroscopy 1988; San Diego Academic Press, Inc
- Duncan MD, Reintjes J, Manuccia TJ. Scanning coherent anti-Stokes Raman microscope. Opt Lett 1982; 7:350 - 352
- Zumbusch A, Holtom GR, Xie XS. Three-dimensional vibrational imaging by coherent anti-Stokes Raman scattering. Phys Rev Lett 1999; 82:4142 - 4145
- Cheng JX, Jia YK, Zheng G, Xie XS. Laser-scanning coherent anti-stokes Raman scattering microscopy and applications to cell biology. Biophys J 2002; 83:502 - 509
- Wurpel GWH, Schins JM, Müller M. Direct measurement of chain order in single phospholipid mono- and bilayers with multiplex CARS. J Phys Chem B 2004; 108:3400 - 3403
- Li L, Wang H, Cheng J-X. Quantitative coherent anti-stokes Raman scattering imaging of lipid distribution in coexisting domain. Biophys J 2005; 89:3480 - 3490
- Potma EO, Xie XS. Direct visualization of lipid phase segregation in single lipid bilayers with coherent anti-Stokes Raman scattering microscopy. Chem Phys Chem 2005; 6:77 - 79
- Kang E, Wang H, Kwon IK, Robinson J, Park K, Cheng JX. In situ Visualization of Paclitaxel Distribution and Release by Coherent Anti-Stokes Raman Scattering Microscopy. Anal Chem 2006; 78:8036 - 8043
- Wang H, Fu Y, Zickmund P, Shi R, Cheng JX. Coherent anti-stokes Raman scattering imaging of axonl myelin in live spinal tissues. Biophys J 2005; 89:581 - 591
- Huff TB, Cheng JX. In vivo coherent anti-Stokes Raman scattering imaging of sciatic nerve tissue. J Microscopy 2007; 225:190 - 197
- Fu Y, Sun W, Shi Y, Shi R, Cheng J-X. Glutamate Excitotoxicity Inflicts Paranodal Myelin Splitting and Retraction. PLoS ONE 2009; 4:6705
- Jurna M, Korterik JP, Otto C, Herek JL, Offerhaus HL. Background free CARS imaging by phase sensitive heterodyne CARS. Opt Express 2008; 16:15863 - 15869
- Rinia HA, Burger KNJ, Bonn M, Muller M. Quantitative Label-Free Imaging of Lipid Composition and Packing of Individual Cellular Lipid Droplets Using Multiplex CARS Microscopy. Biophys J 2008; 95:4908 - 4914
- Vartiainen EM, Rinia HA, Muller M, Bonn M. Direct extraction of Raman line-shapes from congested CARS spectra. Opt Express 2006; 14:3622 - 3630
- Nan X, Cheng J-X, Xie XS. Vibrational imaging of lipid droplets in live fibroblast cells with coherent anti-Stokes Raman scattering microscopy. J Lipid Res 2003; 44:2202 - 2208
- Iain R, Michael Andreas On, Colin JC, Gerard G, William JH, Jochen A, et al. Intracellular imaging of host-pathogen interactions using combined CARS and two-photon fluorescence microscopies. J Biophotonics 2009; 9999
- Le TT, Rehrer CW, Huff TB, Nichols MB, Camarillo IG, Cheng JX. Nonlinear optical imaging to evaluate the impact of obesity on mammary gland and tumor stroma. Mol Imaging 2007; 6:205 - 211
- Wang H-W, Langohr IM, Sturek M, Cheng J-X. Imaging and Quantitative Analysis of Atherosclerotic Lesions by CARS-Based Multimodal Nonlinear Optical Microscopy. Arterioscler Thromb Vasc Biol 2009; 29:1342 - 1348
- Le T, Huff T, Cheng J-X. Coherent anti-Stokes Raman scattering imaging of lipids in cancer metastasis. BMC Cancer 2009; 9:42
- Evans CL, Potma EO, Puoris'haag M, Cote D, Lin CP, Xie XS. Chemical imaging of tissue in vivo with videorate coherent anti-Stokes Raman scattering microscopy. Proc Natl Acad Sci USA 2005; 102:16807 - 16812
- Hellerer T, Axang C, Brackmann C, Hillertz P, Pilon M, Enejder A. Monitoring of lipid storage in Caenorhabditis elegans using coherent anti-Stokes Raman scattering (CARS) microscopy. Proc Natl Acad Sci USA 2007; 104:14658 - 14663
- Le TT, Duren HM, Slipchenko MN, Hu C-D, Cheng J-X. Label-free quantitative analysis of lipid metabolism in living Caenorhabditis elegans. J Lipid Res 2009; 638
- Zhu J, Lee B, Buhman KK, Cheng J-X. A dynamic, cytoplasmic triacylglycerol pool in enterocytes revealed by ex vivo and in vivo coherent anti-Stokes Raman scattering imaging. J Lipid Res 2009; 50:1080 - 1089
- Kielty CM, Sherratt MJ, Shuttleworth CA. Elastic fibers. J Cell Sci 2002; 115:2817 - 2828
- Potma EO, Xie XS. Detection of single lipid bilayers in coherent anti-Stokes Raman scattering (CARS) microscopy. J Raman Spectrosc 2003; 34:642 - 650
- Li L, Wang H, Cheng JX. Quantitative coherent anti-Stokes Raman scattering imaging of lipid distribution in co-existing domains. Biophys J 2005; 89:3480 - 3490
- Heinrich C, Hofer A, Ritsch A, Ciardi C, Bernet S, Ritsch-Marte M. Selective imaging of saturated and unsaturated lipids by wide-fieldCARS-microscopy. Opt Express 2008; 16:2699 - 2708
- Müller M, Schins JM. Imaging the thermodynamic state of lipid membranes with multiplex CARS microscopy. J Phys Chem B 2002; 106:3715 - 3723
- Cheng JX, Volkmer A, Book LD, Xie XS. Multiplex coherent anti-Stokes Raman scattering microspectroscopy and study of lipid vesicles. J Phys Chem 2002; 106:8493 - 8498
- Rinia HA, Bonn M, Muller M. Quantitative Multiplex CARS Spectroscopy in Congested Spectral Regions. J Phys Chem B 2006; 110:4472 - 4479
- Vartiainen EM, Peiponen K-E, Kishida H, Koda T. Phase retrieval in nonlinear optical spectroscopy by the maximum-entropy method: an application to the |χ(3)| spectra of polysilane. J Opt Soc Am B 1996; 13:2106 - 2114
- Rinia H, Burger KNJ, Bonn M, Muller M. Quantitative label-free imaging of lipid composition and packing of individual cellular lipid droplets using multiplex CARS microscopy. Biophys J 2008; 108:137737
- Paulsen HN, Hilligsoe KM, Thogersen J, Keiding SR, Larsen JJ. Coherent anti-Stokes Raman scattering microscopy with a photonic crystal fiber based light source. Opt Lett 2003; 28:1123 - 1125
- Kee TW, Cicerone MT. Simple approach to one-laser, broadband coherent anti-Stokes Raman scattering microscopy. Opt Lett 2004; 29:2701 - 2703
- Kano H, Hamaguchi H. Vibrationally resonant imaging of a single living cell by supercontinuum-based multiplex coherent anti-Stokes Raman scattering microspectroscopy. Opt Express 2005; 13:322 - 327
- Petrov GI, Yakovlev VV. Enhancing red-shifted whitelight continuum generation in optical fibers for applications in nonlinear Raman microscopy. Opt Express 2005; 13:1299 - 1306
- Slipchenko MN, Le TT, Chen H, Cheng J-X. High-Speed Vibrational Imaging and Spectral Analysis of Lipid Bodies by Compound Raman Microscopy. The J Phys Chem B 2009; 113:7681 - 7686
- Fu Y, Wang H, Shi R, Cheng JX. Second harmonic and sum frequency generation imaging of fibrous astroglial filaments in ex vivo spinal tissues. Biophys J 2007; 92:3251 - 3259
- Wang HW, Le TT, Cheng JX. Label-free imaging of arterial cells and extracellular matrix using a multimodal nonlinear optical microscope. Opt Comm 2008; 281:1813 - 1822
- Chen H, Wang H, Slipchenko MN, Jung Y, Shi Y, Zhu J, et al. A multimodal platform for nonlinear optical microscopy and microspectroscopy. Opt Express 2009; 17:1282 - 1290
- Pegoraro AF, Ridsdale A, Moffatt DJ, Jia Y, Pezacki JP, Stolow A. Optimally chirped multimodal CARS microscopy based on a single Ti:sapphireoscillator. Opt Express 2009; 17:2984 - 2996
- Agnieszka N, Stachowiak DJI. Inverse opal hydrogel-collagen composite scaffolds as a supportive microenvironment for immune cell migration. J Biomed Mater Res A 2008; 85:815 - 828
- Andresen ER, Nielsen CK, Thøgersen J, Keiding SR. Fiber laser-based light source for coherent anti-Stokes Raman scattering microspectroscopy. Opt Express 2007; 15:4848 - 4856
- Krauss G, Hanke T, Sell A, Träutlein D, Leitenstorfer A, Selm R, et al. A compact coherent anti-Stokes Raman scattering microscope based on a picosecond two-color Er:fiber laser system. Opt Lett 2009; In press.
- Kieu K, Saar BG, Holtom GR, Xie XS, Wise FW. High-power picosecond fiber source for coherent Raman microscopy. Opt Lett 2009; 34:2051 - 2053