Abstract
The postnatal leptin surge, described particularly in rodents, has been demonstrated to be crucial for hypothalamic maturation and brain development. In the present study, the possible general effects of this hormone on maturation of numerous peripheral organs have been explored. To test this hypothesis, we used a leptin antagonist (L39A/D40A/F41A) to investigate the effects of the blockage of postnatal leptin action on neonatal growth and maturation of organs involved in metabolism regulation, reproduction and immunity. For that purpose, newborn female pups were subcutaneously injected from days 2–13 with either saline or leptin antagonist and sacrificed at weaning. Organs were submitted to histological and immunohistochemical analyses. Leptin antagonist treatment clearly impaired the maturation of pancreas, kidney, thymus and ovary. All these alterations, at the organ level, occurred without changes in the whole-body mass of the animals. Leptin antagonist treatment induced: (1) a reduction in b cell area and a concomitant increase of a cells in Langherans islets in the pancreas, (2) a reduction in the number of glomeruli and a persistence of immature glomeruli in kidney, (3) an increase in the thymic cortical layer thickness, reflecting an unmatured stage, (4) a drastic reduction of the pool of primordial follicles, in ovaries. All these results strongly argue for a crucial role of leptin for the achievement of organ maturation, opening new perspectives in the field of leptin physiology and organ development.
Introduction
Leptin arises from the Ob gene and is a 16 kDa cytokine, secreted mainly by adipose tissue.Citation1 Its circulating levels are a reflection of whole-body fat stores. Structurally, leptin is composed of four antiparallel α helices and shares a high degree of homology with several members of the cytokine family, such as interleukin 2, prolactin or growth hormone.Citation2 In addition to adipose tissue, several organs have been identified as producing significant amounts of leptin, such as gastric epithelial cells,Citation3 placentaCitation4 and mammary glands.Citation5 Numerous other cell types, such as gonadic cells,Citation6 epithelial intestinal cellsCitation7 and myocytes,Citation8 are also able to secrete leptin, but its relation to biological actions only appear to be exerted at a local level.
In adults, leptin is involved in the control of numerous physiological functions related to metabolic regulation, growth, reproduction, immunity and bone remodeling.Citation9 The phenotype observed in genetically leptin-deficient mice (ob/ob) illustrates the broad spectrum of leptin effects.Citation10 In this model, leptin failure leads to well-characterized hyperphagia and massive obesity but is also associated with numerous physiological disturbances such as infertility, immune defects, altered thyroid function and respiratory dysfunctions.Citation9,Citation11
By contrast, the biological effects exerted by leptin during early phases of development and organ maturation remain largely unknown. It appears that in rodent neonates, the regulation of leptin secretion differs completely from that observed in adults. In particular, a dramatic increase in leptin levels occurs during the first two weeks of life, independently of fat accretion and body weight gain, and is not involved in food intake regulation.Citation12–Citation14 This postnatal leptin surge appears to be involved in the establishment of the hypothalamic neuronal network responsible for food intake regulation.Citation15
In organs other than the brain, only a few studies investigated the developmental effects exerted by leptin. Our hypothesis was that leptin might be a cytokine involved in the maturation of the whole organism during the neonatal period. The recent availability of competitive leptin antagonistsCitation16 has opened new opportunities to clarify the physiological role of leptin during specific periods of life. We previously demonstrated that the specific blockage of leptin action between postnatal days 2 and 13 resulted in a long-term alteration of food intake regulation and a higher susceptibility to diet-induced obesity.Citation17 Our aim during the present work was to investigate the consequences of blocking leptin effects during the same critical postnatal period with respect to general development and the maturation of numerous peripheral organs.
Results
Effect of neonatal leptin antagonist treatment on growth during the suckling period.
As shown in , control and leptin antagonist-treated animals experienced similar growth during the treatment period. At d22, there were no differences in the weight or length of the animals () nor in the weights of the different organs collected (), except for the spleen, which was significantly reduced in the rlepm7.5 group (198.3 ± 14.2 mg in the rlepm7.5 group vs. 224.3 ± 7.3 mg in the control group, p < 0.01).
Effect of neonatal leptin antagonist treatment on tissue maturation.
The effect of postnatal leptin disruption was investigated microscopically in several organs, including the heart, adrenal glands, pancreas, kidneys, liver, thymus, spleen, ovaries and lungs. In the heart and adrenal glands, particular special care was taken regarding observation of the relative size of the nucleus compared to the amount of cytoplasm, of cardiac myocytes and the relative development of each adrenal layer, but no alterations were observed when the treated and control animals were compared. In the seven other tissues where modifications were recorded, histological observations were supplemented by morphometric analyses.
Pancreas. In the endocrine pancreas, the Langherans islets of treated animals globally appeared to be stunted, made up of cells with a poorly developed cytoplasm and a high nucleocytoplasmic ratio, corresponding to weakly active cells (). In terms of islet cell appearance, they were seen to be smaller in the rlepm7.5 group (81.0 ± 3.9 µm2 in rlepm7.5 vs. 95.3 ± 2.9 −m2 in controls, p < 0.05). After cellular typing using immunohistochemistry, no difference in the distribution of α (glucagon-positive) and β (insulin-positive) cells was observed; centrally located β cells were surrounded by a thin rim of a cells. However, as shown in , the share of the islet area occupied by β cells in rlepm 7.5 animals was reduced (49.6 ± 1.8% in rlepm7.5 vs. 59.4 ± 1.2% in controls, p < 0.001) and was associated with a slight concomitant increase in the share of the islet area occupied by α cells (29.8 ± 1.2% in rlepm7.5 vs. 25.2 ± 1.6% in controls, p < 0.05). In antagonist-treated rats, we thus observed a decrease in the β/α cell ratio (1.68 ± 0.24 in rlepm7.5 vs. 2.44 ± 0.21 in controls, p < 0.01). In the exocrine pancreas, acinar organization and cellular appearance did not differ between the two groups.
Kidneys. Histological organization of the renal parenchyma was normal. No changes to the corticomedullary ratio were observed. The histological appearance of urinary tubes was unchanged. Strikingly, numerous glomeruli in antagonist-treated animals appeared to be small and hypercellular, composed of small cells with euchromatic nuclei, when compared to those in control animals. This morphological aspect corresponded to immature glomeruli coexisting with those of a more mature nature (). Consequently, as illustrated in , the mean size of glomeruli was decreased in the rlepm7.5 group when compared to the controls (2,369 ± 81 µm2 in rlepm7.5 vs. 2,831 ± 66 µm2 in controls, p < 0.01). In addition, the number of glomeruli was reduced in rlepm7.5 animals (103 ± 2 glomeruli/cm2 in rlepm7.5 vs. 112 ± 2 glomeruli/cm2 in controls, p < 0.05), and this was interpreted as a reduction in the total number of nephrons.
Liver. The trabecular organization of hepatocytes and cellular appearance were similar in both treated and control animals. Estimates of cell proliferation based on counts of hepatocytic mitosis did not reveal any differences between the two groups.
Lymphoid organs. The examination of spleen samples did not reveal any differences between the two groups, although particular attention was paid to red pulp and white pulp development. In order to assess extramedullary hematopoiesis, the number of megacaryocytes present in red pulp was also counted, but no difference was observed between treated and control animals (396 ± 26 megacaryocytes/µm2 in controls vs. 435 ± 17 megacaryocytes/µm2 in rlepm7.5, p > 0.05).
As shown in , the thymic lobules of rlepm7.5 animals were characterized by thicker cortical areas rich in lymphocytes, corresponding to tissue that was less involuted than that in control animals. This observation was confirmed by morphometrical analyses () that indicated a 20% increase in cortical layer thickness in the rlepm7.5 thymus (153.9 ± 7.7 µm vs. 127.4 ± 4.7 µm in controls, p < 0.01).
Ovaries. The ovaries were similar in terms of organization in both groups. No differences were observed between the two groups regarding the number or size of tertiary follicles (10 ± 1 follicles/mm2 with a mean size of 40,651 ± 4,136 µm2 in controls vs. 10 ± 1 follicles/mm2 with a mean size of 43,005 ± 7,035 µm2 in rlepm7.5). Strikingly, the pool of primordial follicles was decreased in rlepm7.5 animals (147 ± 20 follicles/mm2 in rlepm7.5 vs. 223 ± 17 follicles/mm2 in controls, p < 0.05). In situ cell death detection by the TUNEL assay did not evidence any differences between the two groups in ovarian apoptotic rates at d22. Interestingly, the rate of follicular atresia was, indeed, very low (between 0–2 atresic follicles per ovary section) in all animals, except for one in the rlepm7.5 group that displayed eight follicles undergoing apoptosis (data not shown).
Lungs. No changes were seen regarding the appearance of the pulmonary parenchyma. The determination of alveolar surfaces did not reveal any differences between the groups (0.086 ± 0.004 mm2 in controls vs. 0.092 ± 0.003 mm2 in rlepm7.5, p > 0.05). The numbers of mature type II pneumocytes, as evidenced by their cytoplasmic surfactant content, were similar in animals in both groups (27 ± 2 cells/mm2 in controls vs. 23 ± 2 cells/mm2 in rlepm7.5, p > 0.05).
Discussion
The organ maturation process during perinatal life is known to be regulated by a complex network of hormones and cytokines, acting both sequentially and in combination.Citation18 Glucocorticoids, growth hormone, insulin-like growth factors, thyroid hormones, prolactin, estrogens and others additional hormones or cytokines act in a precise equilibrium to ensure harmonious development of the individual.Citation19,Citation20 The known phenotype of genetically leptin-deficient mice (ob/ob), which display numerous abnormal organ dysfunctions may, in fact, originate from developmental defects that are not well documented. The leptin antagonist used during our study constitutes a very powerful tool to understand the physiological role of leptin in a non-genetically modified animal, during targeted periods and in a reversible manner.
The principal contribution of the present findings was to provide strong arguments in favor of adding leptin to the complex list of developmental actors during perinatal life. The rat neonate is particularly immature at birth, because most organ maturation occurs during the weeks that follow birth. It is thus an appropriate animal model to study the final phases of organ maturation that normally occur during fetal life in superior mammals. In these species when affected by intra-uterine growth retardation (IUGR), a delay in organ maturation is also frequently observed. Interestingly, IUGR in both rats and humans is associated with lower perinatal leptin levels, suggesting a possible relationship between leptin and organ maturation.Citation21,Citation22
Our results clearly show that leptin may constitute a key hormone for the maturation of numerous peripheral organs involved not only in metabolic functions but also in immunity and reproduction in rats. They may be also useful to better understand the situation observed in the case of IUGR in superior mammals.
In the pancreas, postnatal leptin blockage resulted in marked alterations to the histological structure of Langherans islets, characterized by an increased α cell/β cell ratio. This change in islet composition might subsequently impair the ability to produce insulin and may consequently promote the installation of insulin resistance and type 2 diabetes.
In the kidneys, postnatal leptin blockage resulted in a reduced number of glomeruli and an apparent delay in their maturation. To our knowledge, no study so far has documented a possible link between leptin and normal kidney development. In rodents, postnatal kidney maturation is associated with the achievement of nephrogenesis processes by the end of the first postnatal week,Citation23 and renal development in the rat may be profoundly affected by postnatal events such as nutritional restriction.Citation24 The alterations in kidney development observed during our study suggest that leptin may participate in the complex hormonal system that controls kidney maturation after birth, at least in the rat.
Concerning lymphoid organs, our results clearly showed that postnatal leptin blockage profoundly modified the structure of the thymus and decreased the spleen weight. These changes appeared to be consecutive to a delay in thymus and spleen maturation. Numerous studies have already demonstrated the effects of leptin in the regulation of thymopoiesis, the immune response and hematopoiesis processes.Citation11,Citation25 Leptin deficiency in ob/ob mice results in chronic thymic atrophy, cell-mediated immune deficiency and reduced spleen cellularity.Citation26 Our study using non-genetically modified animals born with a normal weight, provides additional arguments in favor of a crucial role for leptin specifically during neonatal life in the establishment of immune functions.
In the ovaries, our results showed that leptin blockage induced a drastic reduction in the pool of primary follicles. In the rat, oocyte selection occurs during the early postnatal period following two successive waves of follicle apoptosis, one that occurs just after birth and the other during the third week of life.Citation27 It has been shown previously that the second wave of follicle atresia may be leptin-modulated, because leptin injections in 21-day old rats decreased the incidence of follicular apotosis.Citation28 Our findings suggest that the first wave may also be leptin-dependent, and that this hormone may consequently play a major role in determining the final number of follicles.
In the lungs, postnatal leptin blockage did not appear to cause any clear effects on organ maturation. This result contrasts with several studies carried out during fetal life, demonstrating an important role for leptin in the lung development of different species, such as rodents or primates.Citation29,Citation30 At that stage, leptin receptors have been identified in the pneumocyte type II cells, which are responsible for synthesizing pulmonary surfactant and are developmentally regulated during late phases of gestation.Citation29,Citation30 The lack of efficacy of leptin blockage during our study may suggest that its action on lung maturity is probably restricted to the gestational period in normal animals. However, in IUGR animals, postnatal leptin treatment may be effective in correcting developmental defects in the lungs as suggested by our previous study performed in IUGR piglets.Citation31
The mechanisms of leptin action during this period remain to be clarified in further studies. Two hypotheses can be proposed. The first involves a direct action of leptin on peripheral target organs, while the second implies a centrally mediated action, either through stimulation of the hypothalamo-pituitary axis or via the modulation of nerve activity to promote general growth and development.
A direct leptin effect is supported by the fact that the long form of the leptin receptor has been identified during fetal and early postnatal life in numerous organs.Citation32,Citation33 In addition, expression of the leptin receptor gene and leptin binding appear to be regulated developmentally, reinforcing a possible functional role for leptin during specific windows of organ development.Citation34 From a cellular point of view, leptin has been shown to exert proliferative and antiapoptotic activities in a variety of cell types, particularly in β cells,Citation35 granulosa cellsCitation36 and lymphoid cells.Citation11
On the other hand, it might be suggested that the actions of leptin on general growth and organ maturation are mediated by stimulation of the hypothalamo-pituitary axis. Studies performed in vivo in the rat and pig have clearly demonstrated that leptin can modulate the secretion of GH, glucocorticoids, gonadotropins and thyroid hormones,Citation37–Citation40 all of which are involved in growth and organ maturation. In addition, activation or inhibition of the neuronal network in superior hypothalamic nuclei, such as the paraventricular nuclei, may modulate the balance between sympathic and parasympathic activities, leading to cell metabolism changes, as has been clearly demonstrated during bone remodeling.Citation41
In conclusion, leptin appears to be an important cytokine that is involved not only in the establishment of food intake regulation but also as a factor that participates in the complex hormonal system that prevails during perinatal life with respect to the maturation of numerous organs. Because leptin levels are highly sensitive to nutritional status, an unbalanced diet may compromise the harmonious development of neonates by impacting organ maturation and promoting the establishment of long-term pathologies.
Material and Methods
Animals.
The investigational protocol was approved by the Animal Ethics Committee (Comité Régional d'Ethique sur l'Expérimentation Animale, Ile-de-France Sud). Gestationally timed, pregnant Wistar rats from our breeding stock were housed individually with free access to water and food. They were housed under constant conditions of ambient temperature (20–22°C), hygrometry (around 50%) and light (12:12 h light:dark cycle from 07:00 to 19:00) and fed with a standard chow diet. One day after they were born (birth = d0), 40 female pups were weighed, and among them, 16 pups of similar weight were selected in order to obtain homogeneous groups in term of developmental stage. They were then assigned to two dams until weaning (d21) and followed daily for body weight until d14. The litters were equalized in term of total number of pups and number of pups assigned to each treatment group.
Neonatal treatment.
A rat leptin mutant (L39A/D40A/F41A, designated as rlepm) was prepared as previously described in reference Citation16. The pups were weighed and received daily subcutaneous injections between 17:00 and 18:00 from d2 to d13 with either NaCl (control group, n = 8) or the leptin antagonist at a dose of 7.5 µg/g/day (rlepm7.5 group, n = 8). Special syringes (0.3 mlU-100 insulin, 29G, Terumo, France) were used to minimize pain and enable a maximum injection volume of 50 µl.
Tissue collection.
At d22, the animals were weighed, measured (nose to tail length) and sacrificed after deep anesthesia with an intra-peritoneal injection of 30 mg/kg sodium pentobarbital. The lungs, heart, pancreas, liver, kidneys, spleen, thymus, peri-gonadic adipose tissue and ovaries were collected, weighed and fixed with a 4% paraformaldehyde-phosphate buffer solution.
Histology and immunochemistry.
The organs were processed using standardized procedures (Ruehl-Fehlert, Exp Toxic Pathol 2003; 55:91–106). Cutting levels were chosen as follows: transversal section of the right caudal lobe for the lungs, longitudinal horizontal section of the left lobe for the pancreas, transversal sections of the left lateral lobe for the liver, transversal section through the tip of the papilla for the kidneys, transversal section at the largest extension of the organ for the spleen, longitudinal section of the thymus and a transversal section of the ovaries. Tissue samples were embedded in paraffin wax, processed into 8-µm thick sections and stained using a routine hematoxylineosin-safran staining method. Lung sections were further stained using the Periodic Acid Schiff (PAS) technique to enable the detection of surfactant glycoproteins and the identification of type II pneumocytes.
In the pancreas, the identification of β cells (insulin+) and α cells (glucagon+) was performed by immunochemistry using a guinea pig anti-porcine insulin antibody (Dako, Glosdrup, Denmark, 1:50) and a mouse anti-porcine pancreatic glucagon antibody (Sigma, St. Louis, USA 1:2,000), respectively. Briefly, paraffin-embedded sections were pre-treated in citrate buffer (Dako) (98°C, 40 minutes), followed by incubation in 3% hydrogen peroxide for 10 minutes. The sections were then incubated for 30 minutes with 20% normal goat serum (Dako) and 0.2% Tween (Sigma, Steinheim, Germany). Primary antibodies were incubated in 2% goat serum, 2% BSA (Sigma) and 0.2% Tween overnight at 4°C. Immunolabeling for glucagon was performed using biotinylated secondary antibody (Dako, 1:300), streptavidin-peroxidase complex (Dako, 1:300) and then 3,3′-diamino-benzidine (DAB). Immunolabeling for insulin was performed using a rabbit secondary antibody (Dako, 1:25) coupled with an alkaline phosphatase and detected with fast red as the chromogen (Dako).
In the ovaries, apoptosis was evaluated using the TUNEL technology with an in situ cell death detection kit (Roche, Mannheim, Germany) and carried out according to the manufacturer's instructions.
Morphometric analyses.
Blind histological measurements were made using a digital camera (Nikon DXM 1200, Champigny, France) combined with image-analysis software (Nikon Imaging Software).
In the kidneys, as many microscopic fields as necessary were selected at random in the cortical region of the sample so as to observe at least 100 glomeruli per sample (15 ± 1 glomeruli per field). The glomeruli were counted (reproducibility coefficient, calculated as 100% coefficient of variation, was 92.6%), and glomerular density was calculated in numbers of glomeruli/µm2. Mean glomerular size was determined using the Ferret minimal diameter on at least 40 glomeruli per sample (reproducibility coefficient: 87.0%).
In the pancreas, the total islet area and the area corresponding to α cells (as identified by glucagon immunolabeling) were measured for five islets in each sample (reproducibility coefficient: 92.3%). The percentage islet area occupied by these cells was then calculated. The total numbers of cells and β cells identified by insulin immunolabeling were also determined on at least 220 islet cells in order to calculate the percentage of β cells among total islet cells (reproducibility coefficient: 93.9%).
In the liver, the number of hepatocytic mitosis was estimated on 10 high magnification fields randomly selected.
In the thymus, the minimum cortex thickness was measured in at least 15 lobules per sample (reproducibility coefficient of variation: 99.6%).
In the ovaries, follicles were classified according to their morphological stage of development (primordial, primary, secondary and tertiary) and then counted (reproducibility coefficients for primordial and tertiary counts: 97.1% and 97.8%, respectively). Ovary size was determined using the Ferret minimal diameter and follicular density was calculated.
In the lungs, the total number of mature type II pneumocytes identified by their PAS-positive cytoplasmic content was determined on 30 fields (reproducibility coefficient: 90.7%). Alveolar surface was also estimated, a measure of the total area occupied by the lumen of the alveoli, by analyzing five high-magnification fields (reproducibility coefficient: 93.2%).
Statistical analysis.
Unpaired t-tests were performed to compare the control and rlepm7.5 groups for all the parameters studied using the GraphPad Software. For all analyses, differences with a p value <0.05 were considered to be significant. All values are expressed as mean ± SEM.
Figures and Tables
Figure 1 Effect of neonatal treatment on general growth from birth to day 14 and on day 22. (A) Body weight curves of control and leptin antagonist-treated animals from d1 to d14. (B) The body weight (g) and length (cm) of control and leptin antagonist-treated animals at d22. Values represent the mean ± SEM, n = 8 per group.
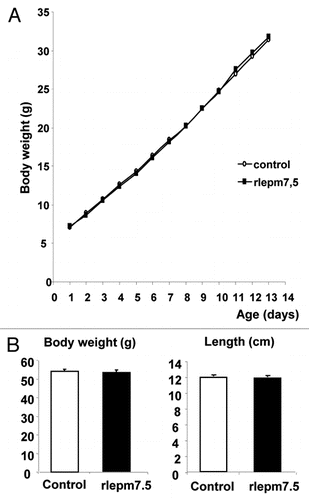
Figure 2 Effect of neonatal treatment on the histological structure of pancreatic islets. (A) Representative pancreas sections showing Langherans islets from control and leptin antagonist-treated rats. Bars = 100 µm. (B) Determination of islet cell size in control and rlepm7.5 animals. Values represent the mean ± SEM, n = 7 and n = 8 in the control and rlepm7.5 groups, respectively. *p < 0.05 between control and rlepm7.5 animals.
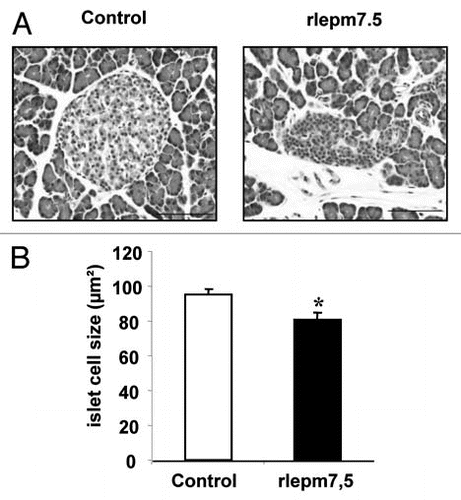
Figure 3 Effect of neonatal treatment on the composition of Langherans islets. (A) Immunolabelling for insulin and glucagon in representative pancreas sections from control and leptin antagonist-treated rats. Bars = 100 µm. (B) Areas of β and α cells expressed as a percentage of the total islet area in control and rlepm7.5 animals. Values represent the mean ± SEM; n = 7 and n = 8 in the control and rlepm7.5 groups, respectively. *p < 0.05, **p < 0.01 between control and rlepm7.5 animals.
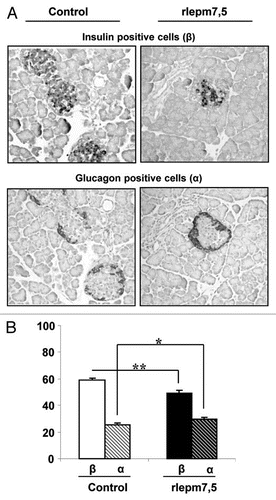
Figure 4 Effect of neonatal treatment on the histological structure of the kidney. (A) Representative kidney sections from control and leptin antagonist-treated rats. Arrows indicate fetal glomeruli. Bars = 100 µm. (B) Density and size of glomeruli in the renal cortex of control and leptin antagonist-treated animals. Values represent the mean ± SEM, n = 8 per group. *p < 0.05, **p < 0.01 between control and rlepm7.5 animals.
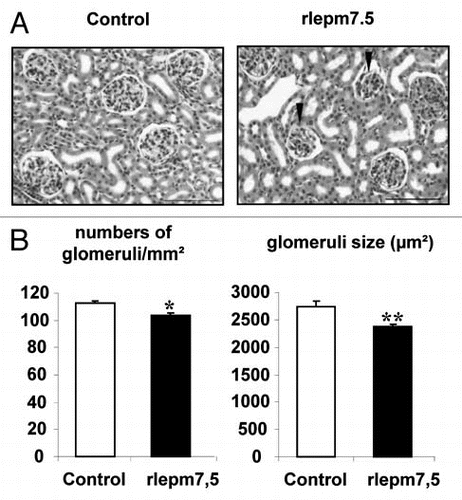
Figure 5 Effect of neonatal treatment on thymus maturation. (A) Representative thymus sections from control and leptin antagonist-treated rats. Arrows indicate cortical layer. Bars = 100 µm. (B) Determination of cortical layer thickness (µm) in control and rlepm7.5 animals. Values represent the mean ± SEM, n = 8 per group. **p < 0.01 between control and rlepm7.5 animals.
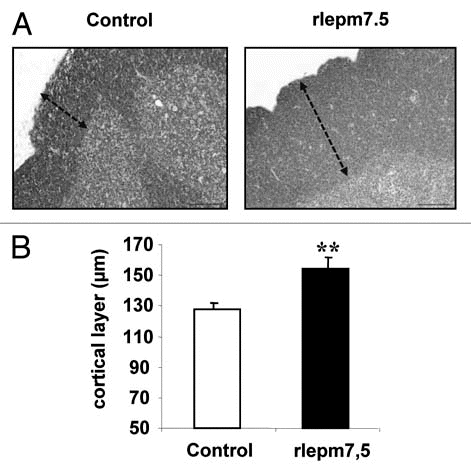
Figure 6 Effect of neonatal treatment on ovary. Representative ovary sections from control and leptin antagonist-treated rats. Arrow heads indicate primordial follicles. Bars 10 µm. (B) Number of antrum and primordial follicles relative to ovary area in control and rlepm7.5 animals. Values represent the mean ± SEM, n = 5 and n = 8 in the control and rlepm7.5 groups, respectively. *p < 0.05 between control and rlepm7.5 animals.
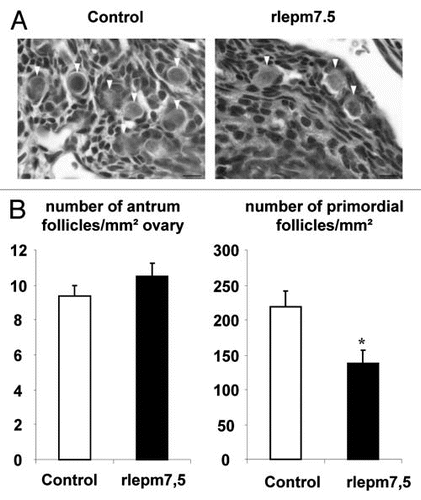
Table 1 Effect of neonatal treatment on organ weight at d22
References
- Zhang Y, Proenca R, Maffei M, Barone M, Leopold L, Friedman JM. Positional cloning of the mouse obese gene and its human homologue. Nature 1994; 372:425 - 432
- Zhang F, Basinski MB, Beals JM, Briggs SL, Churgay LM, Clawson DK, et al. Crystal structure of the obese protein leptin-E100. Nature 1997; 387:206 - 209
- Bado A, Levasseur S, Attoub S, Kermorgant S, Laigneau JP, Bortoluzzi MN, et al. The stomach is a source of leptin. Nature 1998; 394:790 - 793
- Masuzaki H, Ogawa Y, Sagawa N, Hosoda K, Matsumoto T, Mise H, et al. Nonadipose tissue production of leptin: leptin as a novel placenta-derived hormone in humans. Nat Med 1997; 3:1029 - 1033
- Bonnet M, Delavaud C, Laud K, Gourdou I, Leroux C, Djiane J, et al. Mammary leptin synthesis, milk leptin and their putative physiological roles. Reprod Nutr Dev 2002; 42:399 - 413
- Ryan NK, Woodhouse CM, Van der Hoek KH, Gilchrist RB, Armstrong DT, Norman RJ. Expression of leptin and its receptor in the murine ovary: possible role in the regulation of oocyte maturation. Biol Reprod 2002; 66:1548 - 1554
- Sitaraman S, Liu X, Charrier L, Gu LH, Ziegler TR, Gewirtz A, et al. Colonic leptin: source of a novel proinflammatory cytokine involved in IBD. Faseb J 2004; 18:696 - 698
- Wang J, Liu R, Hawkins M, Barzilai N, Rossetti L. A nutrient-sensing pathway regulates leptin gene expression in muscle and fat. Nature 1998; 393:684 - 688
- Margetic S, Gazzola C, Pegg GG, Hill RA. Leptin: a review of its peripheral actions and interactions. Int J Obes Relat Metab Disord 2002; 26:1407 - 1433
- Lindstrom P. The physiology of obese-hyperglycemic mice [ob/ob mice]. ScientificWorld J 2007; 7:666 - 685
- Lam QL, Lu L. Role of leptin in immunity. Cell Mol Immunol 2007; 4:1 - 13
- Devaskar SU, Ollesch C, Rajakumar RA, Rajakumar PA. Developmental changes in ob gene expression and circulating leptin peptide concentrations. Biochem Biophys Res Commun 1997; 238:44 - 47
- Ahima RS, Prabakaran D, Flier JS. Postnatal leptin surge and regulation of circadian rhythm of leptin by feeding. Implications for energy homeostasis and neuroendocrine function. J Clin Invest 1998; 101:1020 - 1027
- Mistry AM, Swick A, Romsos DR. Leptin alters metabolic rates before acquisition of its anorectic effect in developing neonatal mice. Am J Physiol 1999; 277:742 - 747
- Bouret SG, Simerly RB. Minireview: Leptin and development of hypothalamic feeding circuits. Endocrinology 2004; 145:2621 - 2626
- Solomon G, Niv-Spector L, Gonen-Berger D, Callebaut I, Djiane J, Gertler A. Preparation of leptin antagonists by site-directed mutagenesis of human, ovine, rat and mouse leptin's site III: implications on blocking undesired leptin action in vivo. Ann NY Acad Sci 2006; 1091:531 - 539
- Attig L, Solomon G, Ferezou J, Abdennebi-Najar L, Taouis M, Gertler A, Djiane J. Early postnatal leptin blockage leads to a long-term leptin resistance and susceptibility to diet-induced obesity in rats. Int J Obes (Lond) 2008; 32:1153 - 1160
- Symonds ME, Mostyn A, Stephenson T. Cytokines and cytokine receptors in fetal growth and development. Biochem Soc Trans 2001; 29:33 - 37
- Fowden AL, Forhead AJ. Endocrine regulation of fetoplacental growth. Horm Res 2009; 72:257 - 265
- Sanders EJ, Harvey S. Peptide hormones as developmental growth and differentiation factors. Dev Dyn 2008; 237:1537 - 1552
- Delahaye F, Breton C, Risold PY, Enache M, Dutriez-Casteloot I, Laborie C, et al. Maternal perinatal under-nutrition drastically reduces postnatal leptin surge and affects the development of arcuate nucleus proo-piomelanocortin neurons in neonatal male rat pups. Endocrinology 2008; 149:470 - 475
- Jaquet D, Leger J, Levy-Marchal C, Oury JF, Czernichow P. Ontogeny of leptin in human fetuses and newborns: effect of intrauterine growth retardation on serum leptin concentrations. J Clin Endocrinol Metab 1998; 83:1243 - 1246
- McMillen IC, Robinson JS. Developmental origins of the metabolic syndrome: prediction, plasticity and programming. Physiol Rev 2005; 85:571 - 633
- Wlodek ME, Westcott K, Siebel AL, Owens JA, Moritz KM. Growth restriction before or after birth reduces nephron number and increases blood pressure in male rats. Kidney Int 2008; 74:187 - 195
- Fantuzzi G, Faggioni R. Leptin in the regulation of immunity, inflammation and hematopoiesis. J Leukoc Biol 2000; 68:437 - 446
- Sennello J, Fayad R, Pini M, Gove ME, Fantuzzi G. Transplantation of wild-type white adipose tissue normalizes metabolic, immune and inflammatory alterations in leptin-deficient ob/ob mice. Cytokine 2006; 36:261 - 266
- Takagi K, Yamada T, Miki Y, Umegaki T, Nishimura M, Sasaki J. Histological observation of the development of follicles and follicular atresia in immature rat ovaries. Acta Med Okayama 2007; 61:283 - 298
- Almog B, Gold R, Tajima K, Dantes A, Salim K, Rubinstein M, et al. Leptin attenuates follicular apoptosis and accelerates the onset of puberty in immature rats. Mol Cell Endocrinol 2001; 183:179 - 191
- Henson MC, Swan KF, Edwards DE, Hoyle GW, Purcell J, Castracane VD. Leptin receptor expression in fetal lung increases in late gestation in the baboon: a model for human pregnancy. Reproduction 2004; 127:87 - 94
- Kirwin SM, Bhandari V, Dimatteo D, Barone C, Johnson L, Paul S, et al. Leptin enhances lung maturity in the fetal rat. Pediatr Res 2006; 60:200 - 204
- Attig L, Djiane J, Gertler A, Rampin O, Larcher T, Boukthir S, et al. Study of hypothalamic leptin receptor expression in low birth weight piglets and effects of leptin supplementation on neonatal growth and development. Am J Physiol Endocrinol Metab 2008; 295:1117 - 1125
- Hoggard N, Hunter L, Duncan JS, Williams LM, Trayhurn P, Mercer JG. Leptin and leptin receptor mRNA and protein expression in the murine fetus and placenta. Proc Natl Acad Sci USA 1997; 94:11073 - 11078
- Lollmann B, Gruninger S, Stricker-Krongrad A, Chiesi M. Detection and quantification of the leptin receptor splice variants Ob-Ra, b and, e in different mouse tissues. Biochem Biophys Res Commun 1997; 238:648 - 652
- Dal Farra C, Zsurger N, Vincent JP, Cupo A. Binding of a pure 125I-monoiodoleptin analog to mouse tissues: a developmental study. Peptides 2000; 21:577 - 587
- Brown JE, Dunmore SJ. Leptin decreases apoptosis and alters BCL-2:Bax ratio in clonal rodent pancreatic beta-cells. Diabetes Metab Res Rev 2007; 23:497 - 502
- Hamm ML, Bhat GK, Thompson WE, Mann DR. Folliculogenesis is impaired and granulosa cell apoptosis is increased in leptin-deficient mice. Biol Reprod 2004; 71:66 - 72
- Saleri R, Giustina A, Tamanini C, Valle D, Burattin A, Wehrenberg WB, et al. Leptin stimulates growth hormone secretion via a direct pituitary effect combined with a decreased somatostatin tone in a median eminence-pituitary perifusion study. Neuroendocrinology 2004; 79:221 - 228
- Malendowicz LK, Tortorella C, Nowak KW, Nussdorfer GG, Hochol A, Majchrzak M. Leptin prolonged administration inhibits the growth and glucocorticoid secretion of rat adrenal cortex. Endocr Res 2000; 26:141 - 152
- Barb CR, Kraeling RR, Rampacek GB. Nutritional regulators of the hypothalamic-pituitary axis in pigs. Reprod Suppl 2001; 58:1 - 15
- Zimmermann-Belsing T, Brabant G, Holst JJ, Feldt-Rasmussen U. Circulating leptin and thyroid dysfunction. Eur J Endocrinol 2003; 149:257 - 271
- Karsenty G. Leptin controls bone formation through a hypothalamic relay. Recent Prog Horm Res 2001; 56:401 - 415