Abstract
Behavioral and neuropathological changes have been widely investigated in murine prion disease but stereological based unbiased estimates of key neuropathological features have not been carried out. After injections of ME7 infected (ME7) or normal brain homogenates (NBH) into dorsal CA1 of albino Swiss mice and C57BL6, we assessed behavioral changes on hippocampal-dependent tasks. We also estimated by optical fractionator at 15 and 18 weeks post-injections (w.p.i.) the total number of neurons, reactive astrocytes, activated microglia and perineuronal nets (PN) in the polymorphic layer of dentate gyrus (PolDG), CA1 and septum in albino Swiss mice. On average, early behavioral changes in albino Swiss mice start four weeks later than in C57BL6. Cluster and discriminant analysis of behavioral data in albino Swiss mice revealed that four of nine subjects start to change their behavior at 12 w.p.i. and reach terminal stage at 22 w.p.i and the remaining subjects start at 22 w.p.i. and reach terminal stage at 26 w.p.i. Biotinylated dextran-amine BDA-tracer experiments in mossy fiber pathway confirmed axonal degeneration, and stereological data showed that early astrocytosis, microgliosis and reduction in the perineuronal nets are independent of a change in the number of neuronal cell bodies. Statistical analysis revealed that the septal region had greater levels of neuroinflammation and extracellular matrix damage than CA1. This stereological and multivariate analysis at early stages of disease in an outbred model of prion disease provided new insights connecting behavioral changes and neuroinflammation and seems to be important to understand the mechanisms of prion disease progression.
Introduction
Prion diseases are fatal neurodegenerative diseases with a broad spectrum of clinical manifestations and neuropathological findings.Citation1,Citation2 Behavioral and neuropathological changes have been actively investigated in murine models of prion disease in the last decade.Citation3–Citation6 However, most studies that have quantified pathological changes to correlate with behavioral abnormalities have employed two-dimensional designs in single sections with neuropathological markers such as amyloid plaques, neuronal or glial cell densities, perineuronal nets and neuronal numbers and sizes.Citation4,Citation7,Citation8 These two-dimensional designs to estimate the number of these elements, either as cell densities or size distribution of neuron profiles, give rise to difficulties in interpretation because of the three-dimensional size, shape and orientation of the counted cells, and the effect of shrinkage artifacts on the regions of interest in single sections.Citation9–Citation11 As a result, the quantitative associations between neuropathological features and behavioral changes in murine prion disease are not yet firmly established. In the present report some of the behavioral changes were quantified by cluster and discriminant analysis and early microscopic abnormalities were described by stereological using unbiased estimations in the outbred albino Swiss mice model. Using selective markers for astrocytes, microglia and perineuronal nets we estimated the total numbers of these elements by the optical fractionator and apply cluster and discriminant analysis to assess behavioral data. The optical fractionator is an accurate method of quantification that combines properties of optical dissector and the fractionator that has been used in a variety of studies to determine cell numbers in multiple brain regions.Citation12,Citation13 The optical fractionator is unaffected by histological changes, shrinkage or damage-induced expansion by injury, an issue of particular importance when studying brain diseases.Citation9,Citation12,Citation14
A growing body of research suggests that substantial variability exists among cognitive abilities within individuals. Rodents in particular may present high levels of variability when analyzed by classical quantitative approach.Citation15,Citation16 The dispersion profiles can be analyzed by clustering methods based on variables of interest. Cluster analysis is a method of multivariate statistical analysis that has been applied to a wide variety of experimental approaches including behavior analysis and is mostly used when one does not have any a priori hypotheses about which objects belong to a specific cluster or group.Citation16–Citation20 We applied this multivariate statistical procedure to our samples of behavioral data to search for classes or subsets of behavioral changes.
Many concepts about the pathogenesis of prion disease have arisen from studies in mouse inbred models.Citation21–Citation24 Although inbred strains present several advantages and are indicated for most studies, the use of outbred models can show unique usefulness in a number of approaches such as fine post-quantitative trait loci mapping and discovery of genes relevant to prion disease progression.Citation25,Citation26 For example as we have found in the present report, Swiss albino outbred and C57 inbred models present the same survival times (time to death) but different times to onset of behavioral deficits in simple species specific tasks. These separation of death and symptoms may suggests that there are genes that modify different aspects of the disease evolution.Citation27 In addition the outbred Swiss albino mouse has rarely been used in experimental prion disease studiesCitation28 and no descriptions related to behavioral changes and quantitative neuropathology are available so far.
Thus, based on previous and present analysis of the behavioral changes in the C57BL6J and in the present report dedicated to albino Swiss mice we have chosen to investigate behavioral and neuropathological changes at 12, 15 and 18 w.p.i., in two phases of the disease progression, when species-typical reward-seeking behaviors (phase 1) and locomotor/cognitive (phase 2) activities are respectively altered.Citation29
To induce prion disease in the albino Swiss mice model and in C57Bl6 we used bi-lateral CA1 injections of ME7 infected brain homogenate. We investigated whether the progression of the behavioral changes is similar in both strains and which neuroanatomical areas and cell targets were more affected in disease in albino Swiss mice at early stage by using selective cell labeling and biontinylated dextran amine (BDA) injections.
Results
Behavioral tests.
compares behavioral data from C57BL6 (top row) with albino Swiss mice (middle and bottom rows) on three different tasks: burrowing (left), open field (middle) and rod bridge (right). Top (C57BL6) and middle (albino Swiss) rows represent average performances of ME7- and NBH-animals and bottom row depicts two distinct albino Swiss mice groups. shows cluster and discriminant analysis applied to behavioral data from 18 w.p.i. of albino Swiss mice.
Burrowing. From 16 w.p.i. towards the late stages at 24 w.p.i. the albino Swiss mice ME7-animals progressively burrowed less food than NBH-animals, whereas C57BL6 ME7-animals start to decrease burrowing compared to NBH-animals 4 weeks earlier (ANOVA, one way, Bonferroni p < 0.05). Inter-individual variability in burrowing activity in the ME7 albino Swiss mice revealed two subgroups (ME7-E and ME7-L) with a differential decrease during disease progression in comparison with NBH-animals ( bottom left). ME7-E start to decrease burrowing activity at early stage (12 w.p.i.) and ME7-L at later stage (22 w.p.i.). Discriminant analysis of the experimental variables ( and bottom row, right), demonstrates that burrowing activity is the variable that distinguished two differential patterns of behavioral changes in the ME7-animals. These patterns became apparent at 18 w.p.i. and remained until the final stage of the disease.
Open field and rod bridge tests.
These tests demonstrated that albino Swiss ME7-animals when compared to NBH-animals, presented greater motor incoordination (longer latency to cross the bridge) followed by hyperactivity (higher number of crossed lines) at 18 and 22 w.p.i. respectively, (ANOVA, one way, Bonferroni p < 0.05), whereas C57BL6 present hyperactivity at 16 w.p.i. followed by motor incoordination at 18 w.p.i. (, middle and right columns). Note that hyperactivity appears earlier than motor incoordination in C57BL6 in contrast to the albino Swiss mice where motor incoordination seems to precede hyperactivity. It is important to highlight that motor incoordination start on average at 18 w.p.i. in both strains. Hyperactivity and motor incoordination in albino Swiss mice do not form clusters with statistical significance, however, the distinction becomes visible if we segregate based on burrowing activity early from late subjects.
Neuropathology.
A–D presents a series of photomicrographs of histo- and immunohistochemical reacted sections from ME7- and NBH-animals. Typical vacuoles are shown as are PrPSC deposits in CA1 ( and B), and mossy fiber degeneration in ME7-animals () in comparison with NBH-animals (). At 18 w.p.i. mossy fibers show morphological changes with large varicosities, incomplete filling and eventually leakage of the neurotracer associated with intense astrocytosis and microgliosis in the hilus. These neuropathological features in axons were absent in the NBH-animals (D).
Earlier in the disease (12 w.p.i.), when behavioral changes became apparent neuropathological analysis in another cohort of subjects revealed that 4 in 9 ME7-anmimals had microglial activation (-ME7-E). We suggest that these animals with early microglial activation may correspond to the subjects with behavioral changes early in the disease (ME7-E, in ) and the others that did not show early microglial activation (-ME7-L) may correspond to the ones that start behavioral changes late in the disease (ME7-L in ).
Stereological assessment.
We estimated the total number of reactive astrocytes, activated microglia and neurons in the septum, polymorphic layer of dentate gyrus and CA1 and correlated these with the estimates of the total number of perineuronal nets in the septum and CA1.
The estimates of the total numbers by optical fractionator for each selective marker and region are shown in Tables S3–6. The total number of microglia in the polymorphic layer of the dentate gyrus, CA1 and septum in the NBH-animals and albino Swiss ME7-animals at 15 w.p.i. and 18 w.p.i. were all significantly different from each other (Table S3), (ANOVA, one-way, Bonferroni a priori test p < 0.05). Similar results were found for astrocytes in PolDG estimates except for a lack of significant difference between 15 and 18 weeks in the ME7 groups. In CA1 astrocyte estimates did not show a significant difference between NBH-animals and 15 w ME7-animals, but the difference between NBH- and ME7-animals appeared at 18 weeks as well as a significant difference between ME7-animals at 15 w and 18 w (ANOVA, one-way, n = 4, Bonferroni a priori test p < 0.05). In the septal region we have found the greatest difference in astrocytes estimations and it included all groups (ANOVA, one-way, n = 4, Bonferroni a priori test p < 0.05). Finally, perineuronal nets presented greater RIs in CA1 than in septal region with significant differences (ANOVA, one-way, n = 4, Bonferroni a priori test p < 0.05) between all experimental groups, except for a lack of a significant difference between 15 and 18 weeks in the septal region of ME7-animals.
– show low and high power photomicrographics from GFAP immunostained sections, or from histochemically reacted sections for Lycopersicum esculentum and Wisteria floribunda, to illustrate respectively reactive astrocytes ( and upper) and activated microglia ( and lower) in the PolDG, CA1 and Septum, as well as perineuronal nets () in the CA1 and Septum. Images are from sections at 15 and 18 w.p.i. of ME7-animals or NBH-animals. Note in and upper, that the number and size of astrocytes increased in greater proportions in the septal region and in PolDG than in CA1 at the same time points. A similar tendency is shown by the activated microglia ( and bottom).
Graphic representations of the number of objects of interest based on Tables S3–5 illustrate mean values and error bars of the total number of astrocytes ( and ), microglia ( and ) and perineuronal nets () in PolDG, CA1 and septum with respective indices of activation (astrocytes and microglia, –) or reduction (perineuronal nets, ). Direct comparative analysis of activation indexes indicate that the septal region is more strongly affected earlier in the disease than PolDG or CA1, with a higher proportion in the number of reactive astrocytes, activated microglia and a reduction of the perineuronal nets.
It can be observed from Tables S3–6 (see supplementary material) that the variance introduced by methodological procedures was in most cases less than 50% of the observed group variance giving a ratio CE2/CV2 <0.5 (Slomianka and West 2005). In cases of experimental groups that did not follow this rule, the ratio CE2/CV2 higher than 0.5, was not indicative of large variance introduced by stereological analysis. In this exceptions both biological variance (9.4–19%) and CEs (6.7–11%) were low and the general rule was neither meaningful nor practical to follow.Citation45
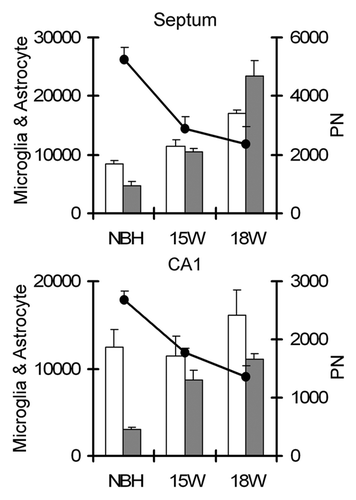
In the septal region, between 15 and 18 w.p.i., there was an increase of 45% and 123% in the total number of reactive astrocytes and activated microglia respectively, whereas the reduction of perineuronal nets was 22% in the same region and time period. In total the percentages of reduction of perineuronal nets in ME7-animals at 18 w.p.i. in comparison with NBH-animals were 49% and 55% in CA1 and septum respectively, whereas astrocytes increase 33% and 50% respectively and microglia increase 73% and 80% in the same period and regions. shows estimates of reactive astrocytes, activated microglia and perineuronal nets in the septum (top) and CA1 (bottom). Data analysis comparing NBH-animals and ME7-animals at 15 and 18 w.p.i. revealed an inverse, linear proportionality between the increase of astrocytes and microglia and the reduction of the perineuronal nets.
Finally despite the increasing microgliosis, astrocytosis and extracellular matrix damage, the estimates of the total number of neurons in the septal region and in PolDG did not reveal any significant differences between NBH and ME7 at 18 w.p.i.: Septum, NBH = 90,144 ± 20,581; 18 w = 89,533 ± 15,337; PolDG, NBH =22,295 ± 3,210, 18 w = 24,870 ± 7,848; (2-tail t-test, n = 4, p > 0.05) suggesting at this stage that microgliosis, astrocytosis and PN nets reduction are independent of neuronal numbers.
Discussion
We induced prion disease in the albino Swiss mice with intracerebral injections of ME7 prion agent and demonstrated that behavioral and neuropathological changes were similar to previous descriptions in the C57BL6J with two differences (1) the septal region and the polymorphic layer of the dentate gyrus were affected earlier with higher indexes of activation of microglia and reactive astrocytes than CA1; (2) on average the disease started 4 weeks later in albino Swiss mice than in C57BL6J; (3) Changes in locomotor activity in the open field start 4 weeks later in albino Swiss mice, however, as in C57BL6 motor coordination was affected at 18 w.p.i. (4) The progression of the behavioral changes was variable in ME7-animals of the albino Swiss mice strain and cluster analysis detect two distinct periods to deficit onset of 12 and 22 weeks, whereas in the C57BL6 the disease progression was homogeneous with a single period to deficit onset of 12 weeks.
Behavioral changes.
One of the aims of the present report was to analyze and compare behavioral changes induced by bi-lateral intra-hippocampal injections of ME7 infected brain homogenate in the albino Swiss mice with present and previous descriptions for the C57BL6J strain.Citation4,Citation31,Citation49,Citation50 These changes were measured by analyzing species-typical behaviors such as burrowing and open field activities which are altered after hippocampal damageCitation29,Citation31 as well as the motor performance in the rod bridge. These behavioral assays revealed significant differences between albino Swiss mice and C57BL6J both in burrowing and locomotor activity in open field: albino Swiss mice behavioral changes start at 12 or 22 w.p.i (burrowing) and 22 w.p.i. (open field), whereas in C57Bl6J behavioral changes start at the 12 (burrowing) and 16 (open field) w.p.i. Thus, after bilateral injections of the same amount of the ME7 infected brain homogenate into the hippocampus of C57Bl6J we confirmed other descriptions published elsewhere at the same time windows.Citation4,Citation31,Citation49–Citation51 Since it has been described that selective damage of the septum-hippocampal cholinergic projections increases locomotor activityCitation52 it is reasonable to propose that the loss of perineuronal nets and gliosis in the septal region contribute to the hyperactivity observed. Similarly axonal changes on the dentate gyrus-to-CA3 projection can alter the modulation of the mossy fiber-CA3 synaptic transmissionCitation53 and thus the observed changes in the PolDG may contribute to the patophysiology of the altered hippocampal-dependent tasks. Combined with our previous descriptions of significant loss of presynaptic terminals in the stratum radiatum of the CA1, which associates with the earliest evidence of hippocampal behavioral dysfunction the results suggest that in both mice strains hippocampal and perhaps septal damage may be part of the anatomical substrate of the impaired species-typical behaviors.Citation54,Citation55
Species-typical behavioral changes during disease progression in albino Swiss mice seem to be heterogeneous, with two different periods of deficit onset (12 and 22 weeks) whereas in C57BL6J no clusters were detected and a single period of incubation to onset of first changes was found (12 weeks). Indeed cluster and discriminant analysis applied to the behavioral data confirmed the occurrence of two subgroups with differential sensitivity to the ME7 agent: around 40% of the subjects start behavioral changes early in the disease (12 w.p.i) and reach terminal stage at 26 w.p.i., whereas the remaining subjects start change burrowing activity later (22 w.p.i.) but also reach terminal stage at 26 w.p.i. Thus burrowing is by far in both strains, the most sensitive task to detect early behavioral changes and the single variable that was able to distinguish differential sensitivity to the ME7 agent. In accord with the behavioral data in albino Swiss mice semi-quantitative analysis of neuropathological changes revealed that only 4 in 9 ME7-anmimals had microglial activation after 12 weeks whereas no differential activation in C57BL6J was found. These differences in C57Bl6 and albino Swiss mice strains demonstrate the presence of strain-dependent mechanisms that control the course of appearance of neurological symptoms of prion disease without affecting survival time. The differences may associated with astrocytic prion clearanceCitation24 or other yet to be discovered mechanisms.
Neuropathological changes and stereology.
In murine prion diseases astrocyte and microglia activation occur relatively early in the disease although the number of neurons remain unaltered at early stages.Citation4,Citation6,Citation7 As disease progresses these non-neuronal cells increase in number with increasing impact on the extracellular matrixCitation8 in association with behavioral changes that are independent of neuronal death.Citation4,Citation7 In line with this evidence in the present report estimates obtained by optical fractionator and calculations of the index of activation of astrocytes and microglia in the hilus, septal region and CA1 we have shown a greater degree of activation in the septum and PolDG than in CA1 with no neuronal losses at these regions, whereas PN nets were reduced to a greater degree in CA1 than in the septal region.
As previous reported in the hippocampus of C57BL6JCitation8 and cortexCitation56 a loss of perineuronal nets was detected early in the disease. As described for the hippocampus of ME7 prion-diseased C57BL6J miceCitation8 we have found in the albino Swiss mice a linear proportional decay between the reduction of PN nets and microgliosis early in the disease. In the present report we have extended this linear correlation between the reduction of PN nets and microglial activation to also include reactive astrocytosis.
We also found after iontophoretic injections of biotinylated dextran amine in the granular layer of ME7-animals but not in the NBH-animals, morphological changes including large varicosities along the mossy fibers with incomplete filling and tracer leakage. Interestingly, a functional impairment in the axonal transport has been described in motor neurons at the onset of clinical prion disease.Citation57 In addition there was previous evidence for dendritic and axonal pathology with abnormal varicosities in both dendrites and axons of prion-diseased animals at early and late stages of the disease but not in control animals.Citation58 Proteins such as kinesin and dynein, two key molecules responsible for axonal transport, are found in axon spheroids in chronic neurodegenerative disorders and their accumulation in spheroids in motor neuronal disease impairs fast axonal transport.Citation59 Finally, a selective presynaptic degeneration is associated with ME7-induced hippocampal pathology and selective reduction of presynaptic protein expression at early stage of the disease.Citation7 Furthermore, this pre-synaptic degeneration is not specific to the ME7 strain of prion disease. It has been shown that ME7, 79A and 22L all show similar temporal profiles of behavioral dysfunction and similar patterns of pre-synaptic terminal loss in the hippocampus and thalamus in late stage disease despite divergent patterns of neuronal loss.Citation60 These synaptic changes are also common to these strains at early stages (Hilton et al. unpublished observations).
Taken together these data support the conclusion that neurodegeneration in murine prion disease start at the synaptic sites,Citation4,Citation7 seems to be aggravated by axonal transport dysfunction without neuronal death at early stages and leaves open the question as to what are the molecular mechanisms that trigger the synaptic changes. One possibility is that the low molecular weight SDS-captured oligomers, which are the most infectiousCitation61,Citation62 could, in an analogy with which has been proposed to Alzheimer's disease, interfere with vesicular release processesCitation63–Citation65 with consequent reduction of the neurotrophic cascades that sustain synaptic function.Citation66
We have detected by multivariate statistical analysis of behavioral data and stereological analysis of neuropathological features that albino Swiss mice seems to present individual variability in the sensitivity to the ME7 prion agent, whereas C57BL6 is a experimental model, with a single and highly reproducible incubation period with well-characterized evolution of behavioral changes. It is reasonable to suggest that the differences between these two murine models of prion disease are related, at least in part, to the less isogenic background of albino Swiss mice as compared to C57BL6, with different timings, and intensities of microglial activation, reactive astrocytosis and reduction of perineuronal nets at the different affected areas. The progression of prion disease had not previously been assessed in Swiss albino mice and the current study indicates that Swiss Albino and C57 have the same survival times (time to death) and thus share the Prnpa allele of the PrP gene, which is known to influence incubation time.Citation67 It is believed that there are several other disease modifying genes in prion diseaseCitation68 and the existence of two discrete sub-groups in the current study suggests that the Swiss Albino mouse may represent a good strain in which to examine this issue. It is of considerable interest that the sub-groups emerged when examining early stage behavioral signs rather than disease incubation per se. The study of the prion disease has relied heavily on the inoculation of wild-type and mutant or transgenic strains with one of a number of prion disease strains and simply assessing the time until death or terminal disease signs. This prevents the analysis of whether there are aspects of behavioral dysfunction (analogous to symptoms in human disease) or neuropathology that are altered in these different strains at earlier stages. It has previously been shown that ME7-inoculated animals deficient in MCP-1/- survive longer than WT controls but actually show very similar progression of behavioral changes.Citation69 Although the strains in the current study do not differ in time to death or terminal symptoms they do show clear differences in the time to onset of different behavioral impairments thus allowing a route to dissect the anatomical substrates of the different deficits observed and the action of the prion agent on different elements of neuronal integrity. In this regard the study of prion-associated neuropathology and behavioral changes in the Swiss Albino mouse could lead to useful insights into the pathophysiology of prion diseases.
Methods
All procedures applied to this investigation were submitted and approved by the institutional animal care committee of the Federal University of Pará. In the present work we have used 40 albino Swiss mice and 14 C57BL6 females, 8 weeks old, obtained from the colony of Instituto Evandro Chagas and handled in accordance with the “Principles of Laboratory Animal Care” (NIH).
Inoculations and experimental groups.
The animals were deeply anesthetized with 2,2,2-tribromoethanol (Sigma-Aldrich) 1% (0.02 ml/g of body weight, intraperitonially) and fixed in a stereotaxic frame (Insight Equipamentos Ltda). After the exposure of the skull, a hole was drilled in each side of the midline to allow the bilateral hippocampal infusion of 1 µl of normal brain homogenate (NBH, 10% w/v) or infected brain homogenate with ME7 agent (10% w/v), kindly donated by V.H. Perry. All injections were made with a 10 µl Hamilton syringe into the dorsal hippocampus with the following stereotaxic coordinates: +1.3 mm from interaural line, ±2.0 mm from the midline and −2.0 mm from the skull surface, adopting bregma as zero reference point.Citation30 After infusion, the needle was left in place for 2 min, to avoid reflux of the solution. The scalp was then sutured and the mice remained in a recovering cage for approximately 4 h.
After recovering, subjects were housed in plastic standard cages (32 × 39 × 16.5 cm) and then transported to Instituto Evandro Chagas (Belém-PA), where they remained until the end of the experiments. All animals were kept in the same room at 23 ± 2°C, with ad libitum access to food and water, and with a 12 h:12 h, light:dark period.
In order to evaluate the neuropathological progression of prion disease and to determine in each stage of the disease possible behavioral changes, subjects were organized in two distinct experiments: (1) comparative behavioral analysis between albino Swiss (n = 17) and C57Bl6 mice (n = 14); (2) Stereological analysis of neuropathology, in albino Swiss mice, of the disease progression at early stage into 4 groups (n = 33), according to the survival time after intrahippocampal injections as follow: Group A: 12 w.p.i. (n = 8); Group B: 15 w.p.i. (n = 9); Group C: 18 w.p.i. (n = 8) and NBH (n = 8).
Behavioral tests.
Burrowing. For 2 h daily (from 09 to 11 h) from the 6 w.p.i.to the 25 w.p.i., all animals were placed in individual plastic cages (49 × 17 × 32.5 cm) containing a PVC tube (20 cm long and 7.2 cm diameter), filled with 150 g of normal diet food pellets. The open end was supported 3 cm above the floor. After 2 h, the remaining food in the cylinders was weighed and the mice returned to their home cage.Citation31
Open-field. The apparatus consisted of a gray PVC box (30 × 30 × 40 cm) with the floor divided into 10 cm squares. Each animal was placed in one corner and remained in the apparatus for 3 min. The number of squares crossed was counted and analyzed. After each session, the open field was cleaned with ethanol 70%.
Rod bridge. To evaluate motor coordination the mice had to cross a 48 cm bridge made of wooden rods separated 2 cm of each other. The time to cross the bridge was recorded.
Biotinylated dextran-amine injections.
Two weeks before the sacrifice at each experimental window, four subjects from each experimental group were anesthetized with 2,2,2-tribromoethanol (0.02 ml/g of body weight, intraperitonially) and receive a single iontophoretic injection of 10% biotinylated dextran amine (BDA) into the right dentate gyrus or left CA1, through a glass micropipette with 10–20 µm internal tip diameter, in the following stereotaxic coordinates: (1) Granular layer of dentate gyrus: AP −2.0 mm, ML ± 1.2 mm and DV-2.0 mm; (2) CA1: −2.0 mm, medio-lateral: 1.7 mm and depth: 1.6 mm relative to bregma.Citation30
Perfusion and histological procedures.
In the 2nd week after BDA injection all subjects were sacrificed at 12, 15 or 18 w.p.i infected or normal brain homogenates with an i.p. overdose of 2,2,2-tribromoethanol, perfused through the left ventricle with heparinized saline for 10 min followed by 4% paraformaldehyde in 0.1 M phosphate buffer, pH 7.2–7.4, for 20 min. Brains were removed from the skull and cut serially at 70 µm thickness on a vibratome in the horizontal plane.
Histochemistry and immunohistochemistry.
As seletive markers for astrocytes and activated microglia we have used the immunoreaction to detect glial fibrilary acidic protein (GFAP) and the histochemical reactions to detect biotinylated Lycopersicum esculentum respectively,Citation32 and Wisteria floribunda was chosen to label perineuronal nets.Citation8,Citation33 Neurons were selectively labeled by immunohistochemistry to detect Neu-N, a nuclear protein that is present in the vast majority of post-mitotic neuronal cells of the vertebrates.Citation34–Citation38 In mice hippocampal formation, area of interest of the present report an extensive series of studies already used Neu-N as selective neuronal marker.Citation39–Citation44
Sections for immunoreactions for GFAP or Neu-N were rinsed in 0.1 M phosphate buffer and then pretreated for antigenic recovering in a solution of boric acid 0.2 M pH 9.0 at 60°C for 1 h. Sections immunoreacted to detect PrPSC were pretreated in formic acid 96%, 30 min, incubated in trypsin 0.05% at room temperature 10 min and then transferred to a solution of 0.1 M citrate buffer, pH 6.0 at 90°C, 1 h. After been rinsed in 0.1 M phosphate-buffered saline (PBS) with Triton X-100 (5%), sections were incubated in a solution of methanol (100%) and hydrogen peroxide 0.3% for 10 min. After washing in PBS, the protocol of Mouse-on-Mouse (MOM) Blocking Kit (Vector Laboratories, Burlingame, CA) was conducted as follow: MOM IgG blocking for 1 h, primary antibody for 72 h (GFAP 1:800; and PrPSC 1:50 diluted in 0.1 M PBS), washed in 0.1 M PBS three times 5 min followed by MOM Biotinylated Anti-Mouse IgG Reagent for 12 h. Sections were transferred to avidin-biotin-peroxidase complex (ABC) solution for 1 h and washed again before incubation in acetate buffer 0.2 M pH 6.0 for 5 min and revealed in GND solution (diaminobenzidine 0.5 mg/ml, ammonium nickel chloride 0.6 mg/ml and glucose oxidase). All steps were carried out under gently and constant agitation. All chemicals used were supplied by Sigma-Aldrich (Poole, UK) and Vector Laboratories (Burlingame, CA), and the primary antibodies for GFAP MAB360, and Neu-N MAB377 were supplied by Chemicon (CA) and the MCA2460 primary antibody against protease resistant isoform PrPSC by AbD Serotec (Oxford, UK). Sections used for histochemical reactions to detect biotinylated (tomato) Lycopersicum esculentum and Wisteria floribunda (Vector Laboratories, Burlingame, CA), were rinsed in PBS Triton 5% for 20 min and transferred to a solution of methanol and hydrogen peroxidase 0.3% for 10 min to inhibit endogenous peroxidase. After washes in PBS, sections were incubated in the lectin solutions (6 µg/ml) overnight at 4°C and then placed in ABC solution for 1 h and revealed with GND solution as described previously for immunohistochemistry. Reacted sections were mounted, dehydrated in alcohol series, cleared in xylenes, counterstained by Nissl and coversliped with enthelan (Merck, Darmstadt, Germany) embedding medium.
Microscopy and optical fractionator.
We delineated at all levels in the histological sections the regions of interest, digitizing directly from sections using low power 3.2x objective on a Optiphot-2 microscope (Nikon, Japan) equipped with a motorized stage (MAC200, Ludl Electronic Products, Hawthorne, NY). This system was coupled to a computer running Stereoinvestigator software (MicroBrightField, Williston, VT) used to store and analyzed x, y and z coordinates of digitized points. In order to detect and count unambiguously the objects of interest in the dissector probe low power objective was replaced by a 60x oil immersion planapochromatic objective (NIKON, NA 1.4). Tables S1 and S2 present experimental parameters and average counting results from the optical fractionator. The level of acceptable errors of the stereological estimations was defined by the ratio between the intrinsic error introduced by the methodology and the coefficient of the variation.Citation45,Citation46 The CE expresses the accuracy of the cell number estimates, and a value of CE ≤0.10 was deemed appropriate for the present study because variance introduced by the estimation procedure contributes little to the observed group variance.Citation45,Citation46 The experimental parameters for each cell marker and regions were established in pilot experiments and uniformly applied to all animals for each marker and region of interest.
Absolute numbers and relative indexes of activation.
Since the present report compares different areas and volumes and the number of neurons, perineuronal nets and glia in each area absolute numbers are difficult to interpret. To aid in the interpretation of the data we thought it was helpful to apply a relative scale and proportional index to estimate the degree of microglial activation or reactive astrocytosis in each region of interest as follow: AI18w/NBH = (ME718w − NBH)/(ME718w + NBH) where AI is the activation index at 18 w.p.i. and ME718w and NBH are the estimates of the number of objects of interest in each region in the two experimental groups. Similarly the activation index between ME715w and ME718w weeks were estimated and applied to different markers AI18w/15w = (ME718w − ME715w)/(ME718w + ME715w). To express the relative reduction in the number of perineuronal nets we applied a reduction index (RI) that was estimated by the following equation RI18w/NBH = (ME718w − NBH)/(ME718w + NBH) or RI15w/18w = (ME715w − ME718w)/(ME715w + ME7 18w) or RI15w/NBH = (ME715w − ME7NBH)/(ME715w + NBH) where RI is the reduction index in the period and ME718w, ME715w and NBH are the estimates of the number of objects of interest at 15 and 18 w.p.i. ME7- and NBH-animals. This relative scale for both indexes varies between 0 and 1 and permits direct comparisons between analyzed regions, intra- and inter-groups.
Cluster analysis.
All of the quantitative variables (burrowing, open field and rod bridge) were submitted to an initial cluster analysis (tree clustering method, Euclidean distance and complete linkage). We applied this multivariate statistical procedure to our sample of behavioral data to search for possible classes of change as a function of time unit of disease progression expressed in two week intervals. The classes suggested by cluster analysis were assessed by a forward stepwise discriminant function analysis. Discriminant function analysis is used to determine which variables discriminate between two or more naturally occurring groups. The basic idea underlying this procedure is to determine whether groups differ with regard to the mean of a variable, and then to use that variable to predict group membership. The software used in the present paper (Statsoft) performed comparisons between a matrix of total variances and covariances, as well as between matrices of pooled within-group variances and covariances. These matrices were compared via multivariate F tests in order to determine whether or not there are any significant differences (with regard to all variables) between groups. In the stepforward discriminant function analysis, the computer program “builds” a model of discrimination step-by-step. In this model, at each step, the software reviews all variables and evaluates which one will contribute most to the discrimination between groups. We applied this procedure to behavioral variables in order to determine which variables provided the best separation of classes suggested by cluster analysis. In addition, arithmetic mean and standard deviation were calculated for the variables chosen as best predictors for groups. Parametric statistical analyses by ANOVA, one-way, Bonferroni a priori test, were applied and statistical differences between groups was accepted as significant at 95% confidence interval (p < 0.05).
Coefficient of correlations and regressions were also calculated for the stereological neuropathological data combining different markers. All statistical procedures were performed by using Statistica 6 (Statsoft) or Bioestat 4.0.Citation47
Regions and objects of interest.
See Figure S1 in supplementary material that the polymorphic layer, one of the regions of interest, is part of the dentate gyrus where we recognize a characteristic laminar organization of its principal cells, the granular neurons (Fig. S1A).Citation48 The limits of CA1/CA2/CA3 were defined by immunohistochemistry for Neu-N (Fig. S1A and insert) and by architectonic differences in the neuropil after histochemistry for Wisteria floribunda where CA2 appears darker than CA1 and CA3 (Fig. S91B). Perineuronal nets estimates included two types of nets: type I that corresponds to perisomatic and peridendritic nets including secondary tertiary branches and type II which corresponds to perisomatic and faint primary dendrites (Fig. S1C). For counting estimates in the septal area, the most ventral sampled section included the septal region limited lateral and posteriorly by the lateral and 3rd ventricles, whereas the most dorsal sampled section was selected by choosing the very first dorsal section of the same series where the septal region still can be recognized between the corpus callosum and the hippocampal fimbria (Fig. S1D).
Photomicrographic documentation and processing.
Photomicrographs were taken using a digital camera (Microfire, Optronics, CA) coupled to a Nikon microscope (Optiphot-2, NY). Digital images were processed using Adobe Photoshop 7.0 for scaling and adjusting the levels of brightness and contrast. Selected pictures in the figures were taken from sections of the subjects of each experimental group with total numbers of objects of interest nearest the mean value of each region of interest.
Disclosure of Potential Conflicts of Interest
No potential conflicts of interest were disclosed.
Figures and Tables
Figure 1 (A) Graphic representation of the behavioral changes in C57BL6 and albino Swiss mice models of prion disease. Left, middle and right columns correspond to burrowing, open field and rod bridge performances. Top and middle rows illustrate average values to C57BL6 and albino Swiss whereas bottom row illustrate two different subgroups (ME7-E) and (ME7-L) that start to behavioral deficits early and late respectively. (B) Cluster and discriminant analysis at 18 w.p.i. to demonstrate the presence of distinct sensitivity to ME7 agent. Note that on average C57BL6 start to change burrowing at 12 w.p.i. whereas albino Swiss mice only start 4 weeks later. ME7-E start at the same time as C57BL6, whereas ME7-L 10 weeks later. Open field activity starts to increase on average at 16 w.p.i. in C57Bl6 whereas in albino Swiss mice start 6 weeks later. C57BL6 and albino Swiss mice show the onset of impairments of motor coordination at the same time (18 w.p.i.). Despite statistical significant differences between ME7-animals and NBH-animals, cluster analysis did not detect subgroups in the open field and rod bridge performances.
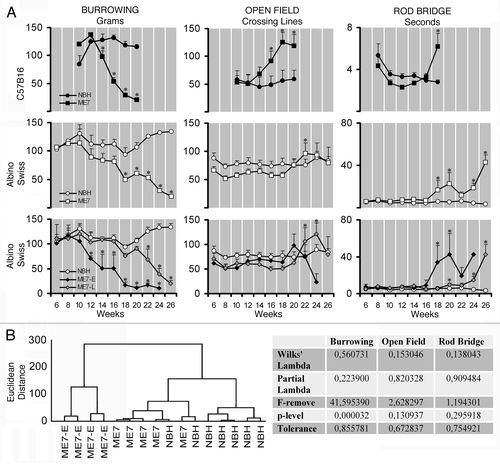
Figure 2 Photomicrographs of hippocampal region of ME7 subjects at 18 w.p.i. after Neu-N (A) and PrP (B) immunohistochemistry to illustrate vacuoles and PrPSc deposits (white arrows) respectively. Photomicrographs of ME7-animal (C) and NBH-animal (D) mossy fibers at 18 w.p.i. Black arrows indicate damaged axons with boutons tumefaction, and reduction of the axonal filling in the ME7 infected brain whereas in the NBH-animal these signs are not present. Scale bars: (A and B) 250 µm; (C and D) 25 µm.
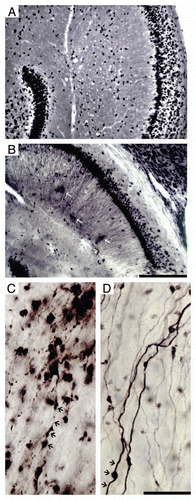
Figure 3 Photomicrographs of the polymorphic layer of dentate gyrus of ME7 subjects at 12 w.p.i. after Lycopersicum esculentum histochemistry (n = 9) to illustrate microglial activation early in the disease. Right column show early microglial activation in 4 infected subjects (ME7-E) as compared with 4 subjects without early microglia activation (left column, ME7-L). Scale bar: 25 µm.
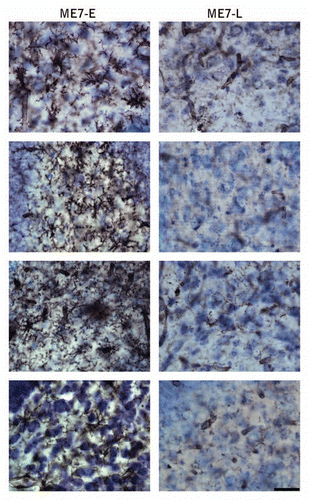
Figure 4 Top and bottom: low and high power photomicrographics of the polymorphic layer of dentate gyrus (PolDG) and CA1 of GFAP immunostained sections after 15 or 18 w.p.i. Graphic representations illustrate the mean values and error bars of the total number of astrocytes in the PolDG (left) and CA1 (middle) and of the activation index (right) of reactive astrocytes in CA1 and polymorphic layer. Activation index was estimated by the following equation AI18/NBH = (ME718w − NBH)/(ME718w + NBH) or AI18/15 = (ME718w − ME715w)/(ME718w + ME7 15w) or AI15/NBH = (ME715w − NBH)/(ME715w + NBH) where AI is the activation index in the period and ME718w, ME715w and NBH are the estimates of the number of objects of interest at 15 and 18 w.p.i. in each region for each experimental group. Significant differences are indicated by (*) and the probability values by p level; (*) = 0.05; (**) = 0.025; (***) = 0.01. Scale bars: Scale bars: low power 250 µm; high power 25 µm.
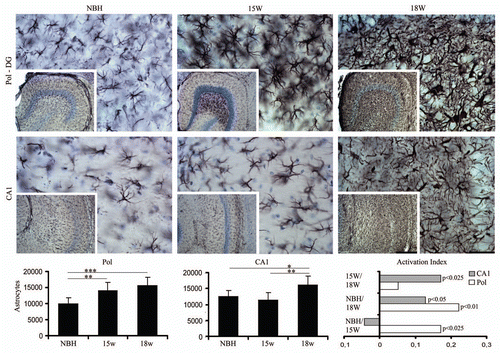
Figure 5 Top and bottom: low and high power photomicrographs of the polymorphic layer of dentate gyrus (Pol-DG) and CA1 of activated microglia stained with Lycopersicum esculentum histochemistry after 15 or 18 w.p.i. Graphic representations illustrate the mean values and error bars of the total number of activated microglia in the polymorphic layer of dentate gyrus (left) and CA1 (middle) and of the activation index (right) of microglia in CA1 and polymorphic layer. Activation index was estimated by the following equation AI18/NBH = (ME718w − NBH)/(ME718w + NBH) or AI18/15 = (ME718w − ME715w)/(ME718w + ME7 15w) or AI15/NBH = (ME715w − NBH)/(ME715w + NBH) where AI is the activation index in the period and ME718w, ME715w and NBH are the estimates of the number of objects of interest at 15 and 18 w.p.i. in each region for each experimental group. Significant differences are indicated by (*) and the probability values by p level; (*) = 0.05; (**) = 0.025; (***) = 0.01. Scale bars: Scale bars: low power 250 µm; high power 25 µm.
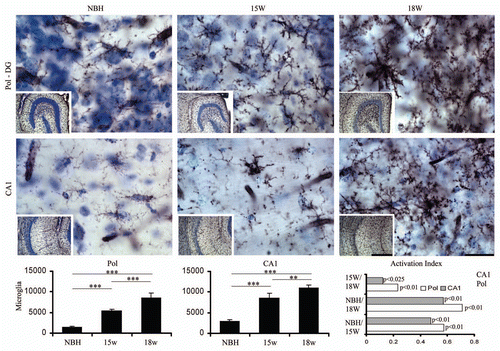
Figure 6 Septal region, low and high power, photomicrographs to illustrate GFAP (top) and Lycopersicum esculentum (bottom) reacted sections after 15 or 18 w.p.i. Graphic representations illustrate the mean values and error bars of the total number of astrocytes and activated microglia in the septal region and corresponding activation index. Activation index was estimated by the following equation AI18/NBH = (ME718w − NBH)/(ME718w + NBH) or AI18/15 = (ME718w − ME715w)/(ME718w + ME7 15w) or AI15/NBH = (ME715w − NBH)/(ME715w + NBH) where AI is the activation index in the period and ME718w, ME715w and NBH are the estimates of the number of objects of interest at 15 and 18 w.p.i. in each region for each experimental group. Significant differences are indicated by (*) and the probability values by p level; (*) = 0.05; (**) = 0.025; (***) = 0.01. Scale bars: Scale bars: low power 250 µm; high power 25 µm.
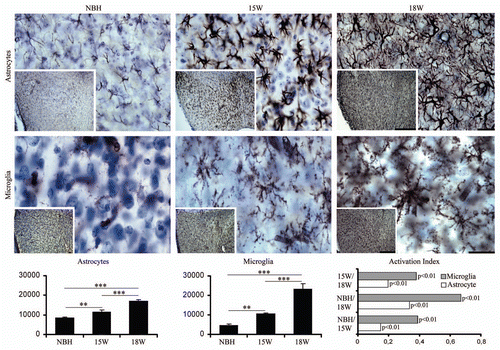
Figure 7 Top and middle: low and high power photomicrographs of CA1 and septum of sections stained for biotinylated Wisteria floribunda to demonstrate perineuronal nets after 15 or 18 w.p.i. of infected (15 w, 18 w) or normal brain (NBH) homogenates. Bottom: graphic representations of the mean and error bars estimations of the total number of perineuronal nets in CA1 (left) and septum (middle) and of the reduction index (right) of perineuronal nets in CA1 (white bars) and septum (grey bars). Reduction index was estimated by the following equation RINBH/18 = (ME718w − NBH)/(ME718w + NBH) or RI15/18 = (ME715w − ME718w)/(ME715w + ME7 18w) or RINBH/15 = (ME7NBH − ME715w)/(NBH + ME715w) where RI is the reduction index in the period and ME718w, ME715w and NBH are the estimations of the number of objects of interest at 15 and 18 w.p.i. of ME7 infected or normal brain (NBH) homogenates in each region for each experimental group. Significant differences are indicated by *p < 0.05 or **p < 0.01.
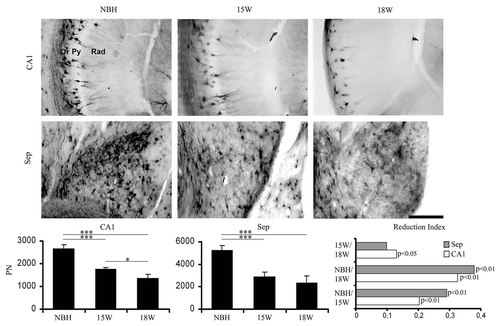
Figure 8 Overview of the total numbers of astrocytes, microglia and PN nets estimations in the septum (top) and CA1 (bottom). Note that the total number of perineuronal nets (PN) decrease along the disease progression whereas astrocytes and microglia increase. White and black columns correspond to astrocytes and microglia respectively whereas data points correspond to PN nets estimations.
Additional material
Download Zip (481.1 KB)References
- Prusiner SB. Shattuck lecture—neurodegenerative diseases and prions. N Engl J Med 2001; 344:1516 - 1526
- Aguzzi A, Sigurdson C, Heikenwaelder M. Molecular mechanisms of prion pathogenesis. Annu Rev Pathol 2008; 3:11 - 40
- Chiti Z, Knutsen OM, Betmouni S, Greene JR. An integrated, temporal study of the behavioral, electrophysiological and neuropathological consequences of murine prion disease. Neurobiology of disease 2006; 22:363 - 373
- Cunningham CR, Deacon H, Wells D, Boche S, Waters CP, Diniz, et al. Synaptic changes characterize early behavioral changes in the ME7 model of murine prion disease. Eur J Neurosci 2003; 17:2147 - 2155
- Betmouni S, Perry VH. The acute inflammatory response in CNS following injection of prion brain homogenate or normal brain homogenate. Neuropathol Appl Neurobiol 1999; 25:20 - 28
- Betmouni S, Perry VH, Gordon JL. Evidence for an early inflammatory response in the central nervous system of mice with scrapie. Neuroscience 1996; 74:1 - 5
- Gray BC, Siskova Z, Perry VH, O'Connor V. Selective presynaptic degeneration in the synaptopathy associated with ME7-induced hippocampal pathology. Neurobiology of disease 2009; 35:63 - 74
- Franklin S, Love S, Greene J, Betmouni S. Loss of Perineuronal Net in ME7 Prion Disease. J Neuropathol Exp Neurol 2008; 67:189 - 199
- West MJ, Slomianka L, Gundersen HJ. Unbiased stereological estimation of the total number of neurons in thesubdivisions of the rat hippocampus using the optical fractionator. Anat Rec 1991; 231:482 - 497
- Schmitz C, Hof PR. Design-based stereology in neuroscience. Neuroscience 2005; 130:813 - 831
- Stark AK, Pelvig DP, Jorgensen AM, Andersen BB, Pakkenberg B. Measuring morphological and cellular changes in Alzheimer's dementia: a review emphasizing stereology. Current Alzheimer research 2005; 2:449 - 481
- West MJ. Design-based stereological methods for counting neurons. Prog Brain Res 2002; 135:43 - 51
- Bonthius DJ, McKim R, Koele L, Harb H, Karacay B, Mahoney J, et al. Use of frozen sections to determine neuronal number in the murine hippocampus and neocortex using the optical disector and optical fractionator. Brain Res Brain Res Protoc 2004; 14:45 - 57
- Gundersen H, Jensen E. The efficiency of systematic sampling in stereology and its prediction. J Microsc 1987; 147:229 - 263
- Casarrubea M, Sorbera F, Crescimanno G. Multivariate analysis of the modifications induced by an environmental acoustic cue on rat exploratory behavior. Physiol Behav 2008; 93:687 - 696
- Casarrubea M, Sorbera F, Crescimanno G. Multivariate data handling in the study of rat behavior: an integrated approach. Behav Res Methods 2009; 41:772 - 781
- Hilborn JV, Strauss E, Hultsch DF, Hunter MA. Intraindividual variability across cognitive domains: investigation of dispersion levels and performance profiles in older adults. J Clin Exp Neuropsychol 2009; 31:412 - 424
- Bitsika V, Sharpley CF, Orapeleng S. An exploratory analysis of the use of cognitive, adaptive and behavioral indices for cluster analysis of ASD subgroups. J Intellect Disabil Res 2008; 52:973 - 985
- Hybels CF, Blazer DG, Pieper CF, Landerman LR, Steffens DC. Profiles of depressive symptoms in older adults diagnosed with major depression: latent cluster analysis. Am J Geriatr Psychiatry 2009; 17:387 - 396
- Lane AE, Young RL, Baker AE, Angley MT. Sensory Processing Subtypes in Autism: Association with Adaptive Behavior. J Autism Dev Disord 2009;
- Cancellotti E, Barron RM, Bishop MT, Hart P, Wiseman F, Manson JC. The role of host PrP in Transmissible Spongiform Encephalopathies. Biochim Biophys Acta 2007; 1772:673 - 680
- Moody LR, Herbst AJ, Aiken JM. Upregulation of interferon-gamma-induced genes during prion infection. J Toxicol Environ Health A 2011; 74:146 - 153
- Perry VH. The influence of systemic inflammation on inflammation in the brain: implications for chronic neurodegenerative disease. Brain Behav Immun 2004; 18:407 - 413
- Kranich J, Krautler NJ, Falsig J, Ballmer B, Li S, Hutter G, et al. Engulfment of cerebral apoptotic bodies controls the course of prion disease in a mouse strain-dependent manner. J Exp Med 2010; 207:2271 - 2281
- Lloyd SE, Onwuazor ON, Beck JA, Mallinson G, Farrall M, Targonski P, et al. Identification of multiple quantitative trait loci linked to prion disease incubation period in mice. Proc Natl Acad Sci USA 2001; 98:6279 - 6283
- Sandberg MK, Al-Doujaily H, Sharps B, Clarke AR, Collinge J. Prion propagation and toxicity in vivo occur in two distinct mechanistic phases. Nature 2011; 470:540 - 542
- Iyegbe CO, Abiola OO, Towlson C, Powell JF, Whatley SA. Evidence for varied aetiologies regulating the transmission of prion disease: implications for understanding the heritable basis of prion incubation times. PLoS One 2010; 5:14186
- Foster JD, Davies DJ, Fraser H. Primary retinopathy in scrapie in mice deprived of light. Neurosci Lett 1986; 72:111 - 114
- Cunningham C. Brown D. Mouse behavioral studies and what they can teach us about prion diseses. Neurodegeneration and prion disese 2005; New York, NY Springer Science + Business Media, Inc. 111 - 137
- Paxinos G, Franklin K. The mouse brain in stereotaxic coordinates 2001; London, UK Academic Press
- Deacon R, Raley J, Perry V, Rawlins J. Burrowing into prion diasease. Neuroreport 2001; 12:2053 - 2057
- Streit WJ. Microglial response to brain injury: a brief synopsis. Toxicol Pathol 2000; 28:28 - 30
- Bruckner G, Grosche J, Hartlage-Rubsamen M, Schmidt S, Schachner M. Region and lamina-specific distribution of extracellular matrix proteoglycans, hyaluronan and tenascin-R in the mouse hippocampal formation. J Chem Neuroanat 2003; 26:37 - 50
- Magavi SS, Leavitt BR, Macklis JD. Induction of neurogenesis in the neocortex of adult mice. Nature 2000; 405:951 - 955
- Edgar MA, Rosenblum MK. The differential diagnosis of central nervous system tumors: a critical examination of some recent immunohistochemical applications. Archives of pathology & laboratory medicine 2008; 132:500 - 509
- Ambrogini P, Lattanzi D, Ciuffoli S, Agostini D, Bertini L, Stocchi V, et al. Morpho-functional characterization of neuronal cells at different stages of maturation in granule cell layer of adult rat dentate gyrus. Brain Res 2004; 1017:21 - 31
- Kumar SS, Buckmaster PS. Neuron-specific nuclear antigen NeuN is not detectable in gerbil subtantia nigra pars reticulata. Brain Res 2007; 1142:54 - 60
- Darlington PJ, Goldman JS, Cui QL, Antel JP, Kennedy TE. Widespread immunoreactivity for neuronal nuclei in cultured human and rodent astrocytes. Journal of neurochemistry 2008; 104:1201 - 1209
- Zhao N, Zhong C, Wang Y, Zhao Y, Gong N, Zhou G, et al. Impaired hippocampal neurogenesis is involved in cognitive dysfunction induced by thiamine deficiency at early pre-pathological lesion stage. Neurobiology of disease 2008; 29:176 - 185
- von Bohlen Und Halbach O. Immunohistological markers for staging neurogenesis in adult hippocampus. Cell and tissue research 2007; 329:409 - 420
- Takahashi T, Zhu Y, Hata T, Shimizu-Okabe C, Suzuki K, Nakahara D. Intracranial self-stimulation enhances neurogenesis in hippocampus of adult mice and rats. Neuroscience 2008;
- Kempermann G, Gast D, Kronenberg G, Yamaguchi M, Gage FH. Early determination and long-term persistence of adult-generated new neurons in the hippocampus of mice. Development (Cambridge, England) 2003; 130:391 - 399
- Clark PJ, Brzezinska WJ, Thomas MW, Ryzhenko NA, Toshkov SA, Rhodes JS. Intact neurogenesis is required for benefits of exercise on spatial memory but not motor performance or contextual fear conditioning in C57BL/6J mice. Neuroscience 2008; 155:1048 - 1058
- Brandt MD, Jessberger S, Steiner B, Kronenberg G, Reuter K, Bick-Sander A, et al. Transient calretinin expression defines early postmitotic step of neuronal differentiation in adult hippocampal neurogenesis of mice. Molecular and cellular neurosciences 2003; 24:603 - 613
- Slomianka L, West M. Estimators of the precision of stereological estimates: an example based on the CA1 pyramidal cell layer of rats. Neuroscience 2005; 136:757 - 767
- Glaser EM, Wilson PD. The coefficient of error of optical fractionator population size estimates: a computer simulation comparing three estimators. Journal of Microscopy 1998; 192:163 - 171
- Ayres M, Ayres JR M, Ayres DL, SANTOS AS. BioEstat 4.0: Aplicações estatísticas nas áreas das ciências biológicas e médicas 2005; Belém Sociedade Civil Mamirauá, Brasília CNPq
- Amaral DG, Scharfman HE, Lavenex P. The dentate gyrus: fundamental neuroanatomical organization (dentate gyrus for dummies). Prog Brain Res 2007; 163:3 - 22
- Guenther K, Deacon RM, Perry VH, Rawlins JN. Early behavioral changes in scrapie-affected mice and the influence of dapsone. Eur J Neurosci 2001; 14:401 - 409
- Betmouni S, Deacon RMJ, Rawlins JNP, Perry VH. Behavioral consequences of prion disease targeted to the hippocampus in a mouse model of scrapie. Psychobiology 1999; 27:63 - 71
- Cunningham C, Wilcockson D, Campion S, Lunnon K, Perry V. Central and Systemic Endotoxin Challenges Exacerbate the Local Inflammatory Response and Increase Neuronal Death during Chronic Neurodegeneration. The Journal of Neuroscience 2005; 25:9275 - 9284
- Moreau PH, Cosquer B, Jeltsch H, Cassel JC, Mathis C. Neuroanatomical and behavioral effects of a novel version of the cholinergic immunotoxin mu p75-saporin in mice. Hippocampus 2008; 18:610 - 622
- Kobayashi K. Targeting the hippocampal mossy fiber synapse for the treatment of psychiatric disorders. Mol Neurobiol 2009; 39:24 - 36
- Broom KA, Anthony DC, Lowe JP, Griffin JL, Scott H, Blamire AM, et al. MRI and MRS alterations in the preclinical phase of murine prion disease: association with neuropathological and behavioral changes. Neurobiology of disease 2007; 26:707 - 717
- Deacon RM, Rawlins JN. Hippocampal lesions, species-typical behaviours and anxiety in mice. Behav Brain Res 2005; 156:241 - 249
- Guentchev M, Groschup MH, Kordek R, Liberski PP, Budka H. Severe, early and selective loss of a subpopulation of GABAergic inhibitory neurons in experimental transmissible spongiform encephalopathies. Brain Pathol 1998; 8:615 - 623
- Ermolayev V, Cathomen T, Merk J, Friedrich M, Hartig W, Harms GS, et al. Impaired axonal transport in motor neurons correlates with clinical prion disease. PLoS Pathog 2009; 5:1000558
- Picanco-Diniz CW, Boche D, Gomes-Leal W, Perry VH, Cunningham C. Neuropil and neuronal changes in hippocampal NADPH-diaphorase histochemistry in the ME7 model of murine prion disease. Neuropathol Appl Neurobiol 2004; 30:292 - 303
- Toyoshima I, Sugawara M, Kato K, Wada C, Hirota K, Hasegawa K, et al. Kinesin and cytoplasmic dynein in spinal spheroids with motor neuron disease. J Neurol Sci 1998; 159:38 - 44
- Cunningham C, Deacon RM, Chan K, Boche D, Rawlins JN, Perry VH. Neuropathologically distinct prion strains give rise to similar temporal profiles of behavioral deficits. Neurobiology of disease 2005; 18:258 - 269
- Silveira JR, Raymond GJ, Hughson AG, Race RE, Sim VL, Hayes SF, et al. The most infectious prion protein particles. Nature 2005; 437:257 - 261
- Aguzzi A, O'Connor T. Protein aggregation diseases: pathogenicity and therapeutic perspectives. Nat Rev Drug Discov 2010; 9:237 - 248
- Lacor PN, Buniel MC, Furlow PW, Clemente AS, Velasco PT, Wood M, et al. Abeta oligomer-induced aberrations in synapse composition, shape and density provide a molecular basis for loss of connectivity in Alzheimer's disease. J Neurosci 2007; 27:796 - 807
- Arendt T. Synaptic degeneration in Alzheimer's disease. Acta Neuropathol 2009; 118:167 - 179
- Nimmrich V, Ebert U. Is Alzheimer's disease a result of presynaptic failure? Synaptic dysfunctions induced by oligomeric beta-amyloid. Rev Neurosci 2009; 20:1 - 12
- Chen TJ, Wang DC, Chen SS. Amyloid-beta interrupts the PI3K-Akt-mTOR signaling pathway that could be involved in brain-derived neurotrophic factor-induced Arc expression in rat cortical neurons. Journal of neuroscience research 2009; 87:2297 - 2307
- Westaway D, Goodman PA, Mirenda CA, McKinley MP, Carlson GA, Prusiner SB. Distinct prion proteins in short and long scrapie incubation period mice. Cell 1987; 51:651 - 662
- Lloyd S, Mead S, Collinge J. Genetics of Prion Disease. Top Curr Chem 2011;
- Felton LM, Cunningham C, Rankine EL, Waters S, Boche D, Perry VH. MCP-1 and murine prion disease: separation of early behavioral dysfunction from overt clinical disease. Neurobiology of disease 2005; 20:283 - 295