 ?Mathematical formulae have been encoded as MathML and are displayed in this HTML version using MathJax in order to improve their display. Uncheck the box to turn MathJax off. This feature requires Javascript. Click on a formula to zoom.
Abstract
Cytoplasmic pH has long been considered to act as a secondary messenger of various cellular responses by affecting the ionization state of proteins.1 In plant biology, cytoplasmic pH has traditionally been measured, especially in guard cells and as a response to plant microorganism interactions, with pH-sensitive microelectrodes.2 More recently, the development of fluorescent pH markers, such as BCECF and SNARF-1, has allowed us to monitor cytoplasmic pH without the need for electrophysiological equipment. However, because of vacuolar structures that occupy a large volume of plant cells, simple measurements of fluorescent intensities are insufficient to provide precise cytoplasmic pH values. In this addendum, we describe our improved method to monitor cytoplasmic pH in plant cells stained by SNARF-1 by image processing using a noise-reducing filter after determination of an optimal ROI size. In addition, further developments for automated region extraction are proposed.
The Principles of pH Measurements by SNARF-1 Staining and Image Aquisition
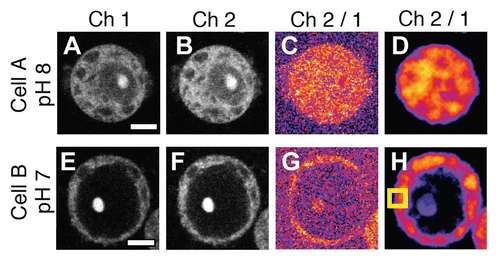
SNARF-1 is a fluorescent dye that undergoes pH-dependent changes in its fluorescent spectrum, and has been used to obtain stable recordings between pH 6.5 and 8.5.Citation3 As SNARF-1 has an isoemissive (pH-insensitive) point of approx. 604 nm, fluorescent intensities are usually measured at the shorter and longer wave-lengths of the isoemissive point. The pH values are then calculated from the ratio of these intensities with the ‘fluoerescent ratiometry’ technique that provides pH values independent of the dye concentration and its fluorescent intensity.Citation3 In plant cells, changes in intracellular pH of guard cells were measured with this technique.Citation4 In our study, we incubated tobacco BY-2 protoplasts with the ester-formed SNARF-1 (SNARF-1 carboxylic acid acetate succinimidyl ester; Molecular Probes) for 30 min to vitally stain the cytoplasm. The non-fluorescent ester-form was membrane permeable and converted to its fluorescent form by the cellular esterase activity. Upon image acquisition, SNARF-1 was excited by laser beams at 488 nm and fluorescent intensities of 540–590 nm (channel 1) and 610–670 nm (channel 2) were obtained (, B, E and F) by the PMT detector equipped on the confocal laser scanning microscope (Leica TCS SP5).Citation5
Effects of Noise-Reducing Filters on the Analysis of Fluorescent Intensities
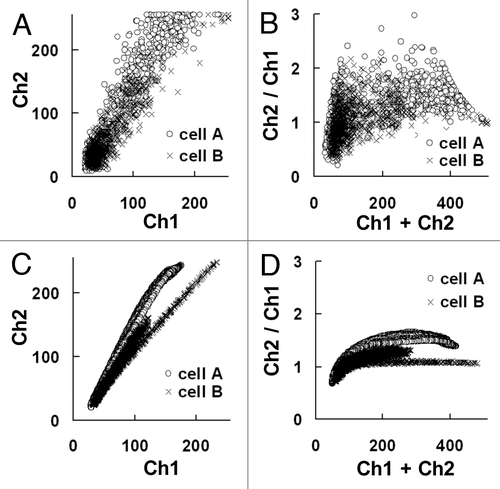
To examine the relationship between the fluorescent intensity values and cytoplasmic pH, cells with adjusted cytoplasmic pH values were monitored. The cells were incubated in a pH-adjusted buffer after equilibration of the external and internal pH by the K+/H+ exchanger, nigericin.Citation3 Although the ratio of the fluorescent intensities obtained by the two channels was expected to reflect the pH value, the simple calculation of ratios did not provide reliable values because of a significant amount of noise in the images ( and G). In a scatter-plot of the fluorescent intensities, in which the data points from cells A (pH 8.0) and B (pH 7.0) were linearly distributed, the differences in slopes between these lines represented the differences in pH values of the cells. However, because of the limited signal-to-noise ratio (SNR) of the fluorescent intensities, there was considerable overlap of the data point distributions (). When the sum and the ratio of the fluorescent intensities in channel 1 and 2 were plotted, the ratio values were indicative of the pH, however, differences in pH values between these cells were still not clear (). One reason for such noise could be the limited concentration of cytoplasmic SNARF-1 for vital staining, although ectopic pH differences caused by organelles, such as cell nuclei and vacuoles, may have also contributed to the noise level.
The low SNR of the original images could be partly improved by processing with noise-reducing filters.Citation6–Citation8 For example, application of an averaging filterCitation9,Citation10 of 5 pixels in radius on every channel reduced the image noise ( and H). In the scatter plot, the data points were linearly distributed after averaging filter processing (compare and C). Similarly, differences in the ratio values between cells A and B became more distinct (compare and D).
Determination of an Optimal ROI Size by Monitoring MSE in the Regression Lines
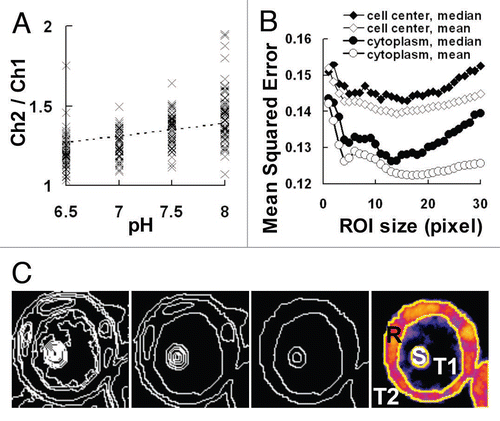
In cells with adjusted pH values, the channel ratios increased in parallel with the pH values (). The regression line obtained by the least-square method (dotted-line in ) was evaluated by the MSE (mean squared error), and the lower MSE value was found to provide a regression line of better fitting. We defined the MSE as follows:
where N is the number of samples, xi and yi are the pH and Ch2/Ch1 values of i-th samples, and f and h are the slope and intersection of the regression line, respectively.
To further reduce image noise, the MSE values were evaluated with changes in the ROI (region of interest) size, and the optimal ROI size was consequently found to be about 10 pixels (). The large MSE values at the small ROI size may have resulted from the large effect of image noise, whereas those observed at the large ROI size may have been due to contamination of non-stained regions both outside and inside of the cells. In addition, establishment of the ROI within the cytoplasm provided better MSE values than in the cell center where differences may have been due to the large volume of vacuoles occupying the cells. When we used a median filter, another common filter for noise reduction, the averaging filter processing showed even lower MSE values. In our previous study, we finally reduced image noise by using the averaging filter after determining the optimal ROI size in the cytoplasm according to the evaluation of MSE.Citation5
Automatic Extraction of the Region of Interest
Theoretically, the value of the ratio is expected to be constant at a specific pH value independent of the staining conditions. However, significantly low ratio values were found in regions with low fluorescent intensities ( and Ch2/Ch1 values below about 1.0). This implies a bias in which cell regions with insufficient SNARF-1 staining showed low pH values. Therefore, selection of cell regions that are adequately stained with SNARF-1 are essential for removal of these bias effects.
In our previous work,Citation5 the ROI for cytoplasmic pH measurements was positioned manually by setting a square region within the cytoplasm. Although such manual setting was relatively simple, large-scale processing will require automated image extraction, and so we have examined such a system.Citation11,Citation12 Indeed, such a strategy may be essential in the extraction of cytoplasmic regions, especially in plant cells that are occupied by large vacuoles. In this approach, images were first segmented into the smallest possible size, the pixel, and neighboring regions with high levels of similarity then connected (). The similarity was evaluated by the distance between the two data points in the scatter-plots in which the shorter distance showed the highest similarity. From the most segmented image of cell B (), connection of neighboring regions on the basis of similarity decreased the number of regions (). Finally, cell B was extracted automatically into the four regions of the cytoplasm (R), cell nuclei or nucleus (S), vacuole (T1) and cell exterior (T2). The automatic extraction saved a large amount of image processing hours and eliminated the possibility of human error. Further improvements in the automated extraction are expected to provide precise pH values in cells containing intracellular structures even during large-scale processing.
Abbreviations
| MSE | = | mean squared error |
| PMT | = | photomultiplier tube |
| ROI | = | region of interest |
| SNARF-1 | = | seminaphthorhodafluor-1 |
| SNR | = | signal-to-noise ratio |
Figures and Tables
Figure 1 Typical images of tobacco BY-2 protoplasts stained by SNARF-1. (A–D) and (E–H) show images of a cell adjusted to pH 8.0 (Cell A) or pH 7.0 (Cell B), respectively. (A and E), (B and F) and (C and G) show images obtained from channel 1 (Ch1, 540–590 nm), channel 2 (Ch2, 610–670 nm) and the ratio of channel 2 and 1 (Ch 2/1), respectively. (D and H) show images processed by an averaging filter with a radius of 5 pixels in every channel. The box in (H) shows a square region of 10 pixels used for ROI setting. The bar represents 10 µm.

Figure 2 Scatter plots of the image florescent intensities. (A and B) Scatter plots of fluorescent intensities obtained from images in , B, E and F, respectively. (C and D) Scatter plots from images after processing with an averaging filter of 10 pixels in radius.

Figure 3 Regression line for pH monitoring and its evaluation by MSE. (A) Scatter plot of the channel ratio in cells adjusted to pH 6.5 to 8.0. The regression line obtained by the least-square method is shown as a dotted-line. (B) Changes in the MSE (mean squared error) of the regression line by the region of interest (ROI) size. The ROI was selected from the cell center or cytoplasm and an averaging or median filter of the indicated ROI size was used in the processing, respectively. (C) Images processed by automatic segmentation of cell B in . From left to right panels, pixels were connected according to their similarity and the image was finally segmented into the four regions of the cytoplasm (R), cell nuclei or nucleus (S), vacuole (T1) and the cell exterior (T2).

Addendum to:
References
- Koo MK, Oh CH, Holme AL, Pervaiz S. Simultaneous analysis of steady-state intracellular pH and cell morphology by automated laser scanning cytometry. Cytometry A 2007; 71:87 - 93
- Lacombe B, Pilot G, Gaymard F, Sentenac H, Thibaud JB. pH control of the plant outwardly-rectifying potassium channel SKOR. FEBS Lett 2000; 466:351 - 354
- Buckler KJ, Vaughan-Jones RD. Application of a new pH-sensitive fluoroprobe (carboxy-SNARF-1) for intracellular pH measurement in small, isolated cells. Pflugers Arch 1990; 417:234 - 239
- Zhang X, Dong FC, Gao JF, Song CP. Hydrogen peroxide-induced changes in intracellular pH of guard cells precede stomatal closure. Cell Res 2001; 1:37 - 43
- Sano T, Kutsuna N, Becker D, Hedrich R, Hasezawa S. Outward-rectifying K+ channel activities regulate cell elongation and cell division of tobacco BY-2 cells. Plant J 2009; 57:55 - 64
- Chen TW, Lin BJ, Brunner E, Schild D. In situ background estimation in quantitative fluorescence imaging. Biophys J 2006; 90:2534 - 2547
- Broder J, Majumder A, Porter E, Srinivasamoorthy G, Keith C, Lauderdale J, Sornborger A. Estimating weak ratiometric signals in imaging data I. Dual-channel data. J Opt Soc Am A 2007; 4:2921 - 2931
- Wang Y-L. Noise-induced systematic errors in ratio imaging: serious artefacts and correction with multiresolution denoising. J Microsc 2007; 228:123 - 131
- Gonzalez RC, Woods RE. Digital Image Processing 2002; 2nd Edition New Jersey Prentice Hall
- Haris K, Efstratiadis SN, Maglaveras N, Katsaggelos AK. Hybrid image segmentation using watersheds and fast region merging. IEEE Trans Image Process 1998; 7:1684 - 1699
- Burger W, Burge M. Digital Image Processing: An Algorithmic Introduction using Java 2007; New York Springer
- Fan J, Yau DKY, Elmagarmid AK, Aref WG. Automatic image segmentation by integrating coloredge extraction and seeded region growing. IEEE Trans Image Process 2001; 10:1454 - 1466