Abstract
UPF1 eliminates aberrant mRNAs harboring premature termination codons, and regulates the steady-state levels of normal physiological mRNAs. Although genome-wide studies of UPF1 targets performed, previous studies did not distinguish indirect UPF1 targets because they could not determine UPF1-dependent altered RNA stabilities. Here, we measured the decay rates of the whole transcriptome in UPF1-depleted HeLa cells using BRIC-seq, an inhibitor-free method for directly measuring RNA stability. We determined the half-lives and expression levels of 9,229 transcripts. An amount of 785 transcripts were stabilized in UPF1-depleted cells. Among these, the expression levels of 76 transcripts were increased, but those of the other 709 transcripts were not altered. RNA immunoprecipitation showed UPF1 bound to the stabilized transcripts, suggesting that UPF1 directly degrades the 709 transcripts. Many UPF1 targets in this study were newly identified. This study clearly demonstrates that direct determination of RNA stability is a powerful approach for identifying targets of RNA degradation factors.
Introduction
Cellular processes rely on accurate expression of genetic information. However, errors are accidentally produced during DNA replication, transcription and translation. To ensure the fidelity of genetic information flow, organisms have evolved surveillance systems to assess the quality of genetic entities. The mRNA surveillance system is an important cellular quality control system that ensures the accuracy of transcripts, to maintain a healthy cellular homeostasis. The mRNA surveillance system includes nonsense-mediated mRNA decay (NMD),Citation1,Citation2 nonstop-mediated mRNA decay (NSD),Citation3-Citation6 and no-go decay (NGD).Citation7 NMD, the best studied mRNA surveillance system, eliminates aberrant mRNAs harboring premature termination codons (PTCs), generated as a result of mutations or biosynthetic errors, to prevent the production of potentially deleterious C-terminally truncated proteins.Citation8-Citation13 The NMD pathway is physiologically and medically important, because an escape from NMD can result in severe clinical phenotypes.Citation14-Citation16 The malfunction of NMD factors results in serious consequences for the development of various organisms.Citation17 Genome-wide analysis using DNA microarrays suggested that NMD regulates 3–20% of transcripts in yeast,Citation18 nematode,Citation19 fruitfly,Citation20 plants,Citation21 and mammals.Citation22-Citation27 Genome-wide RNA half-life analysis also identified the transcripts dysregulated in response to NMD perturbation in mouse.Citation28 Recently, RNA-seq analysis has been used to provide in vivo analysis of the global impact of NMD on splicing patterns in two primary mouse tissues ablated for the NMD factor.Citation29 These studies found that many normal transcripts, in addition to PTC-containing alternatively spliced mRNA isoforms and transcripts from pseudogenes, are regulated by the NMD pathway. Thus, the NMD pathway not only degrades aberrant transcripts, but also regulates the steady-state levels of many normal physiological mRNAs encoding functional full-length proteins.Citation23,Citation30,Citation31 Normal transcripts harboring introns downstream of the termination codon (TC), long 3′ untranslated regions (3′ UTRs), or upstream open reading frames (uORFs) are preferentially targeted by NMD. Moreover, mammalian cells show feedback regulation of NMD, whereby mRNAs coding for NMD factors are themselves targeted by NMD, to tightly control the efficiency of NMD for the maintenance of physiological levels of NMD targets.Citation32,Citation33 This autoregulation (feedback regulation) could quickly establish balanced levels of NMD factors and regulate the levels of a many NMD substrates. Thus, NMD has a dual role in gene regulation (i.e., RNA surveillance and regulation of gene expression), emphasizing its biological importance.
The NMD pathway in human cells comprises the NMD factors UPF1, UPF2, UPF3A, UPF3B, SMG1, SMG5, SMG6, SMG7, SMG8, SMG9, NAG and DHX34.Citation12,Citation13 UPF1 is thought to be essential for all types of NMD.Citation34-Citation38 Thus, UPF1 is functionally the most important NMD factor and is the most evolutionarily conserved.Citation39,Citation40 UPF1 also acts in non-NMD decay pathways, such as staufen1 (STAU1)-mediated mRNA decay (SMD) and replication-dependent histone mRNA decay.Citation41,Citation42 Gene expression profiles of mammalian cells using siRNA-mediated depletion of UPF1 indicated that a significant fraction of cellular transcripts are upregulated, most of which are considered NMD-sensitive transcripts.Citation24,Citation31,Citation36,Citation43 However, NMD-sensitive changes in abundance are not always accompanied by altered decay rates.Citation18,Citation44 These transcripts are referred to as indirect NMD targets. A model accounting for indirect targets was proposed on the basis that mRNAs encoding several transcription factors are sensitive to NMD. Changes in the abundance of these transcription factors might cause changes in the rates of transcription of downstream-regulated genes in NMD-deficient cells, which could indirectly affect their abundance.Citation45 To discriminate direct targets from indirect targets, direct measurement of RNA stability of candidate NMD targets is required. However, there has been no systematic genome-wide measurement of RNA stability to identify direct and indirect targets of NMD. Conventionally, RNA stability is measured by the decrease of transcripts over time after inhibition of global transcription by transcriptional inhibitors, such as actinomycin D. Unfortunately, inhibitor-mediated global transcriptional arrest profoundly disrupts cellular physiology, which interferes with the precise determination of the RNA stabilities in NMD factor-deficient cells.Citation46,Citation47
Here, we studied the role of UPF1 by examining the changes in abundance and decay rates of transcripts that respond to depletion of UPF1, using a recently developed inhibitor-free genome-wide method for measuring RNA stability: 5′-bromo-uridine immunoprecipitation chase – deep sequencing analysis (BRIC-seq).Citation48 BRIC-seq involves pulse-labeling endogenous RNAs with 5′-bromo-uridine (BrU) and measuring the ongoing decrease in RNA levels over time by deep sequencing, without the use of transcriptional inhibitors. In this study, we identified 76 transcripts that are upregulated with altered decay rates (direct UPF1 targets), and hundreds of transcripts that are upregulated without altered decay rates (indirect UPF1 targets). Interestingly, we also found a large number of direct UPF1 targets that have prolonged degradation but are not upregulated by UPF1 depletion, which has not been documented previously.
Results
Validation of BRIC-seq for determining RNA half-lives
Before investigating the role of UPF1 in gene regulation, we validated BRIC-seqCitation48 for determining RNA half-lives in UPF1-depleted cells. Depletion of UPF1 by RNA interference (RNAi) reduced UPF1 mRNA levels in HeLa Tet-off (TO) cells to18% of the control level, using two different siRNAs: UPF1 siRNA-1 and UPF1 siRNA-2 to rule out off-target effects in further experiments (). To determine mRNA stabilities, BrU-labeled RNAs were immunopurified from BrU-labeled RNA containing total RNAs isolated from HeLa TO transfected with either control siRNA or UPF1 siRNA, at four time points after BrU pulse-labeling. Twenty-five million unique RNA-seq tags were then analyzed through massive sequencing analysis. The sequencing tags were mapped to the human reference genome sequence (hg19). 18,808 RNAs from the NM categorized transcripts (mRNAs) of The Reference Sequence (RefSeq) Database were used for mRNA annotation. Genic representations using Reads Per Kilobase of exon model per Million mapped reads (RPKM) were calculated to normalizing gene length and depth of sequencing.Citation49 RNA-seq tags from two independent BRIC-seq experiments showed high reproducibility for transcripts with an RPKM ≥ 2 (Fig. S1 and B). 9,229 mRNAs that reproducibly had an RPKM value ≥ 2 at time 0 h were selected for analysis. The least squares fitting procedure was used to find the curve best-fitting the time points from the results of BRIC-seq was used, and then the degradation rate of each transcript was calculated (). R2 values of the fitting curves show that the most mRNA half-lives were valid (Fig. S1C and D). The half-lives for 9,229 mRNAs were determined in control cells (average half-life: ~8.1 h, median half-life: ~5.4 h) and in UPF1-depleted cells (average half-life: ~5.3 h, median half-life: ~3.6 h) ().
Figure 1. Validation of the UPF1 depletion and BRIC-seq. (A) UPF1 levels were quantified by RT-qPCR after RNA interference (RNAi) of UPF1. Control-1, Control siRNA-1; UPF1–1, UPF1 siRNA-1; Control-2, Control siRNA-2; and, UPF1–2, UPF1 siRNA-2. GAPDH abundance was used for normalization. Values represent mean ± errors from duplicate experiments. (B) BRIC-seq determined the half-lives of 9,229 mRNAs in HeLa Tet-off (TO) cells. White circles (left panel) indicate the fraction of mRNAs in control cells and black circles (right panel) indicate the fraction of mRNAs in UPF1-depleted cells. Transcripts with a half-life over 24 h are included in the category of 24 h. (C) Expression levels of GADD45A in control cells (gray bar) and in UPF1-depleted cells (black bar) were determined by RT-qPCR. GAPDH abundance was used for normalization. Values represent mean ± errors from duplicate experiments. (D) Decay rates in control cells (open circle and gray line) and in UPF1-depleted cells (solid circle and black line) were determined by RT-qPCR. (E) Autoregulation (feedback regulation) of NMD factors. mRNA levels upon UPF1 knockdown, determined by RNA-seq. GAPDH abundance was used for normalization. Transcripts encoding UPF2, SMG1, SMG5, SMG6, SMG7, and SMG9 are significantly upregulated in UPF1-depleted cells. Grey and black bars indicate cells transfected with UPF1 siRNA-1 and UPF1 siRNA-2, respectively.
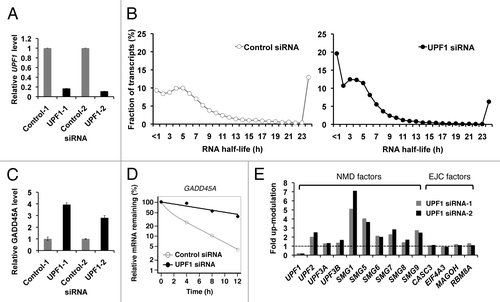
Validation of UPF1 depletion for effective NMD inhibition
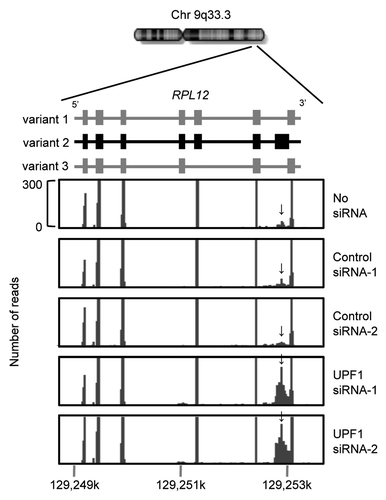
To validate UPF1 depletion for effective NMD inhibition, we examined the steady-state abundances and decay rates of known UPF1 targets. The NMD-sensitive transcript, GADD45A,Citation22,Citation44 was upregulated by more than 3-fold with prolonged decay rates in response to UPF1 depletion (). The abundances of transcripts encoding six NMD factors (UPF2, SMG1, SMG5, SMG6, SMG7, and SMG9) were significantly upregulated in response to UPF1 depletion, while those of transcripts encoding the core exon-junction complex (EJC) factors, CASC3, EIF4A3, MAGOH, and RBM8A, were unchanged (). These results correlate with previous observations, referred to as feedback regulationCitation32 or autoregulation.Citation33 Finally, RNA-seq tags were piled up on the last exon of the RPL12 transcript variant 2, a known NMD target,Citation50 in response to UPF1 knockdown, indicating that the splicing variant recognized by NMD had escaped from degradation in response to UPF1 depletion (). Changes to the alternative splicing patterns of SRSF2, SNRPB, TRA2A, and SMNDC1, which have NMD-sensitive splice variants, were observed (Fig. S2), which is consistent with previous reports.Citation36,Citation50,Citation51 These results demonstrate that UPF1 depletion reproduces previously reported phenomenon.
Figure 2. Typical changes in the relative abundances of alternatively splice variants of RPL12. A chromosome diagram is shown in the upper position. Three splice variants transcribed from RPL12 gene are shown in the middle. Variant 2 (middle) is a known NMD target. Mapping data of RNA-seq tags using a Genome Analyzer (Illumina) is shown at the bottom. Block-like shadows indicate piling of RNA-seq tags. Arrows indicate the exon, contained only in splice variant 2, with increased RNA-seq tag piling in response to UPF1 depletion.
We further examined alteration in UPF1-mediated gene regulation. The regulated degradation of histone mRNAs requires UPF1.Citation42 Regulation of histone synthesis mostly occurs post-transcriptionally by regulating the concentrations of histone mRNA. As cells enter S phase, histone mRNA levels increase, and at the end of S phase they are rapidly degraded. As expected, the replication-dependent histone H2A mRNAs were stabilized in UPF1-deficient cells, without increased mRNA levels (Table S1). Thus, UPF1 depletion effectively inhibits the NMD pathway as well as the UPF1-mediated RNA degradation pathway of physiological transcripts. More importantly, BRIC-seq could detect previously reported altered degradation of UPF1 target transcripts in response to UPF1 depletion, even if the transcript level did not increase in response to RNA stabilization.
Direct measurement of RNA stability reveals hidden UPF1 targets
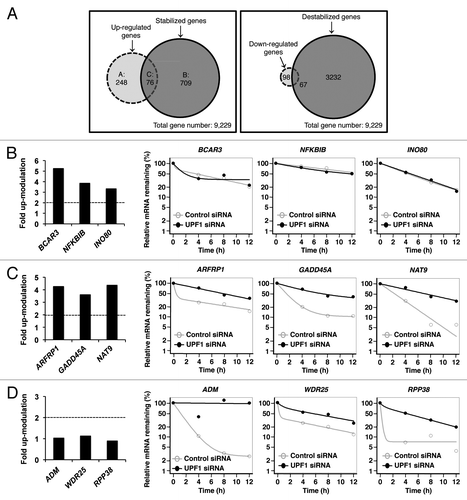
To investigate the genome-wide effect of UPF1 on gene expression, steady-state abundances and decay rates of 9,229 mRNAs were determined by RNA-seq and BRIC-seq, respectively, in UPF1-depleted cells compared with control cells. 324 upregulated transcripts and 785 stabilized transcripts were identified in UPF1 knockdown cells. Transcripts with altered expression (324 upregulated and 165 downregulated transcripts) and transcripts with altered levels of stabilization (785 stabilized and 3,299 destabilized transcripts) were identified in UPF1 knockdown cells (; Tables S2–7). To identify the transcripts degraded by UPF1 in this study, the destabilized transcripts in UPF1 knockdown cells were not subjected to further analysis, although a particular population of transcripts became unstable in UPF1-depleted cells. In upregulated or stabilized mRNAs, the relative expression level was then compared with the relative half-life, which categorized those transcripts to three groups (Group A, B, and C) (; Tables S2–4). Group A (248 transcripts) represents mRNAs that were 2-fold upregulated in response to UPF1 depletion but with unaltered decay rates (). Group C (76 transcripts) represents upregulated RNAs that were stabilized in UPF1 knockdown cells; these alterations correspond to bona fide UPF1 targets (). Group B (709 transcripts) represents stabilized mRNAs whose expression levels were unaltered in UPF1 deficient cells, () which had not been documented previously. The UPF1 depletion-mediated altered expression levels and stabilities measured by RNA-seq and BRIC-seq were confirmed by RT-qPCR analysis (Fig. S3A–C). Similar results were obtained using siRNA set 2 (Fig. S3D), ruling out the possibility of off-target effects. Importantly, several previously identified NMD targetsCitation22,Citation44 as well as SMD targetsCitation52 were found in groups C and B (Table S8). This observation validates our approach for identifying UPF1 targets.
Figure 3. Steady-state abundance and decay rates of 9,229 transcripts. Transcripts were identified by expression profiling of UPF1-depleted cells by RNA-seq and by RNA stability in UPF1-depleted cells by BRIC-seq. (A) (Left) Venn diagram of overlap between mRNAs that are over 2-fold upregulated in response to UPF1 depletion (left dashed circle) and mRNAs that are over 2-fold stabilized in UPF1 knockdown (right circle). The overlap between the circles was categorized as Group C (76 transcripts), indicating upregulated, stabilized mRNAs in UPF1-depleted cells. Group A (248 transcripts) represents the over 2-fold upregulated, non-stabilized mRNAs in UPF1-depleted cells. Group B (709 transcripts) represents over 2-fold stabilized, not upregulated mRNAs in UPF1 knockdown cells. (Right) Venn diagram of the overlap between mRNAs that are over 2-fold downregulated in response to UPF1 depletion (left dashed circle) and mRNAs that are over 2-fold destabilized in UPF1 knockdown (right circle). The overlap between the circles (67 transcripts) indicates downregulated and destabilized mRNAs in UPF1-depleted cells. The left circle (98 transcripts) represents the over 2-fold downregulated, non-destabilized mRNAs in UPF1-depleted cells. The right circle (3,232 transcripts) represents over 2-fold destabilized, not downregulated mRNAs in UPF1 knockdown cells. (B−D) Representative mRNAs of Group A (panel B), Group C (panel C), and Group B (panel D). The expression levels of each mRNA in UPF1-depleted cells compared with control cells are shown as bar graphs in each panel. The dashed lines indicate 2-fold upregulation in response to UPF1 depletion. The degradation curves of each transcript in control cells (open circle and gray bar) and in UPF1-depleted cells (solid circle and black bar) are shown as scatter plots.
To determine whether the transcripts those expressions and/or stabilities are altered by UPF1 depletion in an NMD-independent, non-post-transcriptional fashion, we quantified pre-mRNA () and mature RNA () levels in four transcripts from the two groups. For the group A mRNAs, BCAR3 and NLRP1, the abundances of the both the pre-mRNA and the mRNA were upregulated by more than 2-fold in UPF1 deficient cells. This result strongly suggests that Group A mRNAs are upregulated transcriptionally, representing indirect targets of UPF1. On the other hand, the abundances of the pre-mRNAs of GADD45A and NAT9 (Group C) remained unchanged while the abundances of the mRNAs were upregulated by more than 3-fold, suggesting that Group C mRNAs are post-transcriptionally upregulated, representing direct targets of UPF1. Similar results were obtained using siRNA set 2 (Fig. S4A), ruling out off-target effects.
Figure 4. Determination of direct or indirect UPF1 targets. (A and B) Alteration of pre-mRNA (A) and mature RNA (B) expression levels in UPF1 deficient cells distinguishes direct UPF1 target mRNAs from indirect target mRNAs. Fold upregulations of RNAs in the UPF1-depleted cells relative to control cells are shown. The RNA levels were determined by RT-qPCR. GAPDH abundance was used for normalization. Values represent mean ± errors from duplicate experiments. The dashed line indicates 2-fold upregulation of transcripts in response to UPF1 depletion. (C and D) Examination of RNA binding to UPF1. RNA immunoprecipitation (RIP) of Group A, B (in C), and C (in D) RNAs with Myc-tagged UPF1 proteins was performed. Fold enrichment of indicated mRNAs in the Myc-UPF1 immunoprecipitate fraction relative to the negative control (normal IgG IP fraction) is shown. RT-qPCR determined the relative mRNA levels, which were normalized to input levels of mRNA and GAPDH mRNA levels. Values represent mean ± SD from triplicate experiments. The dashed line indicates 2-fold enrichment in the Myc-UPF1 immunoprecipitate. *, p < 0.05 (Student’s t-test) compared with the enrichment of GAPDH mRNA in UPF1 immunoprecipitates.
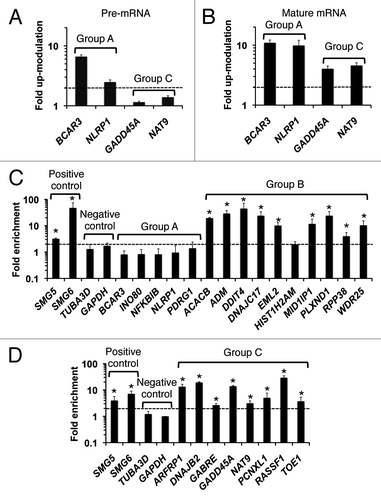
To further examine whether Group B mRNAs are direct UPF1 substrates, RNA immunoprecipitation (RIP) was performed. For this analysis, HeLa TO cells were transfected with vector expressing Myc-tagged UPF1 protein (Myc-UPF1). RNAs associated with Myc-UPF1 were immunoprecipitated from cell lysates using an anti-Myc antibody (Fig. S4B), and the relative abundances of the mRNAs in these precipitates were determined. Compared with the normal IgG IP fraction, nine out of 10 Group B mRNAs, all examined Group C mRNAs, and the known NMD substrates, SMG5 and SMG6,Citation33 were substantially enriched (by more than 3-fold) in the UPF1 IP fraction (). Five group A mRNAs and the negative control mRNAs, TUBA3D and GAPDH, were not enriched in the UPF1 IP fraction (; Fig. S5). These results confirm that most Group B mRNAs, which have altered decay rates but unchanged expression levels in UPF1 deficient cells, are direct UPF1 substrates. Most of these mRNAs represent previously undiscovered UPF1 targets.
Bioinformatic characterization of UPF1 targets
UPF1 targets, were subjected to bioinformatic analyses. Gene Ontology (GO) analysis for identifying functional categories of UPF1 target transcripts revealed that the GO categories associated with regulation of transcription and translation were significantly represented in the Group B mRNAs, with P-values of 7.0E-07 and 4.3E-06, respectively. Using the OMIM Database and KEGG PATHWAY Database, genes associated with diseases and signaling pathways were identified among the Group C and B genes (Table S9). These data suggest that Group C as well as Group B contains genes associated with regulatory functions.
The 3′ UTR lengths of UPF1 targets were analyzed (Fig. S6A). The 3′ UTRs of the Group A mRNAs were significantly longer than that of all transcripts. In contrast, the 3′ UTRs of Groups B and C mRNAs were significantly shorter than that of all transcripts. This result indicated that the 3′ UTR length of direct UPF1 targets (Groups B and C) are relatively short. This agrees with the work of Singh et al., who reported that a large subset of human mRNAs contain long 3′ UTRs but evade NMD.Citation33 The relationship between the lengths of the 5′ UTR, ORF, and 3′ UTR of mRNAs and the relative RNA half-life in response to UPF1 depletion were then determined (Fig. S6B). Significant differences between the relative RNA half-lives and the lengths of the 5′ UTR, ORF and 3′ UTR were not found.
Discussion
In this study, we measured the genome-wide steady-state abundances and decay rates of mRNAs in UPF1-depleted HeLa TO cells relative to control cells, using RNA-seq and BRIC-seq. We determined the expression levels and half-lives of 9,229 transcripts. The mRNAs were classified into three groups: Group C, direct UPF1 targets with > 2-fold upregulation with > 2-fold prolonged decay rates; Group A, indirect targets with > 2-fold upregulation but unaltered decay rates; and Group B, direct targets with unchanged expression levels with > 2-fold prolonged decay rates. We consider that Group C mRNAs are bona fide UPF1 targets, consistent with previous reports.Citation22,Citation33,Citation44 The inclusion of previously identified UPF1 targets in Group C strongly supports this interpretation. Simultaneous analyses of pre-mRNA and mRNA abundances of selected transcripts strongly suggested that upregulation of Group A mRNAs in UPF1 knockdown cells results from transcriptional upregulation, not RNA stabilization. The observation that UPF1 depletion caused transcriptional activation of certain genes supports this hypothesis.Citation44 This apparent transcriptional effect of UPF1 depletion may be caused by altered expression of transcription factors whose expressions are regulated by UPF1.Citation42,Citation54 This would affect the pre-mRNA abundance of certain genes, as is the case for Group A transcripts (). Indeed, several transcription factors, e.g., ATF3 and ATF4, which were identified as UPF1 targets,Citation22 were increased in UPF1 depleted cells (Fig. S6C). Alternatively, UPF1 may directly affect the transcription of the upregulated genes. RNA immunoprecipitation of selected transcripts () revealed that Group B mRNAs and Group C mRNAs are associated with UPF1, strongly suggesting that the UPF1-mediated degradation pathway degrades these mRNAs in vivo. For Group B mRNAs, compensatory mechanisms might restore RNA levels by counteracting UPF1-mediated changes in RNA half-life, similar to replication-dependent histone H2A mRNAs.Citation42 Based on this hypothesis, we identified potentially enriched transcription factor binding sites (TFBSs) in the promoters of Group B genes (direct UPF1 targets) using the TRANSFAC® database.Citation55 Binding sites of HIC1 transcriptional repressor appear to be specifically enriched in promoters of Group B genes. Correspondingly, HIC1 mRNA was increased in UPF1 knockdown cells (Fig. S6C). HIC1 with C-terminal five Krüppel-like and a C2H2 zinc finger N-terminal BTB/POZ domain directly binds and represses targets genes by interacting with corepressors such as CtBP and MTA1.Citation56,Citation57 HIC1 also recruits polycomb repressive complex 2 (PRC2) to a subset of its target genes, subsequently repressing their transcription.Citation58 We propose that HIC1 represses the transcription of a subset of Group B genes, which neutralizes the effect of the increase in Group B transcripts. This study demonstrated that direct determination of RNA stability without transcriptional inhibitors could reveal hundreds of undiscovered transcripts regulated by UPF1, even in the presence of a cellular feedback system that neutralizes gene expression levels.
Bioinformatic analysis revealed that the identified direct UPF1 targets represent diverse biological pathways. We identified several disease-associated genes, such as diabetes, neoplasms, hypertension, cleft palates, and Alzheimer disease, as novel UPF1 targets (; Table S9). Moreover, mTOR, MAPK, and p53 signaling pathways, which regulate cell growth, cell proliferation, cell motility, and cell survival, involve novel UPF1 targets. These results strongly suggest that UPF1 regulates these disease-associated genes, making UPF1 a potential novel target for drugs to treat lifestyle-related illnesses, cancers, and nervous disorders.
Table 1. Representative genes associated with diseases and signaling pathways among UPF1 targets in groups B and C
The EJC plays a central role in distinguishing aberrant PTC-containing mRNA from normal mRNA in mammalian cells.Citation9,Citation13,Citation38,Citation59 Through a splicing reaction, EJCs are deposited 20–24 nucleotides upstream of exon-exon junctions. Although EJCs that are located within a ORF are removed by elongating ribosomes during initial translation (termed the pioneer round of translation), EJCs located downstream of the termination codon remain associated with the ribonucleoprotein (RNP).Citation60 This remaining EJC downstream of translation termination promotes recruitment and activation of UPF1, which consequently initiates the formation of the so-called NMD-inducing complex. This NMD-inducing complex promotes accelerated degradation of targeted mRNAs.Citation61,Citation62 In addition, recent studies put forward a general and evolutionarily conserved mechanism in which the distance between the termination codon and the poly(A) tail is a determinant of NMD-mediated RNA degradation: the ‘unified 3′ model’.Citation35,Citation53,Citation63,Citation64 This model proposes that the key trigger for NMD is an inefficient termination event caused by the failure of PABP to interact with the terminating ribosome. This model can explain the previous observation in which EJC-independent degradation is performed in nonsense mRNA having a long 3′ UTR. Inspired by this recent progress, we examined the relationship between UPF1-mediated mRNA stabilization and UTR length. We found that the mRNAs having long 3′ UTRs were not enriched in direct UPF1 targets (Groups B and C) (Fig. S6A and B). This finding is not consistent with the ‘unified 3′ model’. Presumably, the 3′ UTR length of most UPF1-targeted mRNAs is sufficient to elicit NMD. Alternatively, most of the mRNAs in the “direct NMD target subsets” are degraded by a non-NMD pathway, such as SMD. It is also possible that certain process coupling the long 3′ UTR-mediated post-transcriptional regulation determine the stability of group A mRNAs; therefore, we could not detect the significant difference between 3′ UTR length of Group A transcripts and that of Group B transcripts. The important point is that UPF1-mediated RNA degradation is very complicated; therefore, further studies, including the identification of bona fide target transcripts, is required.
The method for determining genome-wide steady-state RNA expression levels and RNA decay rates is a powerful approach for identifying bona fide targets regulated by RNA decay factors, including, but not limited to, NMD factors. We believe that this genome-wide analysis will provide a wealth of new information on quality control, checkpoint, and proofreading mechanisms that ensure the fidelity of the genetic information flow.
Materials and Methods
Cell culture
HeLa TO cells (Clontech) were grown in Dulbecco’s modified Eagle’s medium (DMEM), supplemented with 10% fetal bovine serum (FBS) and antibiotics at 37°C in a humidified incubator with 5% CO2.
siRNA treatments
The sequences of the siRNAs are listed in Table S10. SiRNAs were transfected into cells using Lipofectamine RNAiMAX (Invitrogen), according to the manufacturer’s instructions. Briefly, siRNA duplexes (final concentration 10 nM) and cells were harvested 72 h after transfection. RT-qPCR was used to determine whether RNA interference achieved significant depletion of each target sequence.
Reverse transcription: quantitative real-time polymerase chain reaction (RT-qPCR)
The isolated RNA was reverse transcribed into cDNA using the PrimeScript RT Master Mix (Perfect Real Time) (TaKaRa). The cDNA was amplified using primer sets listed in Table S10. GAPDH was used for normalization. SYBR Premix Ex TaqII (Perfect Real Time) (TaKaRa) was used according to the manufacturer’s instructions. Quantitative real-time reverse transcription PCR analysis was performed using a Thermal Cycler Dice Real Time System (TaKaRa).
BRIC
BRIC was performed as previously described.Citation48 In brief, cells were incubated at 37°C in the presence of 150 μM 5′-bromo-uridine (BrU) (Wako) for 24 h in a humidified incubator with 5% CO2. At indicated time points after replacing BrU-containing medium with BrU-free medium, cells were harvested. Total RNA was isolated using RNAiso Plus (TaKaRa). Twelve micrograms of BrU-labeled total RNA was denatured by heating at 80°C for 1 min and then added to the anti-BrdU mAb-conjugated beads containing 2 μg of anti-BrdU mAb (clone 2B1, MBL). The mixture was incubated at room temperature for 1 h with rotation. Beads were washed three times with 0.1% BSA in PBS. ISOGEN LS (Nippon Gene) was added, followed by RNA isolation in accordance with the manufacturer’s instructions. The isolated RNA was used for RT-qPCR or deep sequencing.
Databases
We used mRNA sequences available from public databases: 18,808 RNAs from NM categorized human transcripts (hg19) of The Reference Sequence (RefSeq) Database were obtained from the University of California, Santa Cruz (UCSC) genome browser database,Citation65,Citation66 and 9,229 of these RNAs passed the cutoff of RPKM ≥ 2. We also examined the 5′ UTR, CDS and 3′ UTR lengths for 9,229 RNAs using the data set of Refseq human transcripts (NM) (hg19) obtained from UCSC genome browser Database. NMD and SMD targets revealed by previous reports were retrieved from the data set of transcripts more than 1.9-fold upregulated in UPF1-depleted HeLa cells,Citation22 the data set of transcripts more than 2.0-fold upregulated in UPF1-depleted HeLa cellsCitation44 and the data set of transcripts more than 2.0-fold upregulated in STAU1-depleted HeLa cells.Citation52 Genes associated with diseases and reaction networks of the 9,229 RNAs were retrieved from Online Mendelian Inheritance in Man (OMIM), Genetic Association Database (GAD) and Kyoto Encyclopedia of Genes and Genomes PATHWAY Database (KEGG PATHWAY Database) using a Functional Annotation Chart in DAVID Bioinformatics Resources 6.7.Citation67
Deep sequencing and data analysis
Using ~1 μg of RNA, an RNA Seq library was constructed using the mRNA Seq Sample Preparation Kit (Illumina), according to the manufacturer’s instructions. Thirty-six base-pair single-end-read RNA-Seq tags were generated using an Illumina GA sequencer, according to the standard protocol. The fluorescent images were processed to sequences using the analysis Pipeline supplied by Illumina. RNA-Seq tags were mapped to the human reference genome sequence (hg19) using Eland as a mapping software and allowing no mismatch settings. Splitting RNA-seq tags representing Exon-Exon junctions were rescued according to Ref-seq extracted from the UCSC genome browser. We calculated genic representations using Reads Per Kilobase of exon model per Million mapped reads (RPKM) as a means of normalizing for gene length and depth of sequencing.Citation49 RNA-Seq tags were assigned to corresponding RefSeq transcripts or to mRNAs when their genomic coordinates overlapped. The origin and the orientation of the RNAs were documented genome-wide by mapping the reads to the reference human genome. In this study, we employed criteria such that data over 2 RPKMs were used to determine the half-lives of transcripts.
Calculation of mRNA half-lives
The decay rates (half-lives) of transcripts were estimated by a custom R script. Two theoretical models describing the kinetics of mRNA decay were developed and evaluated for accurate calculation of RNA decay. A biphasic decay curve for NMD substrates has been described previouslyCitation44 and can potentially be attributed to degradation of the nonsense-mutated mRNA during the first round of translation. Those mRNAs that escape degradation at that point are thought to be unaffected thereafter by NMD.Citation68 Model 1 represents a first-order exponential decay: Y(t) = X(t) / X(0) = exp(-at), where t is time (hr) after BrU-labeling, X(t) is RNA abundance at t time points, X(0) is RNA abundance at the start point (0hr) just after BrU-labeling, Y(t) is the relative RNA abundance at t hr compared with that at 0 h and a is the degradation rate: a = log2 / T1/2. We used the least squares fitting procedure to find the best-fitting curve for the time points from the result of BRIC-seq and then calculated the degradation rate a for each RNA. The half-lives (T1/2) were calculated by the following equation: T1/2 = log2 / a. We also calculated the correlation coefficient (R2) between time points from the result of BRIC-seq and the points from the curve. Model 2 represents a differential decay of two RNA sub-populations: Y(t) = cexp(-at) + (1-c)exp(-bt) where a and b are the degradation rates of each RNA sub-population and c is an asymptotic value. The degradation rates a and b, and the asymptotic value c are calculated by the same least squares fitting procedure for each RNA. We calculated the half-life (T1/2) using the following equation: Z(t) = [(cexp(-at) + (1-c)exp(-bt)) – 0.5],Citation2 where Z(t) represents the squared value. When Z(t) is the minimum value, the half-life (T1/2) nearly equal to t (hr). We also calculated the correlation coefficient (R2) as above. To compare the performances of the models, we used Akaike Information Criteria (AIC): AIC = 2k – nln(L), where k is the number of parameters in the decay model, n is the number of time points and L is residual sum of squares: SS(t) = Σ(D(t) -Y(t))Citation2 / n, where D(t) is the relative RNA abundance of each time points from the result of BRIC-seq and Y(t) is the relative RNA abundance from the curve. 2k represents the complexity of the decay model and nln(L) represents the goodness of fitting of the decay model. We chose the decay model with the minimum AIC value. The rates of model 1 and 2 were 56% and 44% in control cells, respectively. GAPDH was used to normalize each transcript in this work. We also selected four ultrastable transcripts (GAPDH, PGK1, GRN, and TRAP1) and normalized each transcript by the geometric mean of the RPKMs of the four transcripts. The calculated RNA stabilities normalized by GAPDH were almost the same as those normalized by the geometric mean of the four ultrastable transcripts, indicating that scaling to a single transcript (GAPDH) over the time course did not cause accidental errors.
RNA immunoprecipitation
Myc-tagged UPF1 or an empty pSR plasmid (negative control)Citation69,Citation70 (kindly donated by Dr. A. Yamashita, Yokohama City University School of Medicine) were transfected into cells using Lipofectamine 2000 (Invitrogen), according to the manufacturer’s instructions. The next day, the cells were trypsinized and washed in cold PBS. The cell pellet was resuspended in RIPA buffer [50 mM TRIS-HCl (pH 8), 150 mM NaCl, 1mM EDTA, 0.1% SDS, 1% Triton X-100, 0.1% DOC, 0.5 U/μL RNasin plus RNase inhibitor (Promega) and protease inhibitor cocktail (Sigma)], and then sonicated by a Bioruptor UCD-250 (Cosmo Bio). The supernatants were obtained by centrifugation, and used for immunoprecipitation using an anti-Myc-tag mAb (MBL) or normal mouse IgG (MBL). Antibodies were incubated with Dynabeads protein G (Invitrogen) for 1 h at 4°C, followed by washing three times in RIPA buffer. The supernatants were mixed with antibody-bead conjugates and rotated for 2 h at 4°C. Beads were washed three times in cold RIPA buffer. ISOGEN LS (Nippon Gene) was then added, followed by RNA isolation according to the manufacturer’s instructions. The levels of transcripts of interest were determined by RT-qPCR.
Bioinformatic analysis
\The statistical significance of the difference in the lengths of 3′ UTR between different gene groups was evaluated by Wilcoxon’s signed rank tests performed with a custom R script. Gene ontology analysis was performed using a Functional Annotation Chart in DAVID Bioinformatics Resources 6.7 (http://david.abcc.ncifcrf.gov/home.jsp). The TRANSFAC® database (Release 2012.1) was used to identify transcription factor binding sites (TFBSs) enriched in promoters of Group B genes (see ). Transcription start sites (TSSs) of 9,229 genes were determined using the annotation provided by the UCSC genome browser, and the surrounding regions (-250 to +50 and -500 to +100, where TSS is +1) were defined as promoters. MATCHTM, a tool for searching TFBSs with the matrix library collected in TRANSFAC(R) database, was then applied to the promoters, and enrichment of TFBSs was surveyed. In the MATCH(TM) search, we used the vertebrate matrix library and adopted minFP and minSUM cut-offs. The Z-scoreCitation71 of each TFBS was calculated to evaluate the statistical significance of the enrichment in Group B promoters.
Western blotting
The samples were electrophoresed on a 10% SDS-PAGE gel. Proteins were transferred to Immobilon-P transfer membrane (Millipore) and probed with 1:2000 diluted anti-Myc-tag pAb (MBL). One-to-5000 diluted anti-mouse IgG, HRP-linked (GE healthcare) was used as the secondary antibody. The bands were visualized by scanning the membrane on an ImageQuant LAS 4000 (Fuji Film).
Data access
The short-read sequence archive data that appear in this paper are registered in GenBank (http://www.ncbi.nlm.nih.gov/genbank) / DDBJ (http://ddbj.sakura.ne.jp). The data of two independent BRIC-seq experiments at four time points and the data for determining the expression levels of transcripts are registered as follows: accession nos. DRA000591, DRP000622, DRS001594−DRS001618, DRX001669−DRX001693, and DRR002251−DRR002275.
Additional material
Download Zip (1.2 MB)Disclosure of Potential Conflicts of Interest
No potential conflicts of interest were disclosed.
Acknowledgments
We thank Dr. Akio Yamashita (Yokohama City University) for providing the UPF1 expression vector. We thank MBL Co., Ltd for donating the anti-BrdU antibody. This work financially supported by the Takeda Science Foundation, the Naito Foundation, Grants-in-Aid for Scientific Research, Research Fellowship of the Japan Society for the Promotion of Science, the Funding Program for World-Leading Innovative R&D on Science and Technology of the Japan Society for the Promotion of Science, and Grant-in-Aid for Scientific Research on Innovative Areas 'Functional machinery for non-coding RNAs' and 'Genome Science' from the Ministry of Education, Culture, Sports, Science and Technology of Japan.
Supplemental Materials
Supplemental materials may be found here: https://www.landesbioscience.com/journals/rnabiology/article/22360/
Related Research Data
References
- Losson R, Lacroute F. Interference of nonsense mutations with eukaryotic messenger RNA stability. Proc Natl Acad Sci U S A 1979; 76:5134 - 7; http://dx.doi.org/10.1073/pnas.76.10.5134; PMID: 388431
- Maquat LE, Kinniburgh AJ, Rachmilewitz EA, Ross J. Unstable beta-globin mRNA in mRNA-deficient beta o thalassemia. Cell 1981; 27:543 - 53; http://dx.doi.org/10.1016/0092-8674(81)90396-2; PMID: 6101206
- Frischmeyer PA, van Hoof A, O’Donnell K, Guerrerio AL, Parker R, Dietz HC. An mRNA surveillance mechanism that eliminates transcripts lacking termination codons. Science 2002; 295:2258 - 61; http://dx.doi.org/10.1126/science.1067338; PMID: 11910109
- van Hoof A, Frischmeyer PA, Dietz HC, Parker R. Exosome-mediated recognition and degradation of mRNAs lacking a termination codon. Science 2002; 295:2262 - 4; http://dx.doi.org/10.1126/science.1067272; PMID: 11910110
- Inada T, Aiba H. Translation of aberrant mRNAs lacking a termination codon or with a shortened 3′-UTR is repressed after initiation in yeast. EMBO J 2005; 24:1584 - 95; http://dx.doi.org/10.1038/sj.emboj.7600636; PMID: 15933721
- Akimitsu N, Tanaka J, Pelletier J. Translation of nonSTOP mRNA is repressed post-initiation in mammalian cells. EMBO J 2007; 26:2327 - 38; http://dx.doi.org/10.1038/sj.emboj.7601679; PMID: 17446866
- Doma MK, Parker R. Endonucleolytic cleavage of eukaryotic mRNAs with stalls in translation elongation. Nature 2006; 440:561 - 4; http://dx.doi.org/10.1038/nature04530; PMID: 16554824
- Yamashita A, Kashima I, Ohno S. The role of SMG-1 in nonsense-mediated mRNA decay. Biochim Biophys Acta 2005; 1754:305−315.
- Chang YF, Imam JS, Wilkinson MF. The nonsense-mediated decay RNA surveillance pathway. Annu Rev Biochem 2007; 76:51 - 74; http://dx.doi.org/10.1146/annurev.biochem.76.050106.093909; PMID: 17352659
- Shyu AB, Wilkinson MF, van Hoof A. Messenger RNA regulation: to translate or to degrade. EMBO J 2008; 27:471 - 81; http://dx.doi.org/10.1038/sj.emboj.7601977; PMID: 18256698
- Akimitsu N. Messenger RNA surveillance systems monitoring proper translation termination. J Biochem 2008; 143:1 - 8; http://dx.doi.org/10.1093/jb/mvm204; PMID: 17981821
- Rebbapragada I, Lykke-Andersen J. Execution of nonsense-mediated mRNA decay: what defines a substrate?. Curr Opin Cell Biol 2009; 21:394 - 402; http://dx.doi.org/10.1016/j.ceb.2009.02.007; PMID: 19359157
- Nicholson P, Yepiskoposyan H, Metze S, Zamudio Orozco R, Kleinschmidt N, Mühlemann O. Nonsense-mediated mRNA decay in human cells: mechanistic insights, functions beyond quality control and the double-life of NMD factors. Cell Mol Life Sci 2010; 67:677 - 700; http://dx.doi.org/10.1007/s00018-009-0177-1; PMID: 19859661
- Frischmeyer PA, Dietz HC. Nonsense-mediated mRNA decay in health and disease. Hum Mol Genet 1999; 8:1893 - 900; http://dx.doi.org/10.1093/hmg/8.10.1893; PMID: 10469842
- Khajavi M, Inoue K, Lupski JR. Nonsense-mediated mRNA decay modulates clinical outcome of genetic disease. Eur J Hum Genet 2006; 14:1074 - 81; http://dx.doi.org/10.1038/sj.ejhg.5201649; PMID: 16757948
- Bhuvanagiri M, Schlitter AM, Hentze MW, Kulozik AE. NMD: RNA biology meets human genetic medicine. Biochem J 2010; 430:365 - 77; http://dx.doi.org/10.1042/BJ20100699; PMID: 20795950
- Hwang J, Maquat LE. Nonsense-mediated mRNA decay (NMD) in animal embryogenesis: to die or not to die, that is the question. Curr Opin Genet Dev 2011; 21:422 - 30; http://dx.doi.org/10.1016/j.gde.2011.03.008; PMID: 21550797
- Guan Q, Zheng W, Tang S, Liu X, Zinkel RA, Tsui KW, et al. Impact of nonsense-mediated mRNA decay on the global expression profile of budding yeast. PLoS Genet 2006; 2:e203; http://dx.doi.org/10.1371/journal.pgen.0020203; PMID: 17166056
- Ramani AK, Nelson AC, Kapranov P, Bell I, Gingeras TR, Fraser AG. High resolution transcriptome maps for wild-type and nonsense-mediated decay-defective Caenorhabditis elegans. Genome Biol 2009; 10:R101; http://dx.doi.org/10.1186/gb-2009-10-9-r101; PMID: 19778439
- Rehwinkel J, Letunic I, Raes J, Bork P, Izaurralde E. Nonsense-mediated mRNA decay factors act in concert to regulate common mRNA targets. RNA 2005; 11:1530 - 44; http://dx.doi.org/10.1261/rna.2160905; PMID: 16199763
- Kurihara Y, Matsui A, Hanada K, Kawashima M, Ishida J, Morosawa T, et al. Genome-wide suppression of aberrant mRNA-like noncoding RNAs by NMD in Arabidopsis. Proc Natl Acad Sci U S A 2009; 106:2453 - 8; http://dx.doi.org/10.1073/pnas.0808902106; PMID: 19181858
- Mendell JT, Sharifi NA, Meyers JL, Martinez-Murillo F, Dietz HC. Nonsense surveillance regulates expression of diverse classes of mammalian transcripts and mutes genomic noise. Nat Genet 2004; 36:1073 - 8; http://dx.doi.org/10.1038/ng1429; PMID: 15448691
- Maquat LE, Gong C. Gene expression networks: competing mRNA decay pathways in mammalian cells. Biochem Soc Trans 2009; 37:1287 - 92; http://dx.doi.org/10.1042/BST0371287; PMID: 19909264
- Pan Q, Saltzman AL, Kim YK, Misquitta C, Shai O, Maquat LE, et al. Quantitative microarray profiling provides evidence against widespread coupling of alternative splicing with nonsense-mediated mRNA decay to control gene expression. Genes Dev 2006; 20:153 - 8; http://dx.doi.org/10.1101/gad.1382806; PMID: 16418482
- Noensie EN, Dietz HC. A strategy for disease gene identification through nonsense-mediated mRNA decay inhibition. Nat Biotechnol 2001; 19:434 - 9; http://dx.doi.org/10.1038/88099; PMID: 11329012
- Chan WK, Bhalla AD, Le Hir H, Nguyen LS, Huang L, Gécz J, et al. A UPF3-mediated regulatory switch that maintains RNA surveillance. Nat Struct Mol Biol 2009; 16:747 - 53; http://dx.doi.org/10.1038/nsmb.1612; PMID: 19503078
- Bruno IG, Karam R, Huang L, Bhardwaj A, Lou CH, Shum EY, et al. Identification of a microRNA that activates gene expression by repressing nonsense-mediated RNA decay. Mol Cell 2011; 42:500 - 10; http://dx.doi.org/10.1016/j.molcel.2011.04.018; PMID: 21596314
- Wang D, Zavadil J, Martin L, Parisi F, Friedman E, Levy D, et al. Inhibition of nonsense-mediated RNA decay by the tumor microenvironment promotes tumorigenesis. Mol Cell Biol 2011; 31:3670 - 80; http://dx.doi.org/10.1128/MCB.05704-11; PMID: 21730287
- Weischenfeldt J, Waage J, Tian G, Zhao J, Damgaard I, Jakobsen JS, et al. Mammalian tissues defective in nonsense-mediated mRNA decay display highly aberrant splicing patterns. Genome Biol 2012; 13:R35; http://dx.doi.org/10.1186/gb-2012-13-5-r35; PMID: 22624609
- Isken O, Maquat LE. The multiple lives of NMD factors: balancing roles in gene and genome regulation. Nat Rev Genet 2008; 9:699 - 712; http://dx.doi.org/10.1038/nrg2402; PMID: 18679436
- Neu-Yilik G, Kulozik AE. NMD: multitasking between mRNA surveillance and modulation of gene expression. Adv Genet 2008; 62:185 - 243; PMID: 19010255
- Huang L, Lou CH, Chan W, Shum EY, Shao A, Stone E, et al. RNA homeostasis governed by cell type-specific and branched feedback loops acting on NMD. Mol Cell 2011; 43:950 - 61; http://dx.doi.org/10.1016/j.molcel.2011.06.031; PMID: 21925383
- Yepiskoposyan H, Aeschimann F, Nilsson D, Okoniewski M, Mühlemann O. Autoregulation of the nonsense-mediated mRNA decay pathway in human cells. RNA 2011; 17:2108 - 18; http://dx.doi.org/10.1261/rna.030247.111; PMID: 22028362
- Chan WK, Huang L, Gudikote JP, Chang YF, Imam JS, MacLean JA 2nd, et al. An alternative branch of the nonsense-mediated decay pathway. EMBO J 2007; 26:1820 - 30; http://dx.doi.org/10.1038/sj.emboj.7601628; PMID: 17363904
- Ivanov PV, Gehring NH, Kunz JB, Hentze MW, Kulozik AE. Interactions between UPF1, eRFs, PABP and the exon junction complex suggest an integrated model for mammalian NMD pathways. EMBO J 2008; 27:736 - 47; http://dx.doi.org/10.1038/emboj.2008.17; PMID: 18256688
- Saltzman AL, Kim YK, Pan Q, Fagnani MM, Maquat LE, Blencowe BJ. Regulation of multiple core spliceosomal proteins by alternative splicing-coupled nonsense-mediated mRNA decay. Mol Cell Biol 2008; 28:4320 - 30; http://dx.doi.org/10.1128/MCB.00361-08; PMID: 18443041
- Gehring NH, Lamprinaki S, Hentze MW, Kulozik AE. The hierarchy of exon-junction complex assembly by the spliceosome explains key features of mammalian nonsense-mediated mRNA decay. PLoS Biol 2009; 7:e1000120; http://dx.doi.org/10.1371/journal.pbio.1000120; PMID: 19478851
- Imamachi N, Tani H, Akimitsu N. Up-frameshift protein 1 (UPF1): multitalented entertainer in RNA decay. Drug Discov Ther 2012; 6:55 - 61; PMID: 22622014
- Perlick HA, Medghalchi SM, Spencer FA, Kendzior RJ Jr., Dietz HC. Mammalian orthologues of a yeast regulator of nonsense transcript stability. Proc Natl Acad Sci U S A 1996; 93:10928 - 32; http://dx.doi.org/10.1073/pnas.93.20.10928; PMID: 8855285
- Culbertson MR, Leeds PF. Looking at mRNA decay pathways through the window of molecular evolution. Curr Opin Genet Dev 2003; 13:207 - 14; http://dx.doi.org/10.1016/S0959-437X(03)00014-5; PMID: 12672499
- Kim YK, Furic L, Desgroseillers L, Maquat LE. Mammalian Staufen1 recruits Upf1 to specific mRNA 3’UTRs so as to elicit mRNA decay. Cell 2005; 120:195 - 208; http://dx.doi.org/10.1016/j.cell.2004.11.050; PMID: 15680326
- Kaygun H, Marzluff WF. Regulated degradation of replication-dependent histone mRNAs requires both ATR and Upf1. Nat Struct Mol Biol 2005; 12:794 - 800; http://dx.doi.org/10.1038/nsmb972; PMID: 16086026
- Ni JZ, Grate L, Donohue JP, Preston C, Nobida N, O’Brien G, et al. Ultraconserved elements are associated with homeostatic control of splicing regulators by alternative splicing and nonsense-mediated decay. Genes Dev 2007; 21:708 - 18; http://dx.doi.org/10.1101/gad.1525507; PMID: 17369403
- Viegas MH, Gehring NH, Breit S, Hentze MW, Kulozik AE. The abundance of RNPS1, a protein component of the exon junction complex, can determine the variability in efficiency of the Nonsense Mediated Decay pathway. Nucleic Acids Res 2007; 35:4542 - 51; http://dx.doi.org/10.1093/nar/gkm461; PMID: 17586820
- Dahlseid JN, Lew-Smith J, Lelivelt MJ, Enomoto S, Ford A, Desruisseaux M, et al. mRNAs encoding telomerase components and regulators are controlled by UPF genes in Saccharomyces cerevisiae. Eukaryot Cell 2003; 2:134 - 42; http://dx.doi.org/10.1128/EC.2.1.134-142.2003; PMID: 12582130
- Kessler O, Chasin LA. Effects of nonsense mutations on nuclear and cytoplasmic adenine phosphoribosyltransferase RNA. Mol Cell Biol 1996; 16:4426 - 35; PMID: 8754843
- Foster D, Strong R, Morgan WW. A tetracycline-repressible transactivator approach suggests a shorter half-life for tyrosine hydroxylase mRNA. Brain Res Brain Res Protoc 2001; 7:137 - 46; http://dx.doi.org/10.1016/S1385-299X(01)00056-3; PMID: 11356380
- Tani H, Mizutani R, Salam KA, Tano K, Ijiri K, Wakamatsu A, et al. Genome-wide determination of RNA stability reveals hundreds of short-lived noncoding transcripts in mammals. Genome Res 2012; 22:947 - 56; http://dx.doi.org/10.1101/gr.130559.111; PMID: 22369889
- Mortazavi A, Williams BA, McCue K, Schaeffer L, Wold B. Mapping and quantifying mammalian transcriptomes by RNA-Seq. Nat Methods 2008; 5:621 - 8; http://dx.doi.org/10.1038/nmeth.1226; PMID: 18516045
- Cuccurese M, Russo G, Russo A, Pietropaolo C. Alternative splicing and nonsense-mediated mRNA decay regulate mammalian ribosomal gene expression. Nucleic Acids Res 2005; 33:5965 - 77; http://dx.doi.org/10.1093/nar/gki905; PMID: 16254077
- Sureau A, Gattoni R, Dooghe Y, Stévenin J, Soret J. SC35 autoregulates its expression by promoting splicing events that destabilize its mRNAs. EMBO J 2001; 20:1785 - 96; http://dx.doi.org/10.1093/emboj/20.7.1785; PMID: 11285241
- Kim YK, Furic L, Parisien M, Major F, DesGroseillers L, Maquat LE. Staufen1 regulates diverse classes of mammalian transcripts. EMBO J 2007; 26:2670 - 81; http://dx.doi.org/10.1038/sj.emboj.7601712; PMID: 17510634
- Singh G, Rebbapragada I, Lykke-Andersen J. A competition between stimulators and antagonists of Upf complex recruitment governs human nonsense-mediated mRNA decay. PLoS Biol 2008; 6:e111; http://dx.doi.org/10.1371/journal.pbio.0060111; PMID: 18447585
- Azzalin CM, Lingner J. The human RNA surveillance factor UPF1 is required for S phase progression and genome stability. Curr Biol 2006; 16:433 - 9; http://dx.doi.org/10.1016/j.cub.2006.01.018; PMID: 16488880
- Wingender E. The TRANSFAC project as an example of framework technology that supports the analysis of genomic regulation. Brief Bioinform 2008; 9:326 - 32; http://dx.doi.org/10.1093/bib/bbn016; PMID: 18436575
- Deltour S, Pinte S, Guerardel C, Wasylyk B, Leprince D. The human candidate tumor suppressor gene HIC1 recruits CtBP through a degenerate GLDLSKK motif. Mol Cell Biol 2002; 22:4890 - 901; http://dx.doi.org/10.1128/MCB.22.13.4890-4901.2002; PMID: 12052894
- Van Rechem C, Boulay G, Pinte S, Stankovic-Valentin N, Guérardel C, Leprince D. Differential regulation of HIC1 target genes by CtBP and NuRD, via an acetylation/SUMOylation switch, in quiescent versus proliferating cells. Mol Cell Biol 2010; 30:4045 - 59; http://dx.doi.org/10.1128/MCB.00582-09; PMID: 20547755
- Boulay G, Dubuissez M, Van Rechem C, Forget A, Helin K, Ayrault O, et al. Hypermethylated in cancer 1 (HIC1) recruits polycomb repressive complex 2 (PRC2) to a subset of its target genes through interaction with human polycomb-like (hPCL) proteins. J Biol Chem 2012; 287:10509 - 24; http://dx.doi.org/10.1074/jbc.M111.320234; PMID: 22315224
- Schoenberg DR, Maquat LE. Regulation of cytoplasmic mRNA decay. Nat Rev Genet 2012; 13:246 - 59; http://dx.doi.org/10.1038/nrg3254; PMID: 22392217
- Le Hir H, Izaurralde E, Maquat LE, Moore MJ. The spliceosome deposits multiple proteins 20-24 nucleotides upstream of mRNA exon-exon junctions. EMBO J 2000; 19:6860 - 9; http://dx.doi.org/10.1093/emboj/19.24.6860; PMID: 11118221
- Brogna S, Wen J. Nonsense-mediated mRNA decay (NMD) mechanisms. Nat Struct Mol Biol 2009; 16:107 - 13; http://dx.doi.org/10.1038/nsmb.1550; PMID: 19190664
- Chen CY, Shyu AB. Mechanisms of deadenylation-dependent decay. Wiley Interdiscip Rev RNA 2011; 2:167 - 83; http://dx.doi.org/10.1002/wrna.40; PMID: 21957004
- Silva AL, Ribeiro P, Inácio A, Liebhaber SA, Romão L. Proximity of the poly(A)-binding protein to a premature termination codon inhibits mammalian nonsense-mediated mRNA decay. RNA 2008; 14:563 - 76; http://dx.doi.org/10.1261/rna.815108; PMID: 18230761
- Eberle AB, Stalder L, Mathys H, Orozco RZ, Mühlemann O. Posttranscriptional gene regulation by spatial rearrangement of the 3′ untranslated region. PLoS Biol 2008; 6:e92; http://dx.doi.org/10.1371/journal.pbio.0060092; PMID: 18447580
- Sayers EW, Barrett T, Benson DA, Bolton E, Bryant SH, Canese K, et al. Database resources of the National Center for Biotechnology Information. Nucleic Acids Res 2010; 38:Database issue D5 - 16; http://dx.doi.org/10.1093/nar/gkp967; PMID: 19910364
- Dreszer TR, Karolchik D, Zweig AS, Hinrichs AS, Raney BJ, Kuhn RM, et al. The UCSC Genome Browser database: extensions and updates 2011. Nucleic Acids Res 2012; 40:Database issue D918 - 23; http://dx.doi.org/10.1093/nar/gkr1055; PMID: 22086951
- Huang W, Sherman BT, Lempicki RA. Systematic and integrative analysis of large gene lists using DAVID bioinformatics resources. Nat Protoc 2009; 4:44 - 57; http://dx.doi.org/10.1038/nprot.2008.211; PMID: 19131956
- Ishigaki Y, Li X, Serin G, Maquat LE. Evidence for a pioneer round of mRNA translation: mRNAs subject to nonsense-mediated decay in mammalian cells are bound by CBP80 and CBP20. Cell 2001; 106:607 - 17; http://dx.doi.org/10.1016/S0092-8674(01)00475-5; PMID: 11551508
- Takebe Y, Seiki M, Fujisawa J, Hoy P, Yokota K, Arai K, et al. SR alpha promoter: an efficient and versatile mammalian cDNA expression system composed of the simian virus 40 early promoter and the R-U5 segment of human T-cell leukemia virus type 1 long terminal repeat. Mol Cell Biol 1988; 8:466 - 72; PMID: 2827008
- Yamashita A, Ohnishi T, Kashima I, Taya Y, Ohno S. Human SMG-1, a novel phosphatidylinositol 3-kinase-related protein kinase, associates with components of the mRNA surveillance complex and is involved in the regulation of nonsense-mediated mRNA decay. Genes Dev 2001; 15:2215 - 28; http://dx.doi.org/10.1101/gad.913001; PMID: 11544179
- Kanji GK. in A Review of: 100 statistical tests (3rd edition) 2008.