Abstract
Purpose:
Mimetics based on Smac, the native inhibitor of XIAP, are promising drug-candidates for the treatment of cancer. Bivalent Smac mimetics inhibit XIAP with even higher potency than monovalent mimetics, but how to optimize the linker that tethers the two monovalent binding motifs remains controversial.
Methods:
To construct an ensemble of bivalent complex structures for evaluating various linkers, we propose herein a workflow, named TwistDock, consisting of steps of monovalent docking and linker twisting, in which the degrees of freedom are sampled focusing on the rotation of single bonds of the linker.
Results:
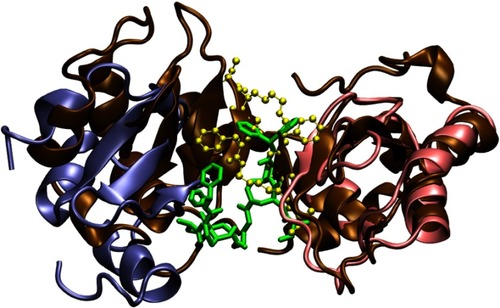
The obtained conformations of bivalent complex distribute randomly in the conformational space with respect to two reaction coordinates introduced by the linker, which are the distance of the two binding motifs and the dihedral angle of the two planes through the linker and each of the binding motifs. Molecular dynamics starting from 10 conformations with the lowest enthalpy of every complex shows that the conformational tendency of the complex participated by compound 9, one of the compounds with the largest binding affinity, is distinct from others. By umbrella sampling of the complex, we find its global minimum of the free energy landscape. The structure shows that the linker favors a compact conformation, and the two BIR domains of XIAP encompass the ligand on the opposite sides.
Conclusion:
TwistDock can be used in fine-tuning of bivalent ligands targeting XIAP and similar receptors dimerized or oligomerized.
Acknowledgments
This work is supported by the National Key Research and Development Program of China under grant number 2016YFB0201305, the National Natural Science Foundation of China under grant numbers 61702494, 31601028 and U1813203, the Shenzhen Basic Research Fund under grant numbers JCYJ20160331190123578, JCYJ20170413093358429 and GGFW2017073114031767, and the Zhejiang Provincial Natural Science Foundation of China under grant number LQ16F020006. We would also like to thank the funding support from the Shenzhen Discipline Construction Project for Urban Computing and Data Intelligence, Youth Innovation Promotion Association, Chinese Academy of Sciences, to Yanjie Wei.
Author contributions
Qingsheng Huang, Yin Peng and Dan Wei contributed to the conception and design of the study, acquisition of data, and analysis and interpretation of data. Yuefeng Peng, Yanjie Wei, and Shengzhong Feng contributed to the conception and design of the study and analysis and interpretation of data. All authors were involved in drafting or critically revising the article for intellectual content, provided approval for the final version to be published and agree to be accountable for all aspects of the work.
Disclosure
The authors declare that they have no competing interests or conflicts of interest in this work.
Supplementary materials
Table S1 The clustering results of the linker conformations
Table S2 Three sets of cutoff for clustering
Figure S1 Structures of the monovalent complex formed by BIR3 and AT-406. The docking structure (A) with the highest docking score was selected and further subjected to a 25 ns MD. This structure has a binding mode similar to the complex in PDB entry 1G73, and the RMSD between backbone heavy atoms of AVPI in 1G73 and the corresponding atoms of AT-406 is 1.056Å (calculated by VMD). The structure (B) after 25 ns MD was used to construct the bivalent complex. The structures of BIR3 and AVPI in PDB entry 1G73 are shown in the pink NewCartoon and the yellow CPK representations, respectively, while the docked AT-406 is shown in the green Licorice representation. The structure of BIR3 after 25 ns MD is shown in ochre NewCartoon representation. The zinc atom (the gray ball) is not involved in the binding site.
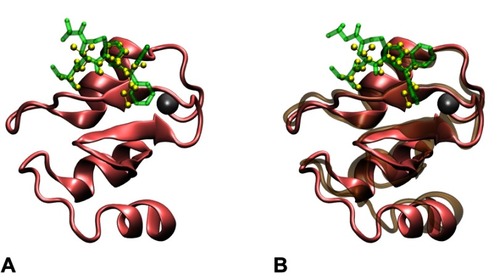
Figure S2 Structures of the monovalent complex formed by BIR2 and AT-406. Among the top three docking structures (A, B and C), the third structure (C) was selected and subjected to a 25 ns MD run, since it has a binding mode most similar (RMSD 1.123Å) to the complex formed by the AVPI sequence and the BIR2 domain in PDB entry 4J46. The RMSD is calculated between backbone heavy atoms of AVPI in 4J46 and the corresponding atoms of AT-406. The structure (D) after the 25 ns MD was used to construct the bivalent complex. In contrast, for (A) and (B) the corresponding RMSDs are 1.866Å and 1.130Å. The structures of BIR2 and AVPI in PDB entry 4J46 are shown in the iceblue NewCartoon and the yellow CPK representations, while the docked AT-406 is shown in the green Licorice representation. The structure of BIR2 after the MD run is shown in the ochre NewCartoon representation in (D). The zinc atom (the gray ball) is not involved in the binding site.
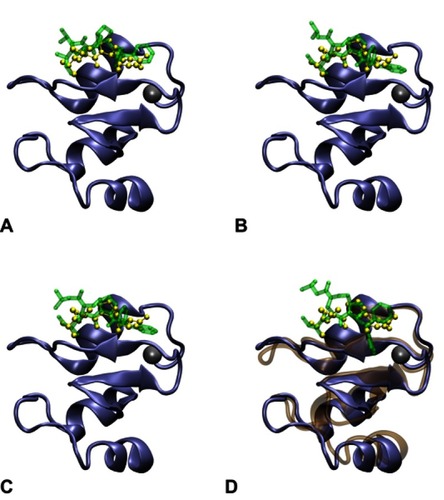
Figure S3 Distributions of clusters are insensitive to the clustering cutoff. For a bivalent complex, distributions are obtained in three sets of cutoff for clustering, where “standard” is the condition set used to produce the structures for the subsequent minimization and MD, “stringent” is the condition set resulting more structures and “loose” is the condition set resulting fewer structures. The names of the compounds that participate the formation of bivalent complexes are shown on the top line. In each distribution histogram, the x-axis denotes the value of (A) radius of gyration of the bivalent complex (Rgyr) or (B) the dihedral B2-L2-L3-B3, while the y-axis denotes the number of structures.
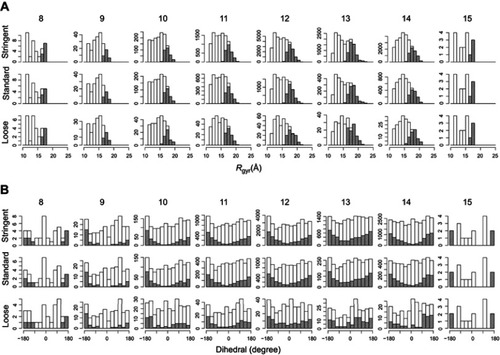
Figure S4 Distribution of the complex enthalpy. We only compared the complex enthalpy among structures of an ensemble of the same complex. Small verticle lines near the x-axis (a rug representation) indicate the 10 lowest values of the enthalpy of conformations of a complex.
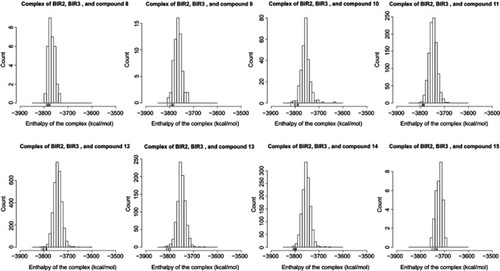
Figure S5 Comparison of a bivalent complex formed by BIR2, BIR3 and compounds 9, and a complex formed by two BIR3 domains and a bivalent Smac mimetic (PDB entry 2VSL). The structure of the complex formed by BIR2, BIR3 and compound 9, respectively, shown in iceblue and pink NewCartoon, and green Licorice, is the same one shown in . In this structure, the arrangement of the BIR2 and BIR3 domains is compact, similar to PDB entry 2VSL, whose BIR3 domains are shown in ochre NewCartoon representation and the ligand in yellow CPK representation.