

Abstract
Background
Nanoscience and nanotechnology are developing rapidly, and the applications of nanoparticles (NPs) have been found in several fields. At present, NPs are widely used in traditional consumer and industrial products, however, the properties and safety of NPs are still unclear and there are concerns about their potential environmental and health effects. The aim of the present study was to investigate the potential toxicity of ZnO NPs on testicular cells using both in vitro and in vivo systems in a mouse experimental model.
Methods
ZnO NPs with a crystalline size of 70 nm were characterized with various analytical techniques, including ultraviolet-visible spectroscopy, Fourier transform infrared spectroscopy, X-ray diffraction, transmission electron microscopy, and atomic force microscopy. The cytotoxicity of the ZnO NPs was examined in vitro on Leydig cell and Sertoli cell lines, and in vivo on the testes of CD1 mice injected with single doses of ZnO NPs.
Results
ZnO NPs were internalized by Leydig cells and Sertoli cells, and this resulted in cytotoxicity in a time- and dose-dependent manner through the induction of apoptosis. Apoptosis likely occurred as a consequence of DNA damage (detected as γ-H2AX and RAD51 foci) caused by increase in reactive oxygen species associated with loss of mitochondrial membrane potential. In addition, injection of ZnO NPs in male mice caused structural alterations in the seminiferous epithelium and sperm abnormalities.
Conclusion
These results demonstrate that ZnO NPs have the potential to induce apoptosis in testicular cells likely through DNA damage caused by reactive oxygen species, with possible adverse consequences for spermatogenesis and therefore, male fertility. This suggests that evaluating the potential impacts of engineered NPs is essential prior to their mass production, to address both the environmental and human health concerns and also to develop sustainable and safer nanomaterials.
Supplementary materials
Figure S1 ZnO NPs exposure increases autophagy in cultured LC and SC cell lines in 12 h.
Notes: (A) LC3-stained LCs: (a) the average intensity of LC3 fluorescence in LCs. (B) LC3-stained SCs: (b) the average intensity of LC3 fluorescence in SCs. Scale bars =100 μm. **P<0.01.
Abbreviations: DAPI, 4′,6-diamidino-2-phenylindole; LCs, Leydig cells; NPs, nanoparticles; SCs, Sertoli cells.
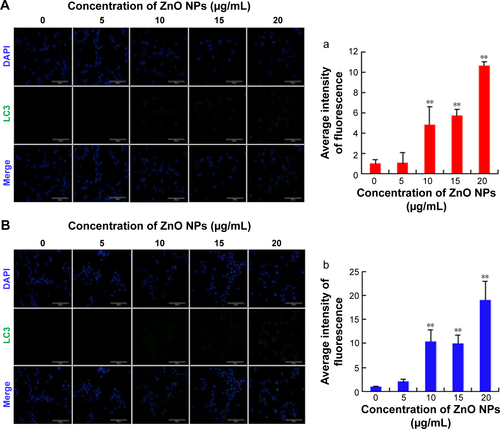
Figure S2 Toxicity of ZnSO4·7H2O for LCs and SCs, and dissolution curve of Zn2+ from different concentrations of ZnO NPs and ZnSO4·7H2O in medium.
Notes: (A and B) In order to verify ZnSO4·7H2O cytotoxicity, cells were treated with various concentrations of ZnSO4·7H2O for 12 and 24 hours, and viability determined with MTT. MTT indicated time- and concentration-dependent cytotoxicity of ZnSO4·7H2O on both cell lines. On comparing the effects of ZnO NPs on the two cell lines with the MTT assay, the ZnO NPs showed hazardous effects than ZnSO4·7H2O. (C) Dissolution curve of Zn2+ from different concentrations of ZnO NPs in medium. (D) Dissolution curve of Zn2+ from different concentrations of ZnSO4·7H2O in medium. More Zn2+ was released from ZnSO4·7H2O than ZnO NPs at the highest concentration. This shows that the ZnO NP toxicity was dependent on the particle and not on the released Zn2+. Also, 17.665, 35.33, 52.995, and 70.66 μg/mL ZnSO4·7H2O have the same concentration zinc with 5, 10, 15, and 20 μg/mL ZnO NPs, respectively. The results are expressed as the mean ± standard deviation of three separate experiments.
Abbreviations: LCs, Leydig cells; MTT, 3-(4,5-dimethylthiazol-2-yl)-2,5-diphenyltetrazolium bromide; NPs, nanoparticles; SCs, Sertoli cells; h, hours.
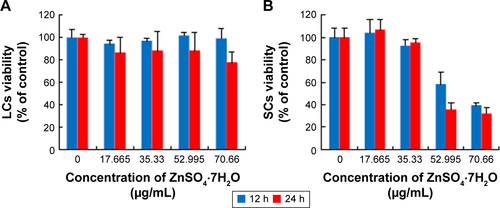
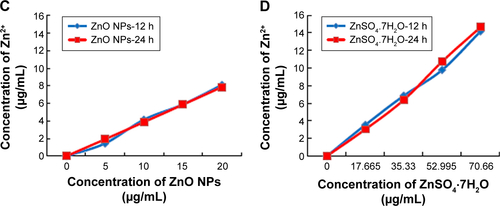
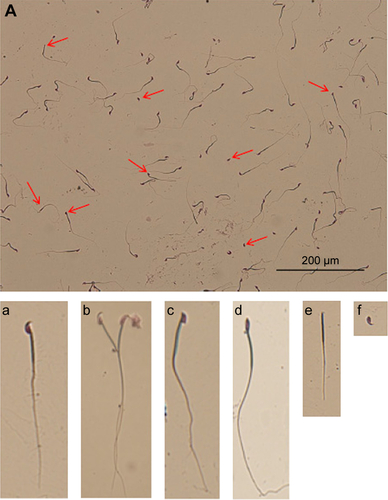
Figure S3 Picture of sperm morphologies.
Notes: (A) Picture of sperm morphologies and abnormal sperm (red arrows). (a) Normal sperm. (b) Abnormal sperm with two heads and two tails. (c, d) Abnormal sperm with head deformities. (e) Abnormal sperm with no head. (f) Abnormal sperm with no tail.
Acknowledgments
This work was supported by the Science and Technology Research Program from the Department of Education of Hubei Province in People’s Republic of China (D20151701). The authors would like to thank Paul Dyce for his critical reviewing of the manuscript.
Disclosure
The authors report no conflicts of interest in this work.