Figures & data
Table 1. Characteristics of patients evaluated in this study (N = 44).
Figure 1. Etiology of patients with residual acoustic hearing. Orange indicates genetic causes of hearing loss; yellow, other causes; grey, unknown (n = 41).
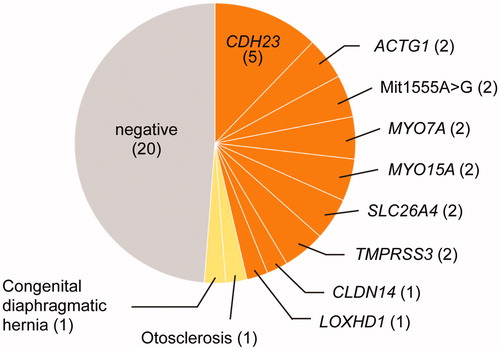
Table 2. Summary of the clinical features and information of the variants identified as likely causative in this study.
Table 3. Univariate analysis of variables and hearing preservation scale.
Figure 2. Comparison of hearing threshold shifts after implant surgery. Median, interquartile, minimum and maximum scores for the HP scale. Statistical analysis by one-way ANOVA with Bonferroni’s correction. NS: statistically not significant.
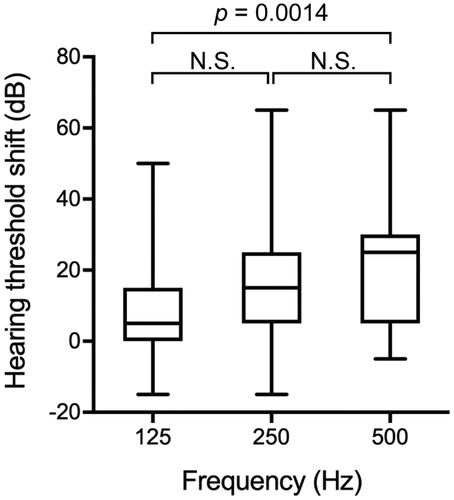
Figure 3. Comparison of HP scores among three types of CI electrode array. Median, interquartile, minimum and maximum scores for the HP scale. Statistical analysis by one-way ANOVA with Bonferroni’s correction. NS: statistically not significant.
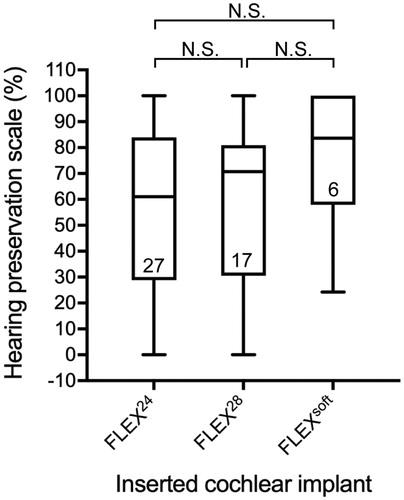
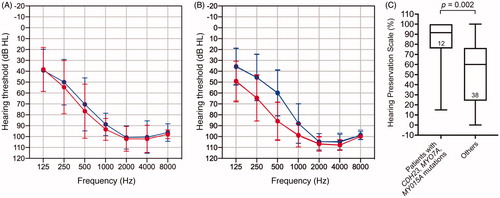
Figure 4. Average pre- (blue line) and post-operative (red line) air conduction hearing thresholds for patients with (A) pathogenic variants in the CDH23, MYO7A, or MYO15A gene, and (B) hearing loss due to other causes. Error bars represent the SD. (C) A comparison of HP scores in each group. Median, interquartile, minimum and maximum scores for the HP scale. Statistical analysis by Mann–Whitney test.