
Figures & data
Table 1. Summary of subject characteristics and hearing preservation outcomes.
Figure 1. Individual air-conduction hearing thresholds. The dashed and solid lines indicate pre- and 6 months post-op, respectively. Electrode array illustrations represent insertion depth.
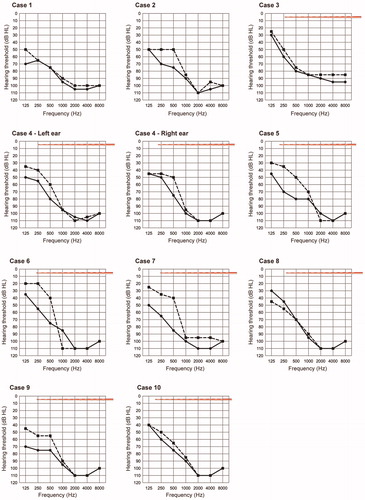
Figure 2. Average air-conduction hearing thresholds. The dashed and solid lines indicate pre- and 6 months post-op, respectively. Gray and black lines show the individual and mean, respectively.
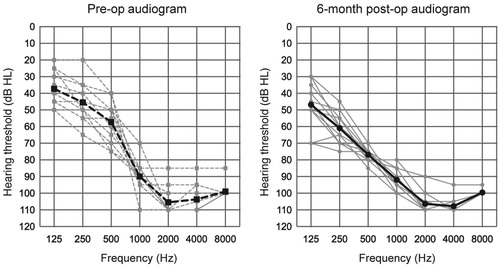
Figure 3. Characteristic frequency of each electrode with the default setting (gray square), FLEX28 (orange circles) and FLEX24 (green circles) (n = 9).
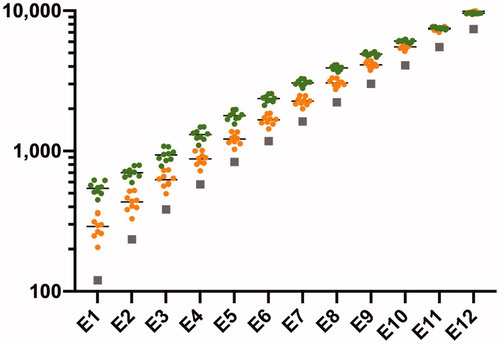
Figure 4. Case 4: the right ear. (A) Audiograms at activation and 1 year later. Electrode array illustrations represent insertion depth. (B) Post-op X-ray findings. Numbers indicate channels. (C) Imaging for each electrode location and the reference tonotopic map.
Note: (C) Copyright license agreement was accepted [Citation9].
![Figure 4. Case 4: the right ear. (A) Audiograms at activation and 1 year later. Electrode array illustrations represent insertion depth. (B) Post-op X-ray findings. Numbers indicate channels. (C) Imaging for each electrode location and the reference tonotopic map. Note: (C) Copyright license agreement was accepted [Citation9].](/cms/asset/85f10272-6848-456f-9691-57f44cb7d458/ioto_a_1760351_f0004_c.jpg)
Figure 5. Case 8. (A) Pre- and 6 months post-op audiograms. Electrode array illustrations represent insertion depth. (B) Post-op X-ray findings. Numbers indicate channels. (C) Imaging for each electrode location and the reference tonotopic map.
Note: (C) Copyright license agreement was accepted [Citation9].
![Figure 5. Case 8. (A) Pre- and 6 months post-op audiograms. Electrode array illustrations represent insertion depth. (B) Post-op X-ray findings. Numbers indicate channels. (C) Imaging for each electrode location and the reference tonotopic map.Note: (C) Copyright license agreement was accepted [Citation9].](/cms/asset/a416de83-46d8-4ff3-9b09-abedb48eb541/ioto_a_1760351_f0005_c.jpg)