
Figures & data
Table 1. Summary of the monitoring from Lake Horowhenua (LH, n = 66) and the Turitea water reservoir (TR, n = 53), data represent min value – max value (average in parenthesis).
Table 2. N2O Fluxes (mg·m−2·d−1) reported from studies focusing on greenhouse gases emissions from lakes and reservoirs and acknowledging a relation between emissions and the presence of primary producers.
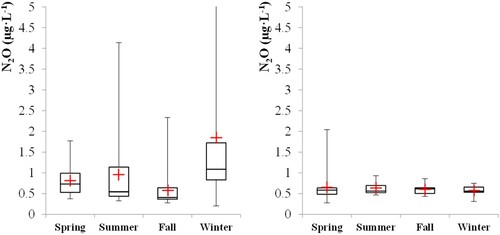
Figure 1. Seasonal distribution of N2O dissolved concentration (µg·L−1) at Lake Horowhenua (left) and the Turitea reservoir (right).
Supplemental material