
Figures & data
Table 1 Sample sizes and descriptive statistics on covariates by country: European countries, 2006–07 and 2018–19
Figure 1 Acknowledgment of an ideal age at first birth and of an upper age limit for childbearing: European countries, 2006–07 and 2018–19
Notes: The figure shows the percentage of respondents who acknowledged an ideal age above 12 years and an upper age limit between 26 and 80. Data are weighted using analysis weights. Countries are presented in alphabetical order. For the numerical values, refer to Tables A3 and A4 (supplementary material).
Source: Authors’ analysis of European Social Survey data (Rounds 3 and 9).
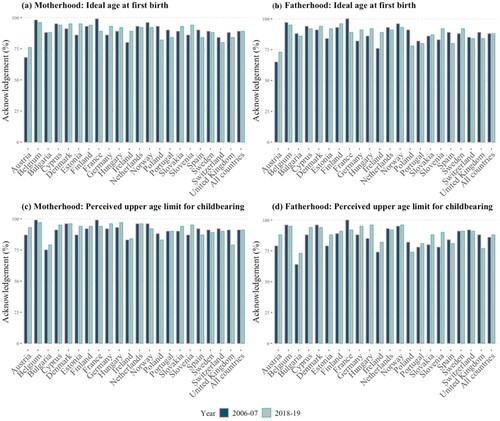
Figure 2 Change in the perceived reproductive window for motherhood and fatherhood between 2006–07 and 2018–19: European countries (a) Motherhood (b) Fatherhood
Notes: Sample consists of respondents who acknowledged an ideal age above 12 years and an upper age limit between 26 and 80. Data are weighted using analysis weights. Countries are ordered by value of ideal age at first birth in 2006–07. For the numerical values refer to Table 2.
Source: As for .
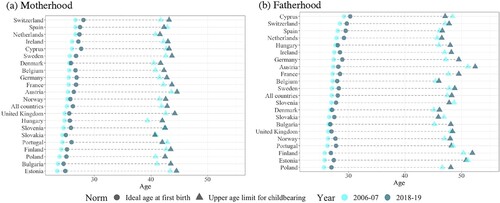
Table 2 Ideal age at first birth and perceived upper age limit for childbearing in 2006–07 and 2018–19: European countries
Figure 3 Association between the changes in the perceived reproductive windows for motherhood and fatherhood between 2006–07 and 2018–19
Notes: Sample consists of respondents who acknowledged an ideal age above 12 years and an upper age limit between 26 and 80. Data are weighted using analysis weights.
Source: As for .
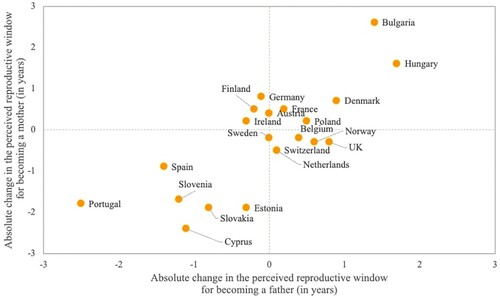
Table 3 Estimated percentage contribution of explained and unexplained effects (from Blinder–Oaxaca decomposition models) to the change between 2006–07 and 2018–19 in the mean ideal age at first birth and upper age deadline for childbearing for women and men: European countries
Figure 4 Association between the relative increases in the observed mean age at first birth and the mean ideal age at first birth for women between 2006–07 and 2018–19: European countries
Notes: Sample consists of respondents who acknowledged an ideal age above 12 years and an upper age limit between 26 and 80. data are weighted using analysis weights.
Source: For observed values: Eurostat (Citation2023); Kreyenfeld et al. (Citation2011) for Germany, 2006–07; Human Fertility Database (Citation2023) for Denmark, 2006–07; Office for National Statistics (Citation2023) for the UK, 2006–07. For ideal values: European Social Survey (Rounds 3 and 9).
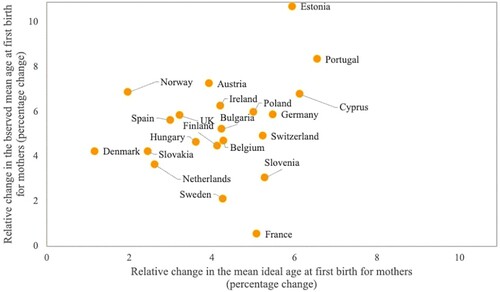
Table 4 Absolute and relative changes in the percentage contribution of fertility rates at age 40–49 to total fertility and in the perceived upper age limit for women’s childbearing between 2006–07 and 2018–19: European countries