Figures & data
Figure 1. Paracellular permeability in colonic biopsies mounted on Ussing chambers and their corresponding zonulin colonic and circulating levels. (A) Passage of 51Chromium (Cr)-EDTA in the colonic mucosa of 15 healthy controls (HC) and 32 patients with irritable bowel syndrome (IBS). (B) Zonulin levels measured in biopsy lysates of HC and patients with IBS. (C) Circulating levels of zonulin measured in the plasma of HC and patients with IBS. Open scatter dots depict samples showing leakier mucosa. Data was analyzed by Mann–Whitney U test (unpaired, two-tailed) and presented as median (interquartile range) *p < .05.
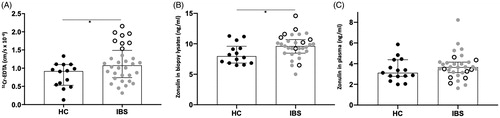
Figure 2. Colonic paracellular permeability correlates negatively with circulating zonulin and positively with zonulin in biopsy lysates of patients with irritable bowel syndrome (IBS). (A) Correlation of the passage of 51Chromium (Cr)-EDTA in the colonic mucosa of 32 patients with IBS with their corresponding tissue zonulin levels. (B) Correlation of the passage of 51Cr-EDTA in the colonic mucosa of 32 patients with IBS with their corresponding plasma zonulin levels. (C) Correlation of the passage of 51Cr-EDTA in the colonic mucosa of 15 healthy controls (HC) with their corresponding tissue zonulin levels (D) Correlation of 51Cr-EDTA permeability in the colonic mucosa of 15 HC with their corresponding plasma zonulin levels. Data was analyzed by non-parametric Spearman’s correlation and presented as the actual values of each parameter. Open scatter dots depict samples showing leakier mucosa. Correlation coefficient is presented as r = −1 to 1, statistical significance is indicated as *p < .05.
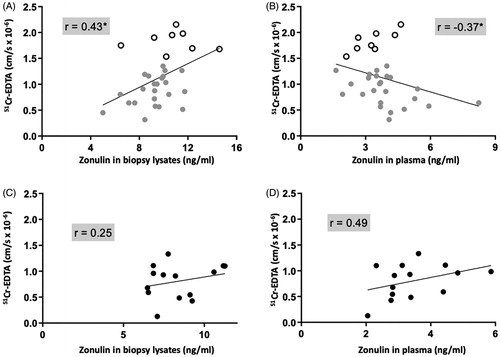
Table 1. Haptoglobin (Hp) genes distribution within the healthy control (HC) group and the group of patients with irritable bowel syndrome (IBS) and their average zonulin levels as assayed by Cusabio ELISA kit.
Figure 3. Colonic paracellular permeability does not correlate with pre-haptoglobin 2 (pre-HP2) in plasma of healthy controls (HC) and patients with irritable bowel syndrome (IBS). (A) Correlation of 51Chromium (Cr)-EDTA permeability in the colonic mucosa of 15 HC with their corresponding plasma pre-HP2 levels. (B) Correlation of 51Cr-EDTA permeability in the colonic mucosa of 32 patients with IBS with their corresponding plasma pre-HP2 levels. Data was analyzed by non-parametric Spearman’s correlation and presented as the actual values of each parameter. Open scatter dots depict samples showing leakier mucosa. Correlation coefficient is presented as r = –1 to 1.
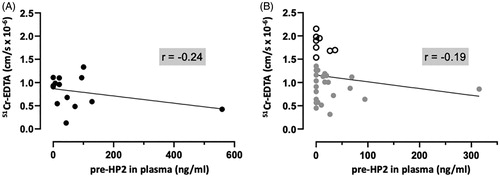
Table 2. Haptoglobin (Hp) genes distribution within the healthy control (HC) group and the group of patients with irritable bowel syndrome (IBS) and their average pre-HP2 levels as assayed by ELISA using a specific monoclonal pre-HP2 antibody (Bio-Rad).
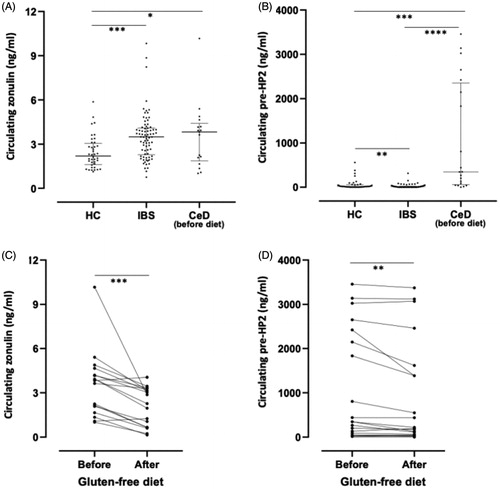
Figure 4. Circulating levels of zonulin and pre-haptoglobin 2 (HP2) in healthy controls (HC), patients with irritable bowel syndrome (IBS) and patients with celiac disease (CeD) before and after gluten-free diet. (A) Zonulin concentrations measured by Cusabio ELISA kit in plasma from 40 HC and 78 patients with IBS and in serum from 17 patients with CeD (B) Pre-HP2 concentrations measured by ELISA using pre-HP2 monoclonal antibody (Bio-Rad) in plasma from 40 HC and 78 patients with IBS and in serum from 20 patients with CeD. (C) Zonulin concentrations measured by Cusabio ELISA in serum from17 patients with CeD before and after gluten-free diet. (D) Pre-HP2 concentrations measured by ELISA using pre-HP2 monoclonal antibody (Bio-Rad) in serum from 20 patients with CeD before and after gluten-free diet. Data is expressed as median with interquartile range (A, B) or as mean values (C,D). One-way ANOVA Kruskal–Wallis followed by Dunn’s multiple comparison post hoc test (A,B), or non-parametric Wilcoxon matched-pair rank (C,D) were used for comparisons, *p < .05; **p < .01; ***p < .001 and ****p < .0001.