
Figures & data
Table 1. Overview of the six virtual patients created for the study.
Figure 1. Screenshot of the virtual patient Miray Günal with the concept mapping tool on the right side.
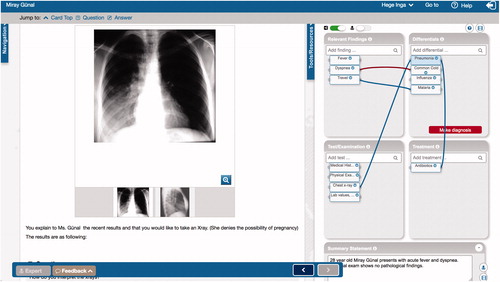
Figure 2. Overview of the study design.
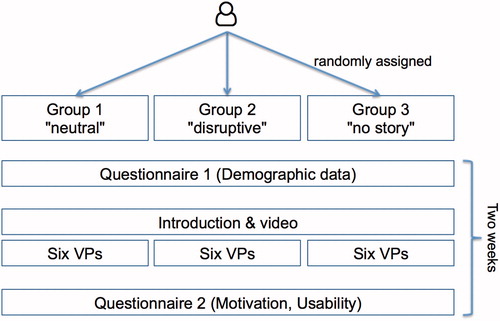
Table 2. Participant characteristics and exemplary answers to questionnaire 2 for the three groups.
Figure 3. Mean number of tries to submit the correct final diagnosis for the two levels of difficulty and the three groups. * significant difference to group FRIENDLY (p < .05).
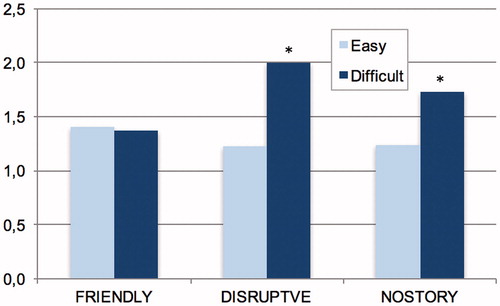
Table 3. Mean number of the different nodes and connections for the three groups and VP difficulty.
Supplemental material