
Figures & data
Figure 1. Histogram of the frequency of the number of collected mini-CEXs exceeding the minimum requirements.
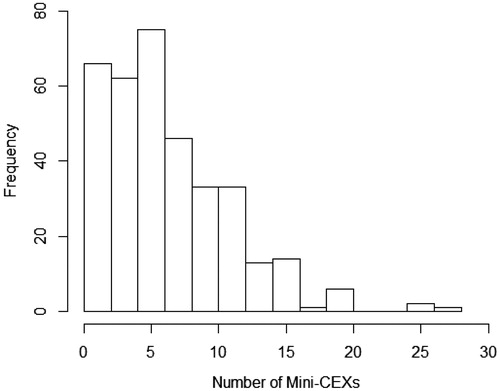
Table 1. Overview of the average given grade including the standard deviation (rounded off on 2 decimals) and the number of high-stakes assessments per assessor.
Table 2. Frequency table of the given high-stakes grades by the assessors.