
Figures & data
Table 1. Descriptive statistics for the key facets of the PLAB2 exam (Nov. 2016 to March 2020).
Table 2. Outline of main modelling approach for station-level domain scores and pass/fail decisions.
Table 3. Brief overview of each potential method of setting MNSP.
Table 4. Variance components for domain scores and pass/fail decision in a station.
Table 5. Overall reliability/SEM estimates for an 18 station PLAB2 OSCE.
Figure 1. Calculation of the M4 standard for a particular examination with 35 candidates.
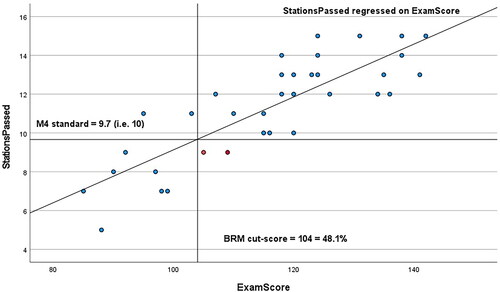
Table 6. Candidate level pass/fail breakdown across all data.
Figure 2. The M4 minimum station standard (18 station PLAB2 exams only, rounded) (n = 372).
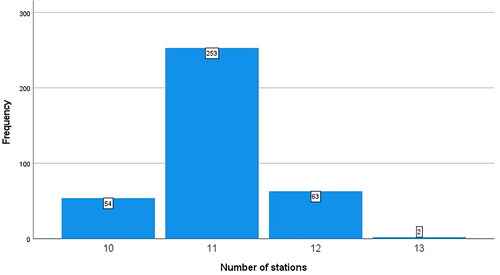
Table A1. Breakdown of problems occurring with calculating M3 in PLAB2 station level data.