
Figures & data
Table 1. Information about the activity trackers used in the experiment and their placement in this study.
Figure 1. Examples of the seven tasks that dogs performed during the experiment.
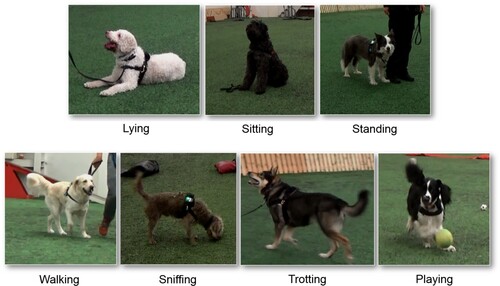
Table 2. Ethogram for annotation of dogs’ behaviors from video recordings.
Figure 2. Correlation of the activity scores obtained by different devices (panels A-C) and locations (panel D), given in counts per minute (cpm).
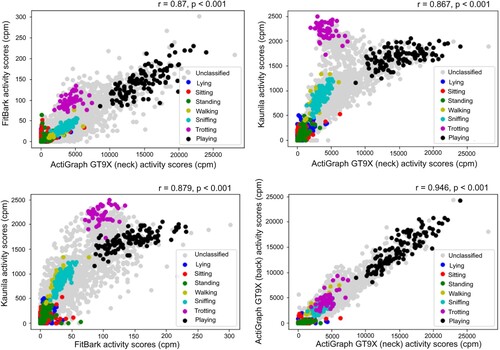
Figure 3. Medians (with Q1 and Q3) of minute-based total activity score (in counts per minute; cpm) for the analyzed behaviors (in the horizontal axis), measured by the four devices.
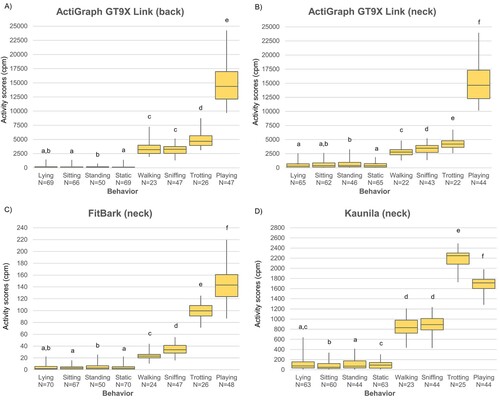
Table 3. Accelerometer cutoffs and their accuracy for the different behaviors (lying, sitting, standing, walking, sniffing, trotting and playing) and devices (ActiGraph GT9X Link placed on the back and on the neck, FitBark and Kaunila). Cutoff = mean optimal cutoff calculated among the 10 training subsets; AUC (95% CI) = mean area under the curve with its 95% confidence interval among the 10 training subsets; Se = mean sensitivity among the 10 training subsets and Sp = mean specificity among the 10 training subsets.
Table 4. Confusion matrix showing the classification accuracy of ActiGraph GT9X Link placed on the back for the behaviors classified using activity scores. Classification accuracy is reported as the percentage (%) of the average amount of minutes fulfilling the time requirement and belonging to each category among the 10 testing subsets.
Table 5. Confusion matrix showing the classification accuracy of ActiGraph GT9X Link placed on the neck for the behaviors classified using activity scores. Classification accuracy is reported as the percentage (%) of the average amount of minutes fulfilling the time requirement and belonging to each category among the 10 testing subsets.
Table 6. Confusion matrix showing the classification accuracy of FitBark placed on the neck for the behaviors classified using activity scores. Classification accuracy is reported as the percentage (%) of the average amount of minutes fulfilling the time requirement and belonging to each category among the 10 testing subsets.
Table 7. Confusion matrix showing the classification accuracy of Kaunila placed on the neck for the behaviors classified using activity scores. Classification accuracy is reported as the percentage (%) of the average amount of minutes fulfilling the time requirement and belonging to each category among the 10 testing subsets.