
Figures & data
Table 1. Specific absorption rates of MNPs measured in an alternating magnetic field (345 kHz/59 kA/m).
Table 2. Specific absorption rates of MNPs measured in an alternating magnetic field with a frequency of 223 kHz/41 kA/m.
Figure 1. SAR values of MNPs measured in an alternating magnetic field (a) 345 kHz/59 kA/m and (b) 223 kHz/41 kA/m. SAR values were calculated by the ISM, CSM, and BLM. Notes: the filled area represents the SAR values of water calculated by different methods between its lower (mean - 3σ) and upper (mean + 3σ) limits.
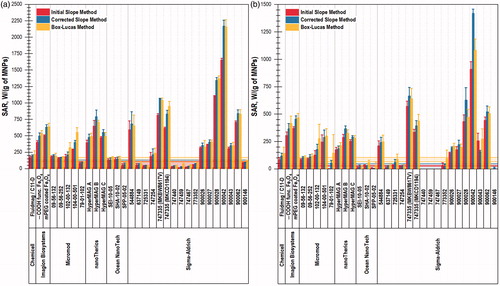
Figure 2. Residual plots (b–e, g–j) for HyperMAG B particles after approximation their heating in an alternating magnetic field with a frequency of 345 kHz with (a) BLM and (f) ISM: (b–e) correspond to BLM; (g–j) correspond to the ISM.
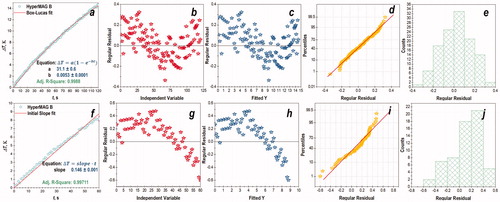
Table 3. Parameters of MNPS including the diameter provided by the manufacturer, hydrodynamic diameter evaluated by DLS and NTA, magnetic diameter calculated from magnetic hysteresis loops using Langevin–Chantrell function, and mass magnetization at 1 T.
Figure 3. TEM images of MNPs: Micromod 79-01-102 (a); Sigma-Aldrich 747335 lot MKBW1867V(b); Sigma-Aldrich 747335 lot MKCD1194(c); Sigma-Aldrich 900028(d); Sigma- Aldrich 900042 (e); and their magnetic hysteresis loops (f). Inserts: SAR values calculated by the Box- Lucas method at 345 kHz are listed in the lower right corner followed by the TEM core diameters.
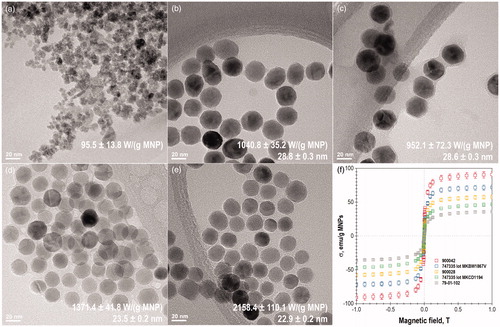
Table 4. Pearson’s and Spearman s correlation coefficients and its p-values between BLM-SAR values at 345 kHz/59 kA/m and other parameters.