
Figures & data
Figure 1. Heterogeneous tissue paths. Ultrasound waves from different portions of the histotripsy transducer aperture take heterogeneous paths to the target due to differences in the speed of sound among water and different tissues.
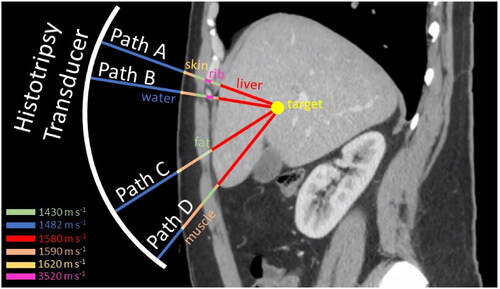
Figure 2. Soft tissue histotripsy phase aberration. (a) a histotripsy transducer (blue) was simulated focusing through the human abdomen at a target (yellow) in the liver. (b) Simulated arrival time differences to the target projected onto the transducer aperture. Portions blocked by rib and bowel/lung are shown in gray and black, respectively. (c) Axial profiles of the focal pressure amplitude, with (orange) and without (blue) aberration correction. (d), (e) 12-mm × 12-mm transverse cross sections of the focal pressure amplitude, without (d) and with (e) aberration correction (this figure is adapted from Yeats et al. [Citation67]).
![Figure 2. Soft tissue histotripsy phase aberration. (a) a histotripsy transducer (blue) was simulated focusing through the human abdomen at a target (yellow) in the liver. (b) Simulated arrival time differences to the target projected onto the transducer aperture. Portions blocked by rib and bowel/lung are shown in gray and black, respectively. (c) Axial profiles of the focal pressure amplitude, with (orange) and without (blue) aberration correction. (d), (e) 12-mm × 12-mm transverse cross sections of the focal pressure amplitude, without (d) and with (e) aberration correction (this figure is adapted from Yeats et al. [Citation67]).](/cms/asset/ba334717-9dea-4c24-8dbe-db43091774f1/ihyt_a_2266594_f0002_c.jpg)
Figure 3. The ray tracing method described by Liu et al. to correct phase errors when focusing through the human abdomen [Citation70]. (a) abdominal magnetic resonance image of a patient receiving therapeutic ultrasound treatment for a uterine fibroid. (b) Segmentation of the patient image into water (W), fat (F), muscle (M), uterus (U), and fibroid (Fi). (c) ray tracing method to determine phase correction. Step 1: Project rays from the transducer assuming a homogeneous (h) medium to find the normal velocity at the fibroid surface. Step 2: Project the conjugate velocity
back to a transducer through the heterogeneous path to find
Step 3: Extract the corrected phase as
(This figure is adapted from Liu et al. [Citation70]).
![Figure 3. The ray tracing method described by Liu et al. to correct phase errors when focusing through the human abdomen [Citation70]. (a) abdominal magnetic resonance image of a patient receiving therapeutic ultrasound treatment for a uterine fibroid. (b) Segmentation of the patient image into water (W), fat (F), muscle (M), uterus (U), and fibroid (Fi). (c) ray tracing method to determine phase correction. Step 1: Project rays from the transducer assuming a homogeneous (h) medium to find the normal velocity va at the fibroid surface. Step 2: Project the conjugate velocity va* back to a transducer through the heterogeneous path to find vb. Step 3: Extract the corrected phase as arg(vb*). (This figure is adapted from Liu et al. [Citation70]).](/cms/asset/c5e65c05-37e7-43ee-9724-265df3c6de88/ihyt_a_2266594_f0003_c.jpg)
Figure 4. Iterative phase estimation using ultrasound speckle signals. Left side: color-coded maps of the detected arrival time for each element of a boiling histotripsy array focusing through in vivo porcine abdomen. Right side: the speckle signal received by each array element. The dashed line marks the time window corresponding to the focus. Iterations 0, 2, and 8 (final) are shown (this figure is adapted from Thomas et al. [Citation132]).
![Figure 4. Iterative phase estimation using ultrasound speckle signals. Left side: color-coded maps of the detected arrival time for each element of a boiling histotripsy array focusing through in vivo porcine abdomen. Right side: the speckle signal received by each array element. The dashed line marks the time window corresponding to the focus. Iterations 0, 2, and 8 (final) are shown (this figure is adapted from Thomas et al. [Citation132]).](/cms/asset/44967392-994b-42d5-a676-12d2daa44722/ihyt_a_2266594_f0004_c.jpg)
Figure 5. Focusing quality improvement using cavitation-based aberration correction. Transverse cross-section of the focal pressure amplitude from an ultrasound imaging array after propagation through water only (a) and an intervening rubber aberrator without correction (b) and with cavitation-based aberration correction (c) (this figure is from Pernot et al. [Citation138]).
![Figure 5. Focusing quality improvement using cavitation-based aberration correction. Transverse cross-section of the focal pressure amplitude from an ultrasound imaging array after propagation through water only (a) and an intervening rubber aberrator without correction (b) and with cavitation-based aberration correction (c) (this figure is from Pernot et al. [Citation138]).](/cms/asset/2af68eec-f0c7-4d60-9c00-469968516d95/ihyt_a_2266594_f0005_b.jpg)
Figure 6. Shockwaves from inertial cavitation. (a) The cavitation cloud nucleation emits a cluster of overlapping shockwaves. (b) The cavitation cloud collapse often emits a single shockwave. Top: shadowgraph images, bottom: hydrophone recordings at 12 cm from the shockwave origin. Red arrows denote shockwaves. The purple arrow denotes the histotripsy wavefront, propagating upwards in these images (this figure is adapted from Yeats et al. [Citation162]).
![Figure 6. Shockwaves from inertial cavitation. (a) The cavitation cloud nucleation emits a cluster of overlapping shockwaves. (b) The cavitation cloud collapse often emits a single shockwave. Top: shadowgraph images, bottom: hydrophone recordings at 12 cm from the shockwave origin. Red arrows denote shockwaves. The purple arrow denotes the histotripsy wavefront, propagating upwards in these images (this figure is adapted from Yeats et al. [Citation162]).](/cms/asset/abe796ea-a2df-4b33-89df-b2ead0ce3fa1/ihyt_a_2266594_f0006_c.jpg)
Figure 7. Alignment of the positive phase of the pressure waveform for boiling histotripsy. (a) Focal pressure waveforms were measured from a 12-element boiling histotripsy array focusing through an excised porcine abdomen using a fiber optic hydrophone (FOPH). (b) pressure waveforms from individual elements (top) and the entire array (bottom) in the free field (water only). (c) pressure waveforms from individual elements (top) and the entire array (bottom) without (dark blue) and with (green) aberration correction. (this figure is from Khokhlova et al. [Citation14]).
![Figure 7. Alignment of the positive phase of the pressure waveform for boiling histotripsy. (a) Focal pressure waveforms were measured from a 12-element boiling histotripsy array focusing through an excised porcine abdomen using a fiber optic hydrophone (FOPH). (b) pressure waveforms from individual elements (top) and the entire array (bottom) in the free field (water only). (c) pressure waveforms from individual elements (top) and the entire array (bottom) without (dark blue) and with (green) aberration correction. (this figure is from Khokhlova et al. [Citation14]).](/cms/asset/e5d2f61b-c9f9-4d60-bd7a-b3d1250f55b3/ihyt_a_2266594_f0007_c.jpg)