
Figures & data
Figure 1. A Pictorial diagram of the histotripsy mechanism and downstream biological effects. Histotripsy works by generating acoustic cavitation bubble cloud from endogenous gas in tissues via ultrasound pulses. The expansion of the microbubbles that the cavitation cloud is composed of exerts pressure on cells ultimately leading to cell lysis (mechanical stress and cell lysis panel). The lysis of targeted cells results in the release of immunogenic proteins stimulating an immune response. The stimulated immune response has the potential to shift an immunological quiescent tumor into an immunological responsive state to aid in tumor regression (inflammation & immunity panel). Over time the acellular homogenate created by histotripsy ablation is resorbed and the targeted tissue is repaired (ablated tissue resorption and repair panel). created with BioRender.com.
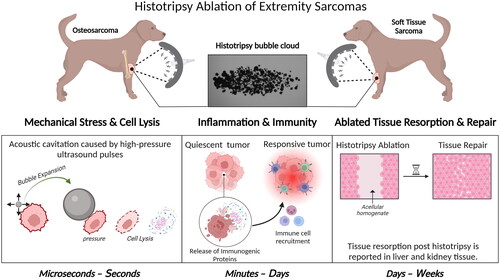
Table 1. A summary of relevant literature pertaining to thermal ablation modalities and radiation therapy for extremity tumors in human and veterinary medicine.
Table 2. A summary of the histotripsy ablation studies for canine OS and STS.
Table 3. Reported and proposed methods for monitoring histotripsy ablation in real-time during extremity tumor ablation.
Figure 2. Experimental histotripsy set-up. A) a robotic micro-positioner is connected to an articulating arm supporting the therapy and imaging transducer assembly. The transducer assembly was submerged in a water coupling bowl coupled to the patient’s tumor, and treatment was monitored in real-time using ultrasound imaging. B) The 500 kHZ histotripsy transducer with coaxially aligned ultrasound imaging probe utilized for OS and STS extremity tumor ablation in canine patients.
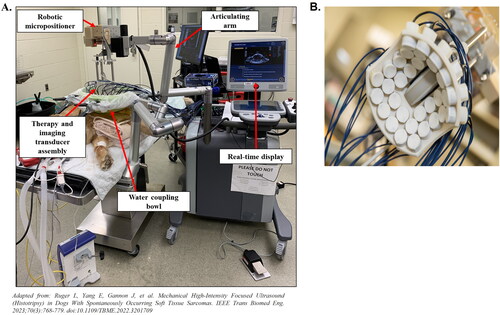
Figure 3. Representative images demonstrating histotripsy ablation in OS. (A) gross pathology and (B) low- (2×) and high-magnification (20×) microscopic histology images comparing treated and untreated OS tumor regions. In all patients shown, histotripsy-treated regions of the tumor (thick black boxes in (a)) were characterized by hemorrhage, tissue softening, and/or necrosis. Sections from untreated areas of OS tumors showed dense proliferation of neoplastic osteoblasts variably surrounding the osteoid matrix (black arrowheads). in contrast, sections from treated tumors exhibited hemorrhage and necrosis, abundant cell death (empty arrowheads identify dead or dying cells), complete tissue obliteration with replacement basophilic slipping (white star), and/or matrix degeneration (not shown). (B) were taken from boxed regions in columns 1 and 3, respectively.
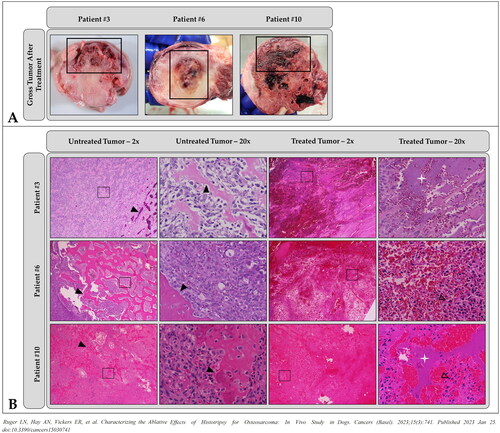
Figure 4. Representative images demonstrating histotripsy ablation of STS. (a) Gross visualization of lesion characterized by extensive tissue necrosis and hemorrhage (arrow). (b-f) H&E stained sections compared (d) untreated (magnification 40x) and (e) treated (magnification 40x) tumor tissues and (b,c,f) interface regions (c – magnification 2x; f – magnification 40x). clearly delineated boundaries between treated (+) and untreated (*) tumor tissue were observed.
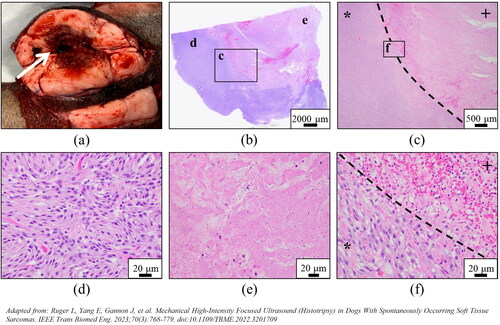
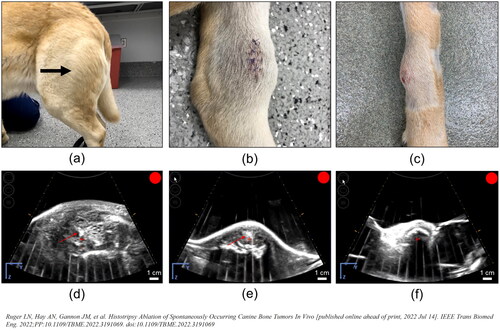
Figure 5. Representative photographs of grossly visible OS tumors and US bubble cloud photos during treatment. (a–c) Patient images showing different gross appearances between the treated primary bone tumors correlating to different radiographic tumor characteristics representing (a) a grossly visible extensive soft tissue component (arrow), (b) a primarily lytic tumor with a small amount of soft tissue component, and (c) a primarily proliferative bone tumor with mostly intact cortical bone. (d–f) B-mode ultrasound images during treatment. Cavitation bubble clouds (arrows) were visible when histotripsy was applied to the soft tissue tumor component and lytic tumors (d,e), but not when applied to patients with proliferative bone tumors and mostly intact cortical bone (f).
Data availability statement
Not applicable.