
Figures & data
Table 1. Demographic, linguistic, and clinical background information of the participants.
Table 2. Summary of the individual scores obtained in the Wechsler Adult Intelligence Scale (WAIS-III; Wechsler, Citation1997) and the extended version of the Boston Aphasia Test (%) (BDAE; Goodglass, Kaplan, & Barresi, Citation2005; Adapted to Spanish by García-Albea, Citation2005).
Figure 1. Sample visual display. Target stimulus (Active): “El árbitro ha empujado al portero” (The referee has pushed the goalkeeper). (a) Target picture; (b) Foil.
Table 3. Regions of Interest (ROI), duration (ms) (mean and SD), and comparison of length across paired conditions.
Figure 2. Response grid used to self-report confidence rate on the accuracy of the sentence–picture matching task.
The emoticons represented the next confidence rates: green smiley face = “sure, I answered correctly”; amber neutral face = “I don´t know/guess”; red sad face = “sure, I answered incorrectly”.

Table 4. Comprehension accuracy (%) and standard error (SE) as a function of group and sentence condition.
Table 5. Distribution (%) of the confidence ratings within correctly and incorrectly answered trials in both PWA and NBD groups.
Figure 3. Distribution (%) of the self-reported judgement of the sentence–picture matching task as a function of response accuracy in both NBD and PWA groups.
Confidence rating 1 = “sure, I answered correctly”, 2 = “I do not know, guessing”, 3 = “sure, I answered incorrectly”. NBD: non-brain damaged; PWA: people with aphasia.
Figure 4. Predicted probability of the confidence rating on the comprehension accuracy, illustrated by the sensitivity (i.e., true positive rate) against 1-specificity (i.e., false positive rate).
NBD: non-brain damaged; PWA: people with aphasia. The area under the ROC curve (AUC) is a measure of how well confidence ratings can distinguish between correctly and incorrectly answered trials.
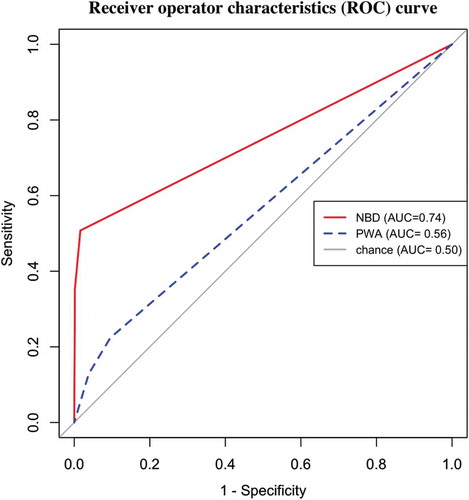
Figure 5. Fixation pattern of PWA across the visual display along the presentation of the auditory stimuli.
The gaze data is presented as a function of response accuracy (correct, incorrect) and confidence rate (1, 2, 3). Confidence rate, 1 = “sure, I answered correctly”, 2 = “I do not know, guessing”, 3 = “sure, I answered incorrectly”. Values above .5 indicate more fixations into the target picture, whereas values below .5 indicate more fixations into the foil picture.
Table 6. Comparison of proportion of gaze-fixations in between correctly and incorrectly answered trials across ROIs. Analysis of the gaze-data of people with aphasia as a function of confidence with which the trials were rated.
Table A1. Individual scores (%) in the sentence–picture matching task attending to group and argument order.