Figures & data
Figure 1. Included participants from studies one and two (n = 175).
Table 1. Demographic and clinical characteristics of the two study samples (n = 175).
Table 2. Demographic and clinical characteristics of the study sample by patterns of fear avoidance behavior after traumatic brain injury (FAB-TBI) scores at times 1 and 2 (n = 175).
Table 3. Baseline variables and return to work related activity 6–9 months after mild traumatic brain injury (n = 175).
Figure 2. Fear avoidance scores between times 1 and 2, showing mean of the difference (middle line) and 95% agreement limits. (A larger positive difference means greater improvement in fear avoidance. FAB-TBI = Fear Avoidance Behavior after Traumatic Brain Injury questionnaire; RTW = return to usual levels of work-related activity 6–9 months after mild traumatic brain injury).
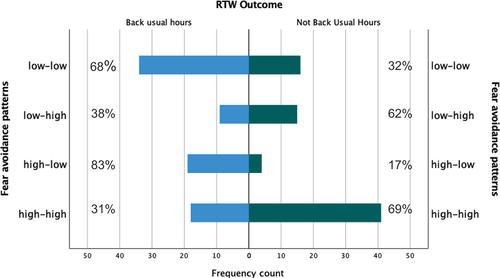
Figure 3. Frequency bar graph of return to work-related activity by patterns of fear avoidance between times 1 and 2. (RTW = return to usual levels of work-related activity).