
Figures & data
Table 1. Descriptive statistics of ultrasound time and sound production trials.
Figure 1. Treatment protocol for distortion of Finnish [r].
![Figure 1. Treatment protocol for distortion of Finnish [r].](/cms/asset/4f9bd588-be27-4d9f-b36d-aea25e94561e/iclp_a_2118079_f0001_oc.jpg)
Figure 2. Ultrasound images of children 1–4 labelled as C1–C4. /r/-sounds from the pre- and post-intervention measurements. Mid-sagittal view, the tip of the tongue on the right.
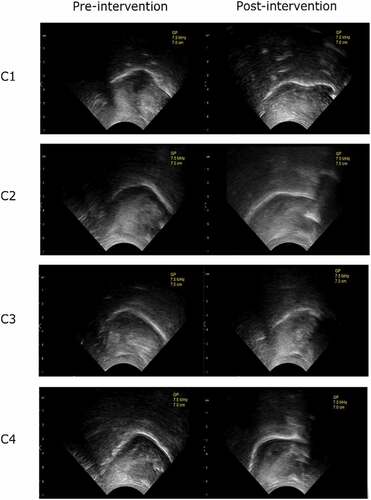
Figure 3. Illustration of the web-based application.
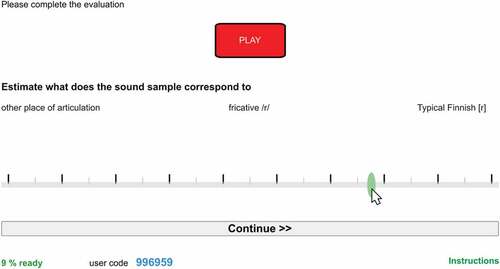
Figure 4. Violin box plot illustrating the distribution of the perceptual judgement data at pre- (blue) and post-intervention (red) in all children (on the left), and regression lines illustrating children’s judgement results across measurements.
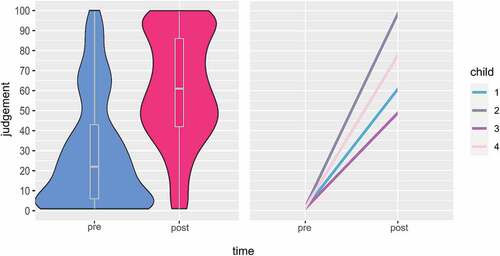
Figure 5. Estimates and significance level of fixed effects, *p < 0.05, ** p < 0.01, *** p < 0.001.
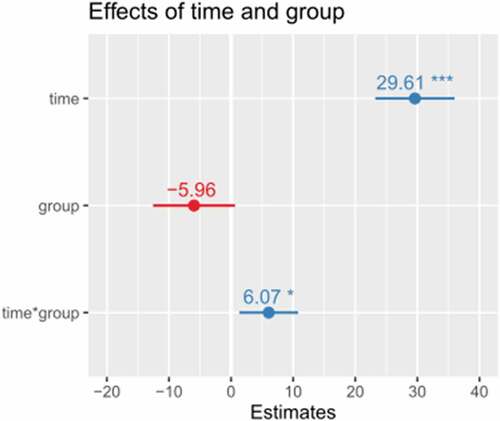
Table 2. Fixed effects for model predicting VAS judgement results.
Figure 6. The means of judgement results between the listener groups with 95% confidence.
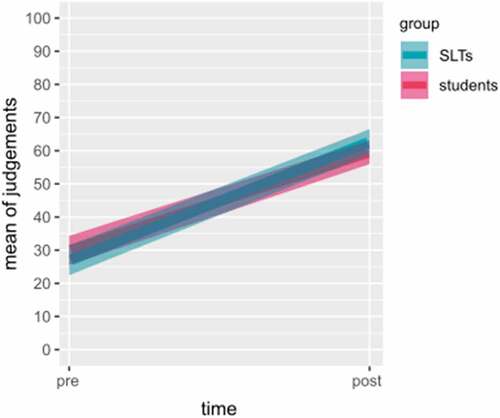
Table 3. ICC2 values, confidence interval (CI, 95%) and p-values.