
Figures & data
Figure 1. Study sites in the Gonokawa River in Japan.
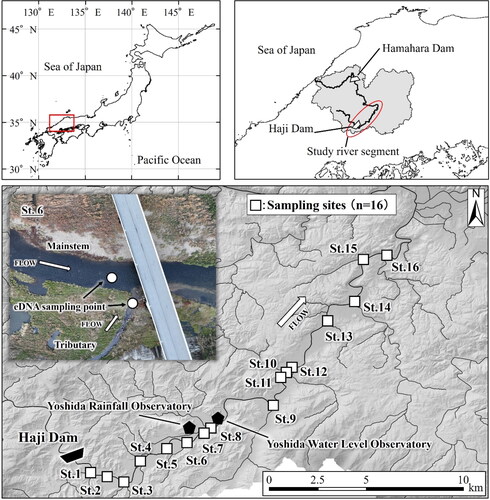
Figure 2. River discharge changes at the Yoshida water level observatory in the Gonokawa River in Japan in July–October 2021.
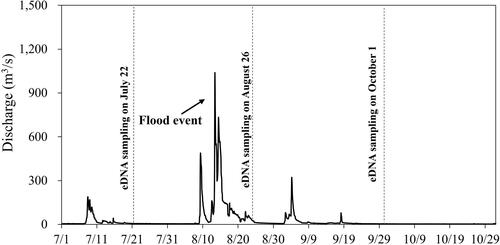
Figure 3. Ayu environmental DNA concentrations of mainstem and tributary sites in the Gonokawa River in July (a), August (b), and October (c) of 2021.
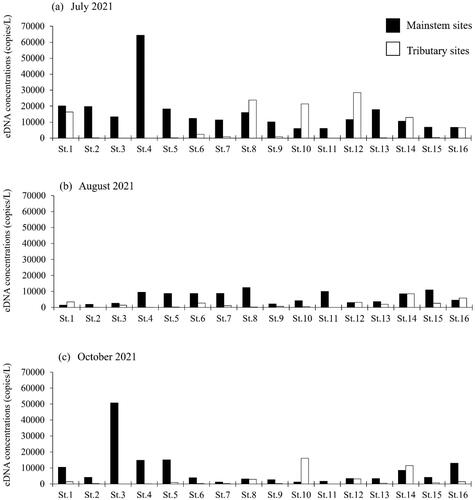
Figure 4. Relationships of Ayu environmental DNA concentrations to tributary discharge, width, and depth in the Gonokawa River in July, August, and October of 2021.
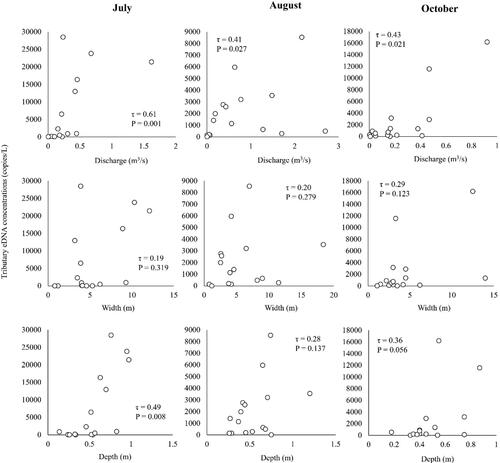
Figure 5. Ayu environmental DNA concentrations in the mainstem sites (a) and tributary sites (b) in the Gonokawa River in July, August, and October of 2021.
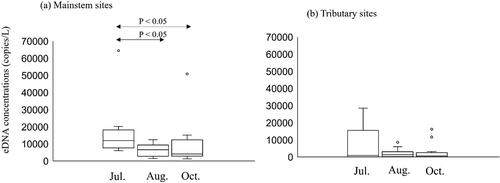
Figure 6. Relationships of temporal (July-August, August-October) absolute Ayu environmental DNA concentration differences (copies/L) to tributary discharge, width, and depth in the Gonokawa River.
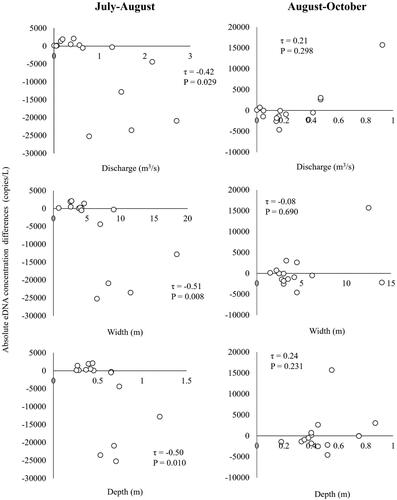
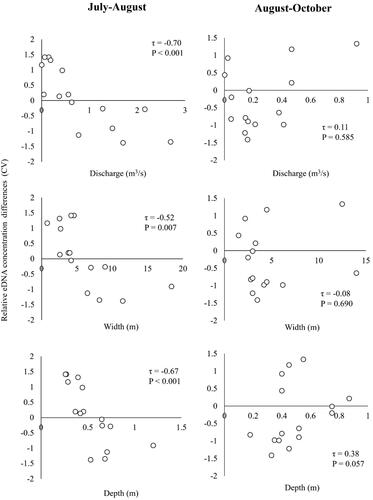
Figure 7. Relationships of temporal (July-August, August-October) relative Ayu environmental DNA concentration differences (CV) to tributary discharge, width, and depth in the Gonokawa River.
Supplemental Material
Download MS Excel (19 KB)Data availability statement
These data that support the findings of this study are available from the corresponding author upon request.