876
Views
10
CrossRef citations to date
0
Altmetric
Original Articles

A Toxicology Suite Adapted for Comparing Parallel Toxicity Responses of Model Human Lung Cells to Diesel Exhaust Particles and Their Extracts

, , , &
Pages 599-610 | Received 15 Jul 2014, Accepted 30 Apr 2015, Published online: 17 Jun 2015

Figures & data

FIG. 1. Response of A549 epithelial cells exposed to increasing concentrations of DEP (•) and its organic extract (○) as judged by Annexin V and propidium iodide staining. Error bars represent pooled standard deviation of three independent trials, each of which include a minimum of 104 cells analyzed. *Indicates significant differences at a 95% confidence level.
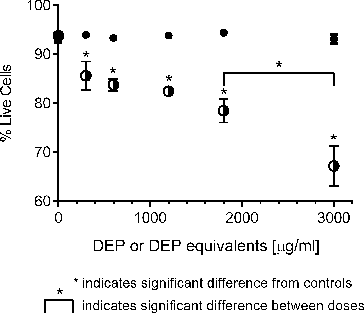
FIG. 1. Response of A549 epithelial cells exposed to increasing concentrations of DEP (•) and its organic extract (○) as judged by Annexin V and propidium iodide staining. Error bars represent pooled standard deviation of three independent trials, each of which include a minimum of 104 cells analyzed. *Indicates significant differences at a 95% confidence level.

FIG. 2. Flow cytometric analysis of apoptosis and necrosis in A549 cell populations as judged by Annexin and PI staining. Columns represent percent of cell population existing as live (□), apoptotic (▪), or necrotic (▪). Error bars represent pooled standard deviation of three independent trials; each includes a minimum of 104 cell analyzed. *Indicates significant differences at a 95% confidence level. (a) A549 cells after 24 h exposure to a range of DEP concentrations. (b) A549 cells after 24 h exposure to a range of DEP extract concentrations.
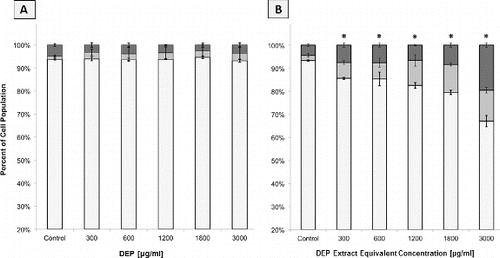
FIG. 2. Flow cytometric analysis of apoptosis and necrosis in A549 cell populations as judged by Annexin and PI staining. Columns represent percent of cell population existing as live (□), apoptotic (▪), or necrotic (▪). Error bars represent pooled standard deviation of three independent trials; each includes a minimum of 104 cell analyzed. *Indicates significant differences at a 95% confidence level. (a) A549 cells after 24 h exposure to a range of DEP concentrations. (b) A549 cells after 24 h exposure to a range of DEP extract concentrations.

FIG. 3. Response of GDM-1 immature macrophage cells exposed to increasing concentrations of DEP (▴) and its organic extract (Δ) as judged by Annexin V and propidium iodide staining. Error bars represent pooled standard deviation of three independent trials, each of which include a minimum of 104 cell analyzed. *Indicates significant differences at a 95% confidence level.
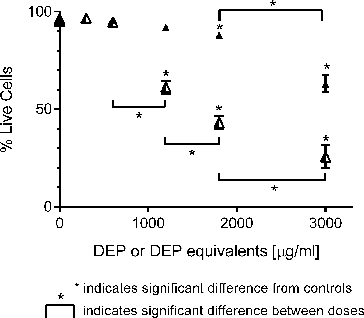
FIG. 3. Response of GDM-1 immature macrophage cells exposed to increasing concentrations of DEP (▴) and its organic extract (Δ) as judged by Annexin V and propidium iodide staining. Error bars represent pooled standard deviation of three independent trials, each of which include a minimum of 104 cell analyzed. *Indicates significant differences at a 95% confidence level.

FIG. 4. Flow cytometric analysis of apoptosis and necrosis in GDM-1 cell populations as judged by Annexin and PI staining. Columns represent percent of cell population existing as live (□), apoptotic (▪), or necrotic (▪). Error bars represent pooled standard deviation of three independent trials, each of which include a minimum of 104 cell analyzed. *Indicates significant differences at a 95% confidence level. (a) GDM-1 cells after 24 h exposure to a range of DEP concentrations. (b) GDM-1 cells after 24 h exposure to a range of DEP extract concentrations.
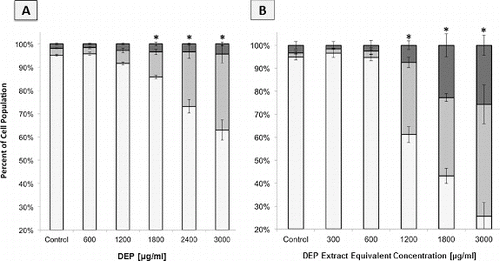
FIG. 4. Flow cytometric analysis of apoptosis and necrosis in GDM-1 cell populations as judged by Annexin and PI staining. Columns represent percent of cell population existing as live (□), apoptotic (▪), or necrotic (▪). Error bars represent pooled standard deviation of three independent trials, each of which include a minimum of 104 cell analyzed. *Indicates significant differences at a 95% confidence level. (a) GDM-1 cells after 24 h exposure to a range of DEP concentrations. (b) GDM-1 cells after 24 h exposure to a range of DEP extract concentrations.

FIG. 5. Flow cytometric analysis of A549 population cell cycle distributions based on DNA content histograms, following 24 h of exposure to DEP or extract. Columns represent percent of cell population in the following cell cycle phases: the sum of S+G2+Mitotic (▪) and G1 (▪). Error bars represent pooled standard deviation of three independent trials, each of which include a minimum of 104 cell analyzed. *Indicates significant differences at a 95% confidence level. (a) DNA content histogram following 24 h exposure to intact DEP. (b) DNA content histogram following 24 h exposure to DEP extract.
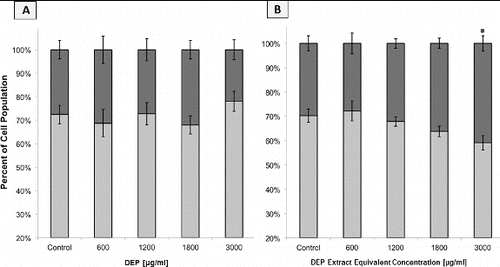
FIG. 5. Flow cytometric analysis of A549 population cell cycle distributions based on DNA content histograms, following 24 h of exposure to DEP or extract. Columns represent percent of cell population in the following cell cycle phases: the sum of S+G2+Mitotic (▪) and G1 (▪). Error bars represent pooled standard deviation of three independent trials, each of which include a minimum of 104 cell analyzed. *Indicates significant differences at a 95% confidence level. (a) DNA content histogram following 24 h exposure to intact DEP. (b) DNA content histogram following 24 h exposure to DEP extract.

FIG. 6. Flow cytometric analysis of GDM-1 population cell cycle distributions based on DNA content histograms. Columns represent percent of cell population in the following cell cycle phases: the sum of S+G2+Mitotic (▪) and G1 (▪). Error bars represent pooled standard deviation of three independent trials, each of which include a minimum of 104 cell analyzed. *Indicates significant differences at a 95% confidence level. (a) DNA historgrams following 24 h of exposure to DEP. (b) DNA historgrams following 24 h of exposure to DEP extracts.
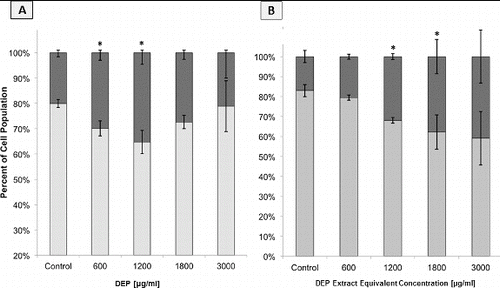
FIG. 6. Flow cytometric analysis of GDM-1 population cell cycle distributions based on DNA content histograms. Columns represent percent of cell population in the following cell cycle phases: the sum of S+G2+Mitotic (▪) and G1 (▪). Error bars represent pooled standard deviation of three independent trials, each of which include a minimum of 104 cell analyzed. *Indicates significant differences at a 95% confidence level. (a) DNA historgrams following 24 h of exposure to DEP. (b) DNA historgrams following 24 h of exposure to DEP extracts.

FIG. 7. Image of western blots showing p53 accumulation in cells exposed to DEP and DEP extracts at different concentrations, following 24 h exposures. Loading was normalized by nucleolin, and response was positively controlled by inducing DNA damage with 10 μM Nutlin (positive control). (a) A549 cells; (b) GDM-1 cells.
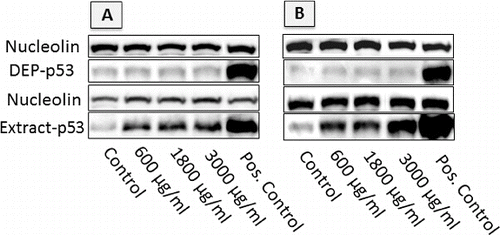
FIG. 7. Image of western blots showing p53 accumulation in cells exposed to DEP and DEP extracts at different concentrations, following 24 h exposures. Loading was normalized by nucleolin, and response was positively controlled by inducing DNA damage with 10 μM Nutlin (positive control). (a) A549 cells; (b) GDM-1 cells.

FIG. 8. Intracellular ROS response of cells exposed to increasing concentrations of DEP (□) and its organic extract as indicated by fluorescence intensity. Error bars represent pooled standard deviation of three independent trials, each of which include a minimum of 104 cell analyzed. *Indicates significant differences from respective controls at a 95% confidence level. (a) A549 cell responses; (b) GDM-1 cell responses.
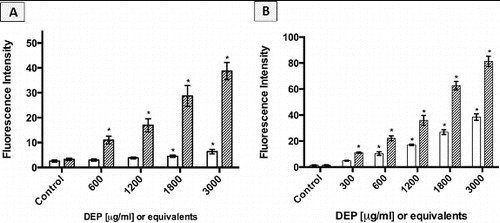
FIG. 8. Intracellular ROS response of cells exposed to increasing concentrations of DEP (□) and its organic extract as indicated by fluorescence intensity. Error bars represent pooled standard deviation of three independent trials, each of which include a minimum of 104 cell analyzed. *Indicates significant differences from respective controls at a 95% confidence level. (a) A549 cell responses; (b) GDM-1 cell responses.

Reprints and Corporate Permissions

Please note: Selecting permissions does not provide access to the full text of the article, please see our help page How do I view content?

To request a reprint or corporate permissions for this article, please click on the relevant link below:

Academic Permissions

Please note: Selecting permissions does not provide access to the full text of the article, please see our help page How do I view content?

Obtain permissions instantly via Rightslink by clicking on the button below:

If you are unable to obtain permissions via Rightslink, please complete and submit this Permissions form. For more information, please visit our Permissions help page.