
Figures & data
FIG. 1. Schematic of 28–30 April 2012 sampling system during SAMPLE III.2 campaign.
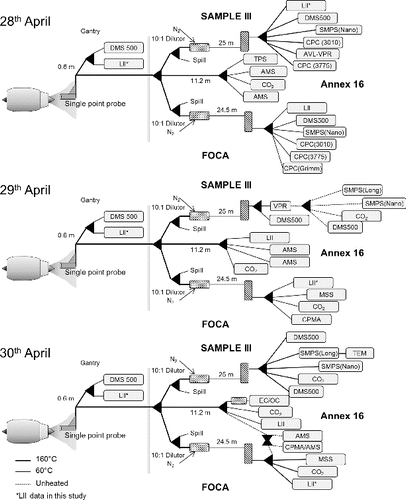
FIG. 2. TEM images of 15 nm, (a) and (b), and 50 nm, (c), mobility-selected soot aggregates.
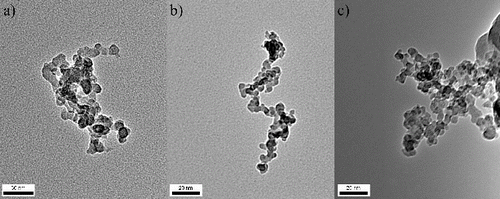
FIG. 3. Black carbon mass emission index, EI(BC), for CFM56-5B4-2P as measured by LII on three separate lines for various thrust settings. Error bars represent the 90% variability interval within a given thrust setting.
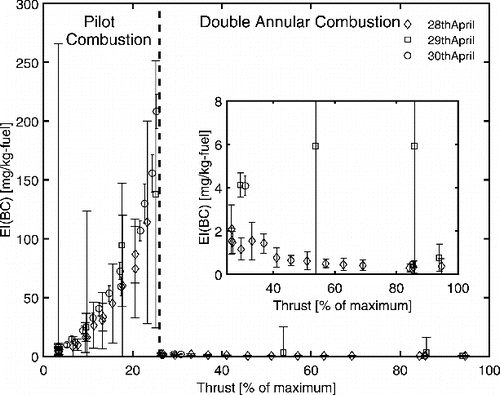
FIG. 4. Black carbon number emission index, EIn, for CFM56-5B4-2P as measured by CPCs with D50 cut points of 10 nm (open symbols) and 23 nm (cross and plus sign) on two separate lines (FOCA and SAMPLE III) for various thrust settings. The 90% variability was not significant and are omitted for legibility of symbols, but are shown in Figure S2.
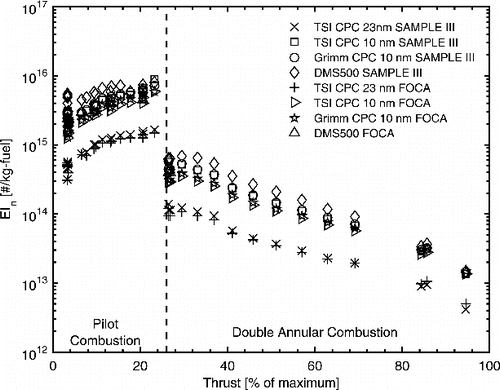
FIG. 5. Geometric mean diameter as measured by multiple mobility instruments over a range of engine thrusts. The measurements were taken from 28–30 April 2012 on lines as depicted in from different mobility instruments DMS500 (FOCA – asterisk, SAMPLE – triangle, Gantry – Circle), nanoSMPS (SAMPLE – diamond), and longSMPS (SAMPLE/FOCA – square). The inset shows the frequency distribution of the mean aggregate diameters for the DAC thrust settings. Error bars indicate the mean geometric standard deviation of the mobility distribution across all measurements within a given test condition.
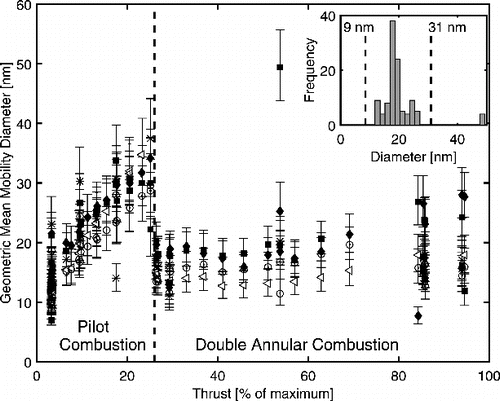
FIG. 6. Volume area equivalent primary particle diameter as a function of aggregate mobility diameter as measured by mass and mobility analysis. The gray lines correspond to the empirical fit with the power law form of Equation (Equation5[5] ) (R2 = 0.86) and a ±25% interval.
![FIG. 6. Volume area equivalent primary particle diameter as a function of aggregate mobility diameter as measured by mass and mobility analysis. The gray lines correspond to the empirical fit with the power law form of Equation (Equation5[5] ) (R2 = 0.86) and a ±25% interval.](/cms/asset/fd2e9579-b6d3-400c-981b-91f6786e3159/uast_a_1078452_f0006_b.gif)
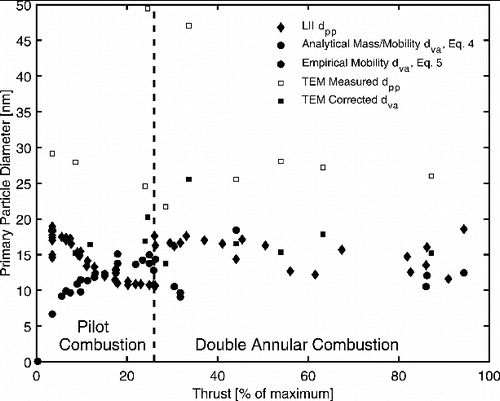
FIG. 7. Primary particle diameter as determined by TEM, which reports number mean dPP and dva; mass and mobility measurements, which report number mean; and LII, which represents an effective heat transfer primary particle diameter.
![FIG. 8. Aggregate specific surface area as determined by LII, and analytical (Equation (Equation4[4] )) and empirical (Equation (Equation5[5] )) mass and mobility relationships as defined in Equation (Equation6[6] ).](/cms/asset/ddd24b29-aea0-48fd-b1d2-90c4eaa2adf3/uast_a_1078452_f0008_b.gif)