
Figures & data
Figure 1. Experimental setup for a local biological response on the right hindleg of mice. Schematics of the water phantom from a top-down view (A) with three black tubes containing mice positioned on top of a movable plastic plate and from the beam direction (B) with mice feet positioned in the proton field and bodies shielded by brass. (C) Top-down view of the experimental setup with mice and brass and (D) mouse jig with mouse and glued right hindlimb.
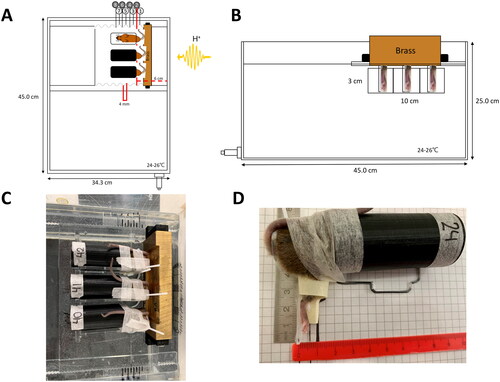
Table 1. Categorical analysis tables for 1) acute skin damage scoring table and 2) RILD flexibility scoring table.
Table 2. SHIELD-HIT12A MC calculated relative dose, dose-averaged LET, and track- and dose-averaged Qeff for the eight nominal mouse leg positions.
Figure 2. Dose–response curves for (A) acute skin damage and late-induced late damage (RILD) after (B) 6 months, (C) 9 months, and (D) 12 months for each endpoint severity score where the highest score is the most severe cases. It depicts the percentage of mice (46 Gy, n = 5; 22 Gy, 25 Gy, and 45 Gy, n = 6; 26 Gy, n = 10; 27 Gy, 29 Gy, 31 Gy, 32 Gy, 33 Gy, and 35 Gy, n = 12; 38 Gy and 42 Gy, n = 24) with acute skin damage or RILD as a function of dose. The ED50 (effective dose at 50% responders) with 95% confidence intervals are indicated on each graph. The symbol punctuation on the curves indicates the percentage of mice with a respective score, and the curves are fitted with simple logistic regression.
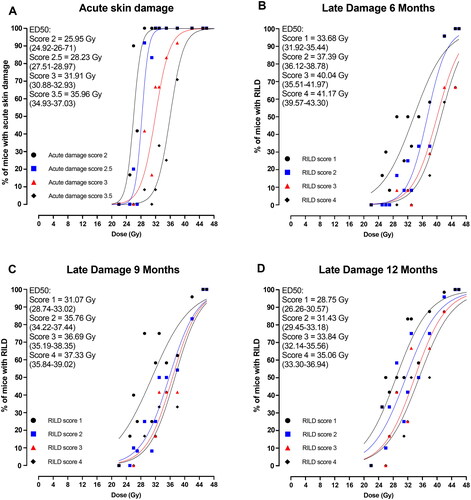
Figure 3. Development of endpoints as a function of time. (A) Median skin score on mice feet for each radiation dose as a function of days until day 30 after treatment. (B) The median radiation-induced late damage (RILD) scores for 22 Gy (n = 6), 31 Gy and 35 Gy (n = 12), 38 Gy and 42 Gy (n = 24), and 45 Gy (n = 6) were analyzed for 12 months after treatment.
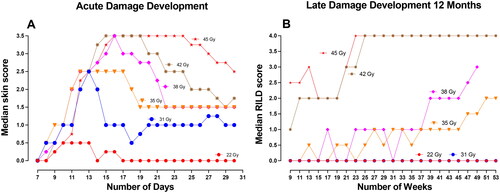
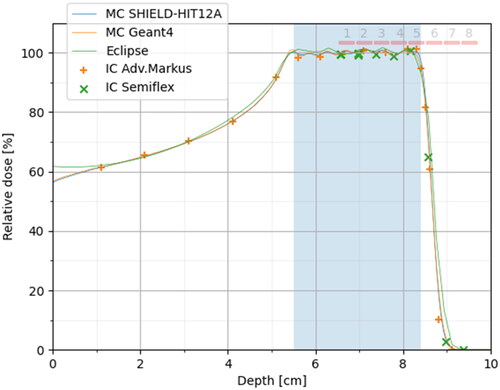
Figure 4. Relative dose measurements compared to SHIELD-HIT12A MC simulations. The measurements are based on absolute dose measurements, as described in the results section, but for this plot, the IC data are normalized to 100% PTV dose (by scaling the Semiflex data by 0.8% and Adv. Markus data by 2.0%). Furthermore, the Semiflex data points are displaced by 1.25 mm upstream to compensate for the shift of the effective measurement point introduced by the cylindrical shape of the air-filled cavity. The eight nominal mice positions are shown as red bars over the SOBP and its distal edge.
Supplemental Material
Download PDF (66.5 KB)Supplemental Material
Download PDF (3.8 MB)Supplemental Material
Download MS Word (16.5 KB)Supplemental Material
Download MS Word (19.6 KB)Data availability statement
The biological raw data is available on request.
The Monte Carlo Simulations are available on:
https://github.com/APTG/2022_DCPT_MICE
A CAD-file outlining the water phantom dimension in detail is provided.