671
Views
1
CrossRef citations to date
0
Altmetric
Original Articles: BiGART 2023 Issue

Importance of tumor volume, overall treatment time and fractionation sensitivity for p16-positive and p16-negative oropharyngeal tumors

ORCID Icon, & ORCID Icon
Pages 1375-1383 | Received 25 May 2023, Accepted 18 Aug 2023, Published online: 08 Sep 2023

Figures & data

Figure 1. Fit of the TCP-model parameters c (red, dotted line), α, β (α/β-ratio, solid black line), γ (blue, dashed line) in Equation 2 for different values of A (x-axis). Green line denotes the residual sum of squares from the fit. In (a) the p16-cohort of 433 patients and in (b) the corresponding p16-negative cohort of 90 patients (with a fixed α/β-ratio).

Figure 1. Fit of the TCP-model parameters c (red, dotted line), α, β (α/β-ratio, solid black line), γ (blue, dashed line) in Equation 2 for different values of A (x-axis). Green line denotes the residual sum of squares from the fit. In (a) the p16-cohort of 433 patients and in (b) the corresponding p16-negative cohort of 90 patients (with a fixed α/β-ratio).

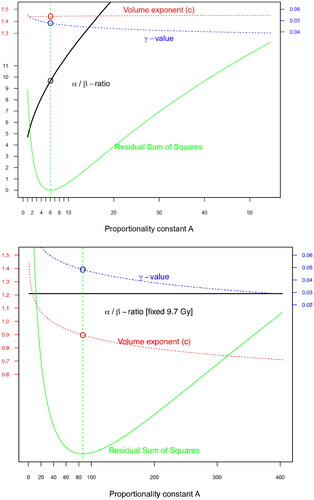
Table 1. Fitted parameters in Equation 2.

Figure 2. Estimated probability of local failure using the TCP-model in Equation 2, incorporating primary tumor volume (x-axis), fractionation schedule (black, red and blue) and overall treatment time for the individual patients. Model predictions for p16-negative (darkgreen dotted lines) and p16-positive (dashed line) tumors treated with 68.0 Gy/34 fractions over 47 days are shown, as well as outcome for the actual patients (p16-positive tumor without failure (+), p16-positive tumor with failure (triangles), p16-negative tumor without failure (empty circles), p16-negative tumor with failure (filled circles)). horizontal bars denote the proportion of patients with failure, grouped per 20 cm3, with 95% confidence interval (vertical lines) for p16-positive (black, longer bars, filled error lines) and p16-negative (darkgreen, shorter bars, dot-dashed lines).

Figure 2. Estimated probability of local failure using the TCP-model in Equation 2, incorporating primary tumor volume (x-axis), fractionation schedule (black, red and blue) and overall treatment time for the individual patients. Model predictions for p16-negative (darkgreen dotted lines) and p16-positive (dashed line) tumors treated with 68.0 Gy/34 fractions over 47 days are shown, as well as outcome for the actual patients (p16-positive tumor without failure (+), p16-positive tumor with failure (triangles), p16-negative tumor without failure (empty circles), p16-negative tumor with failure (filled circles)). horizontal bars denote the proportion of patients with failure, grouped per 20 cm3, with 95% confidence interval (vertical lines) for p16-positive (black, longer bars, filled error lines) and p16-negative (darkgreen, shorter bars, dot-dashed lines).

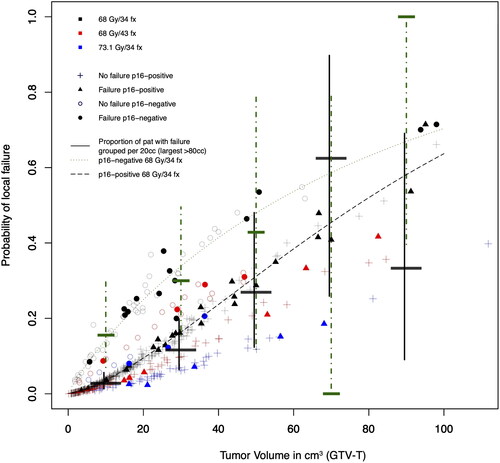
Table 2. Multivariable Cox-Regression for patients with p16-positive and p16-negative tumors. Primary tumor volume (GTV-T) was log2-transformed and included as continuous parameter.

Supplemental material

Supplemental Material

Download MS Word (241.1 KB)