
Figures & data
Figure 1. Particle fluence for all particles in the range 0.01 to 100% (normalized to maximum fluence in the tumor) for the CSI patient in the treatment room. The pediatric patient is situated in the gantry and the three positions for the parent in the treatment room are indicated (1: 1 m, 2: 3 m and 3: 3 m). The black line separating the patient and parent is the section sampling the phase space.
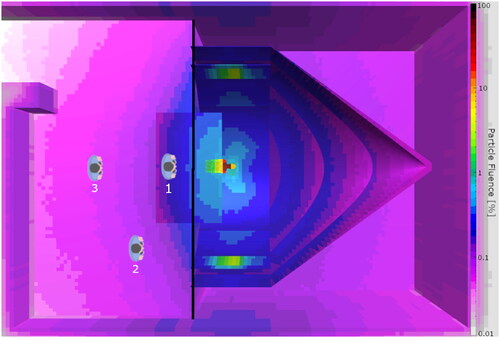
Figure 2. Neutron spectra (upper panel) and photon spectra (lower panel) for the brain tumor patient (blue lines) and CSI patient (orange lines). the spectra are calculated from the phase space energies collected during the simulations. All spectra are normalized such that the area under the curve equals to 1.
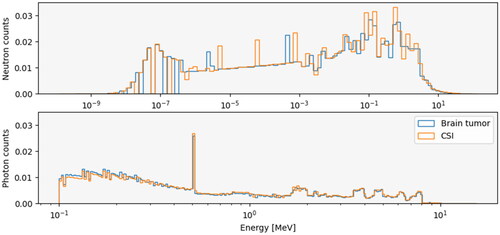
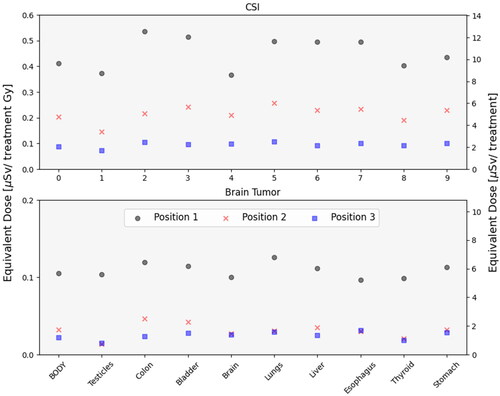
Figure 3. Organ mean equivalent dose received per treatment Gy for different organs and the whole-body of the CSI parent (upper panel) and brain tumor parent (lower panel). the upper panel is dose received for the CSI patient and the lower panel is for the brain tumor. In position 1 the parent is located 1 m from the iso-center (black circles), in position 2 at 45grader 3 m from the iso-center (red crosses) and in position 3 at a 3 m distance from the iso-center (blue squares).
Data availability statement
The data that support the findings of this study are available from the corresponding author, JT, upon reasonable request.