
Figures & data
Table 1. DSC and MSD for 12 OARs contoured by AI oncologists, respectively.
Figure 1. Box plot with individual samples overlaid showing the DSC for the 12 OARs. Green boxes and samples show the DSC for the AI contours, and blue boxes and samples are results comparing oncologist contours. The raw data points are shown to visualise the distribution.
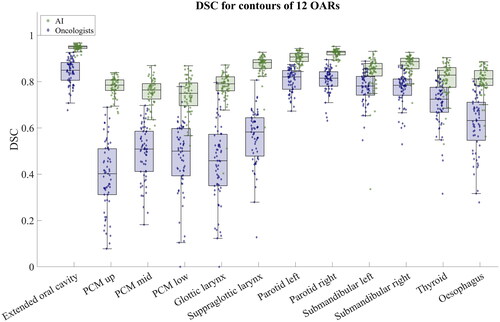
Figure 2. Box plot with individual samples overlaid showing the MSD for the 12 OARs. Green boxes and samples show the MSD for the AI contours, and blue boxes and samples are results comparing oncologist contours. The raw data points are shown to visualise the distribution. For visualisation, the plot has been scaled, omitting two outliers from oesophagus and one from glottic larynx for oncologist contours.
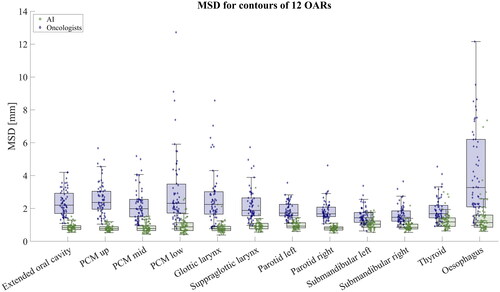
Figure 3. Scatter plot of the local ΔNTCP () and clinical ΔNTCP (
) based on AI (green data points) and oncologist (blue data points) contours, respectively, for xerostomia and dysphagia.
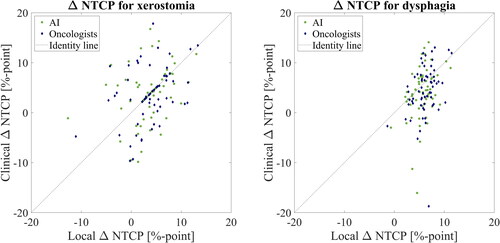
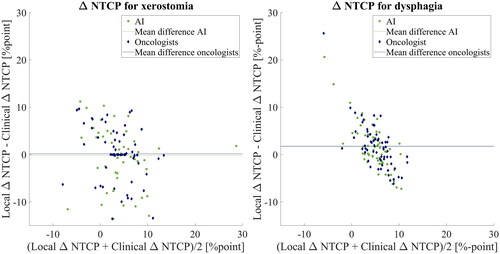
Figure 4. Bland-Altman plot showing the mean and difference between the local and clinical NTCP for xerostomia and dysphagia. The green data points represent the
NTCP based on AI contours, and the blue data points represent the
NTCP calculated based on oncologist contours.
Supplemental Material
Download MS Word (122.7 KB)Data availability statement
The data used in this study are part of a clinical trial and are not available.