
Figures & data
Figure 1. CBCT (a), synthetic CT (sCT) (b) and corrected sCT (sCTcorr) (c) of patient #1. GTV and CTV are displayed in red and Pink, respectively, and added water and air structures are displayed in blue and turquoise on c). the red arrow points at a part of the CTV that was contoured in air on the CBCT (a). the corresponding area on the sCT presents with tissue instead of air (b), which is corrected on the sCTcorr (c).

Figure 2. Difference in dose metrics between the adapted and original plans obtained at each treatment fraction. The median dose difference for each patient and dose metric is represented by short horizontal lines in the graph, and significant differences are displayed at the x-axis labels with * for p < 0.05 and ** for p < 0.001. Treatment fractions where the adapted plan was chosen for treatment are shown with filled black dots.
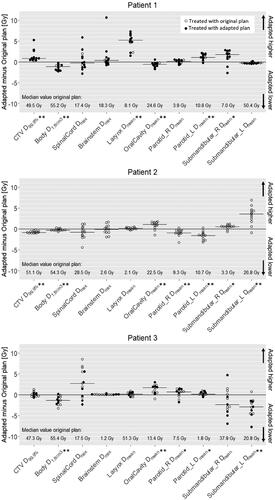
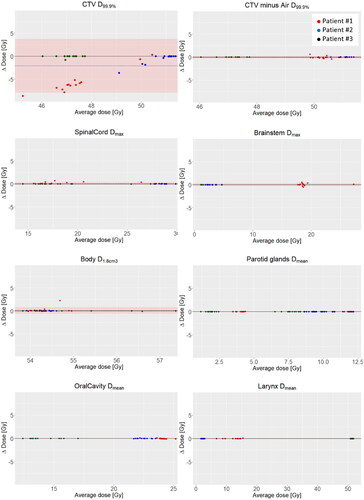
Figure 3. Bland-Altman Plot of the difference between dose calculated on the corrected sCT and the sCT of the vendor. The underdosage of the CTV (top left) was eradicated when parts of the CTV contoured in air were excluded (top right).
Supplemental Material
Download JPEG Image (259.7 KB)
Supplemental Material
Download GIF Image (480.2 KB)
Data availability statement
Data not available due to ethical/legal restrictions