
Figures & data
Table 1. Re-irradiation of DMG.
Figure 1. The individual DVHs for two organs at risk (OAR), one OAR close to (brainstem) and one OAR (left eye) far from the CTV. The colours represent the individual patients. The y-axis is percentage of irradiated volume, and the x-axis is the absolute dose in gray (Gy). The dashed line represents the median DVH of all patients. (a) Dose to the brainstem from course 1, (b) dose to the brainstem from course 2. (c) Dose to the left eye from course 1. (d) Dose to the left eye from course 2. This figure shows how OAR close to the CTV received a high dose to a large volume compared to OAR further away from the CTV.
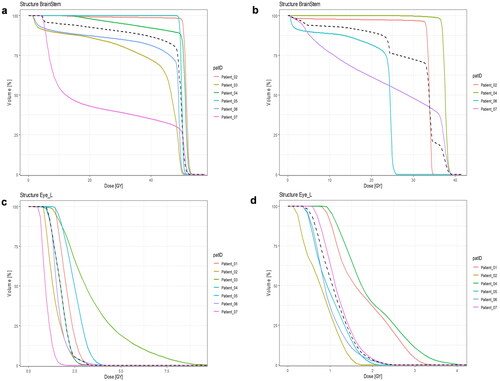
Figure 2. EQD2 dose (Gy), each dot represents a patient and each colours represents a structure in the brain defined as an OAR. The colour code is shown in the legend. The dashed red line is equal to 60 Gy and represents the DNOG recommended Dmax to the brainstem, chiasm, and optic nerves [Citation9].
![Figure 2. EQD2 dose (Gy), each dot represents a patient and each colours represents a structure in the brain defined as an OAR. The colour code is shown in the legend. The dashed red line is equal to 60 Gy and represents the DNOG recommended Dmax to the brainstem, chiasm, and optic nerves [Citation9].](/cms/asset/6a67c4b1-8067-43db-a31a-d5aafd7316e1/ionc_a_2258271_f0002_c.jpg)
Supplemental Material
Download MS Word (11.8 KB)Supplemental Material
Download PDF (250.2 KB)Supplemental Material
Download Zip (459.5 KB)Supplemental Material
Download JPEG Image (160 KB)
Supplemental Material
Download MS Word (12.8 KB)Data availability statement
Data not available due to ethical/legal restrictions.