
Figures & data
Figure 1. Flow chart of literature retrieval and selection (CNKI: China National Knowledge Infrastructure; Wan Fang: Wan Fang Data Knowledge Service Platform).
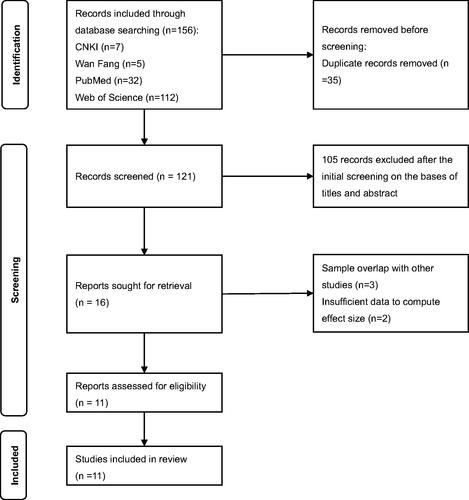
Figure 2. Quality assessment of included articles based on STROBE Statement (A) Each included study was evaluated for quality and scored according to the STROBE statement. (B) Item evaluations in STROBE statement are presented as percentages across all included studies. A: Present key elements of study design early in the paper. B: Describe the setting, locations, and relevant dates, including periods of recruitment, exposure, follow-up and data collection. C: Cohort study—Give the eligibility criteria, and the sources and methods of selection of participants. Describe methods of follow-up. Case-control study—Give the eligibility criteria, and the sources and methods of case ascertainment and control selection. Give the rationale for the choice of cases and controls. Cross-sectional study—Give the eligibility criteria, and the sources and methods of selection of participants. D: Clearly define all outcomes, exposures, potential confounders and give diagnostic criteria, if applicable. E: For each variable of interest, give sources of data and details of methods of assessment (measurement). F: Describe any efforts to address potential sources of bias. G: Explain how the study size was arrived at. H: Explain how quantitative variables were handled in the analyses. If applicable, describe which groupings were chosen, and why. I: Describe all statistical methods, including those used to control for confounding. J: Explain how missing data were addressed. K: Cohort study—If applicable, explain how loss to follow-up was addressed. Case-control study—If applicable, explain how matching of cases and controls was addressed. Cross-sectional study—If applicable, describe analytical methods taking account of sampling strategy. L: Describe any sensitivity analyses.
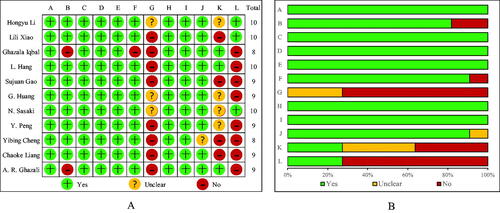
Figure 3. Association between cognition assessment scores and Cd levels. * Continuous log-transformed Cd levels. Covariates in the study of Hongyu Li et al. are: age, gender, ethnicity, education, poverty–income ratio, marital status, alcohol consumption, diabetes, hypertension, stroke and coronary heart disease. Covariates in the study of Lili Xiao et al. are: gender, age, education, annual income, BMI, cigarette smoking, alcohol drinking, insomnia, and physical activity, Ca, Ti, V, Cu, Zn, As, Se, Rb, Mo, Cd, Ba, and Pb. Covariates in the study of N. Sasaki et al. are: age, sex, race/ethnicity, education level, depression, diabetes, cigarette smoking, and alcohol consumption. Covariates in the study of Yibin Cheng et al. are: gender, age, education level, whether to watch TV or listen to the radio, BMI.
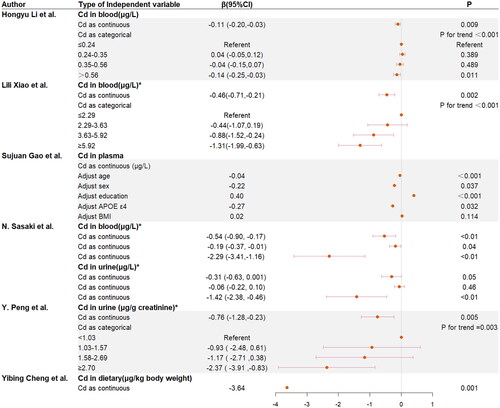
Figure 4. Logistic regression between cognition decline, low cognitive performance or cognitive impairment and Cd levels. * Continuous log-transformed Cd levels. Covariates in the study of L. Hang et al. are: age, gender, marriage status, house holding status, education, APOE genotype, BMI, smoking, alcohol consumption, T2DM, HBP, HTC, HTG, LHDLC and HLDLC. Covariates in the study of G. Huang et al. are: age, gender, BMI, race, marital status, educational level, annual household income, drinking, work activity, recreational activities, depression, hypertension, diabetes, stroke, CHF, heart attack, TC, GHb, 25(OH)D. Covariates in the study of Y. Peng et al. are: age, BMI, education level, household income, and tobacco smoking.
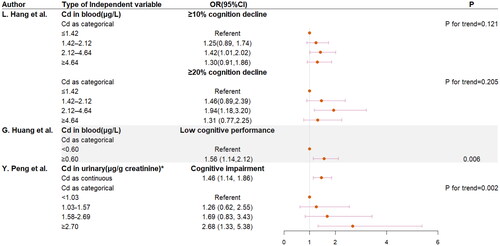
Figure 5. Correlation between cognition assessment scores and Cd levels. Covariates in the study of C. L. Emsley et al. are: gender, age, education.
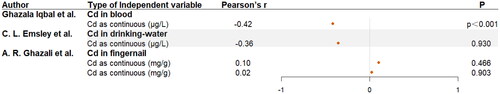
Table A1. Search strategy in PubMed (up to April 25, 2022).
Table A2. Characteristics of included studies.
Table A3. Assessment methods of cognition in the included studies.
Table A4. List of outcome measures extracted from included studies.
Data availability statement
Data sharing is not applicable to this article as no new data were created or analysed in this study.