
Figures & data
Table 1. Particle aerodynamic diameters and size distributions of asbestos-containing BD samples with the aerosolisation of the respirable fractions, determined with Aerodynamic Particle Sizer Spectrometer and DustTrak DRX.
Figure 1. Representative SEM micrograph and EDX spectrum of pristine samples, including three bulk break debris (BD) samples, three respirable BD samples, UICC chrysotile B asbestos, amosite asbestos, and MMVF10.
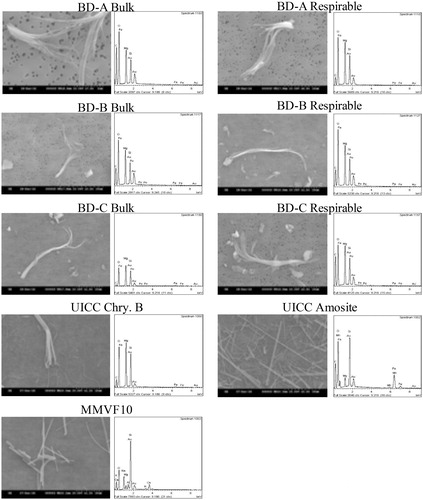
Table 2. Geometric analysis of chrysotile-containing BD samples before and after isolation of respirable fraction.
Figure 2. Mass recovery, in percent, of (A) asbestos-containing break debris (BD-A, BDB, and BD-C), and (B) chrysotile, amosite and MMVF10, after incubation in ALF for 0–168 days. The data are expressed as mean ± SD of four replicates. Statistical significance is shown for p < 0.05 (*), p < 0.01 (**), p < 0.005 (***), and p < 0.001 (****) for BD-A/chrysotile, p < 0.05 (∧) and p < 0.01 (∧∧) for BD-B, or p < 0.05 with (±), p < 0.005 (±±±), and p < 0.001 (±±±±) for BD-C/MMVF10.
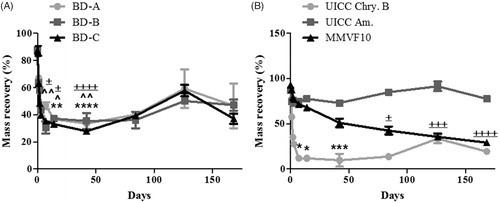
Figure 3. Quantification of Si (A and B), Fe (C and D), and Mg (E and F) in effluent fluid released from asbestos-containing BD (A, C, and E) and chrysotile, amosite, and MMVF10 (B, D, and F) after incubation in ALD for 0–168 days. The data are expressed as μg solute per liter of fluid.
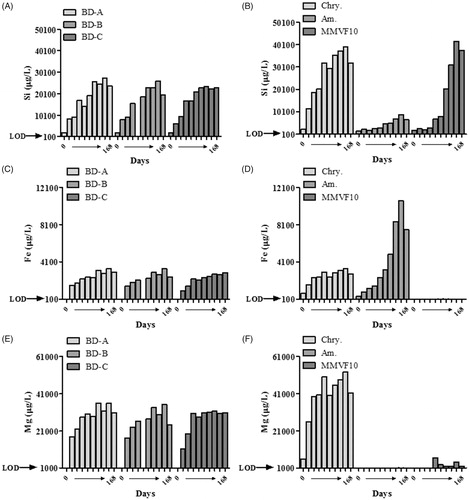
Table 3. Dissolution rates of three asbestos-containing BD and references samples incubated in ALF from 0 to 168 days.
Figure 4. TEM micrographs of asbestos-containing BD prior to incubation in ALF and after 168 days incubation in ALF.
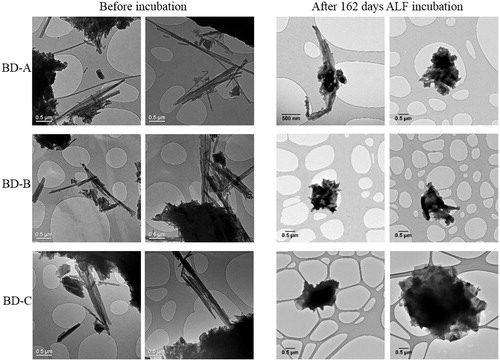
Figure 5. Cytotoxicity analysis of respirable brake debris particles in relation to UICC chrysotile B asbestos fibers. Data are expressed as mean ± SD of four independent replicates. ***p < 0.001 vs. vehicle control, ###p < 0.001 vs. UICC chrysotile B.
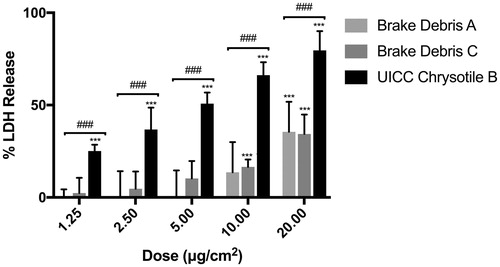
Figure 6. Electron micrographs of differentiated THP-1 macrophages incubated with brake debris (a–f) or UICC chrysotile B asbestos (g–l). The asterisk (*) indicates particulate brake debris while the white chevron indicates chrysotile fibers or fragments.
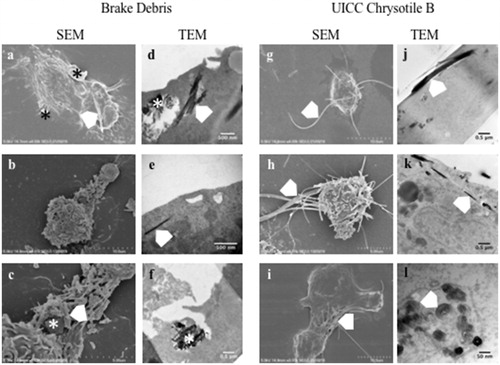
Figure 7. Representative images of differentiated THP-1 macrophages treated with and (a) vehicle control, (b) 2.5 μg/cm2 of UICC chrysotile B, or (c) Brake debris. Image (a) shows the normal cellular appearance of an activated macrophage with no particulates. The white chevrons on image (b) show the presence of a long chrysotile fiber which penetrates two macrophages. Image C shows the presence of a short chrysotile fragment (white chevron) fully internalized by a macrophage as well as the presence of resin matrix held within a large vacuole (*). All images at ×100 magnification.
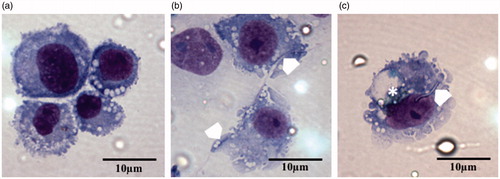
Table 4. Particle/fiber uptake by THP-1 macrophage-type cells (N = 3).