
Figures & data
Figure 1. Comparison of the inhaled exposure concentrations of chemical X for different scenarios with the same total dose inhaled daily of 200 mg: smoking (20 cigarettes per day, 10 µg of chemical X/cigarette; a worker (8 hour exposure per day; inhalation rate of 10 m3 per 8 hour); a member of the general population (24 hour exposure per day; inhalation rate: 20 m3 per day). Only the first hour of exposure is shown. See text for additional details about the smoking scenario.
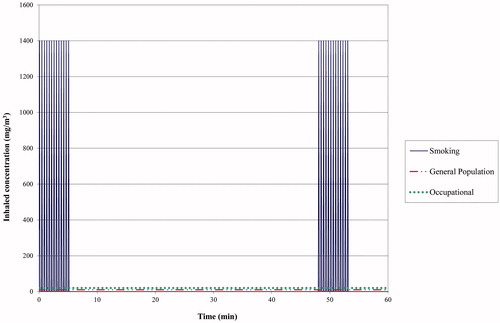
Table 1. Default parameter values for the exposure estimation during smoking.
Table 2. Inhaled concentrations for three scenarios (occupational, general population, smoking) starting from the same total inhaled dose of 200 mg of a fictive chemical X per day.
Figure 2. Simulations of alveolar air concentrations of a cigarette smoke component during the smoking of one cigarette in two scenarios, one with a substantial alveolar absorption (i.e. 80%) (pink curve) and one with low alveolar absorption (i.e. 15%) (green curve). Alveolar concentrations are expressed relative to the initial alveolar concentration after the first puff.
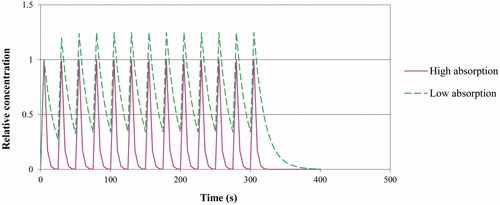
Figure 3. Stepwise, pragmatic approach for the risk assessment of individual components in tobacco smoke and e-cigarette aerosols.
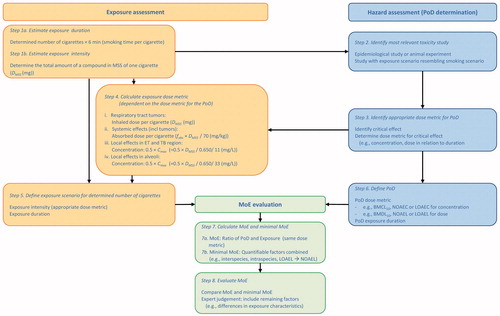
Table 3. Summary table for MoE calculation and evaluation for glycerol.
Table 4. Summary table for MoE calculation and evaluation for benzene.