903
Views
17
CrossRef citations to date
0
Altmetric
Food & Nutrition Science

Effects of deer bone extract on the expression of pro-inflammatory cytokine and cartilage-related genes in monosodium iodoacetate-induced osteoarthritic rats

, , , , , & show all
Pages 1703-1709 | Received 09 Nov 2013, Accepted 22 Apr 2014, Published online: 26 Jun 2014

Figures & data

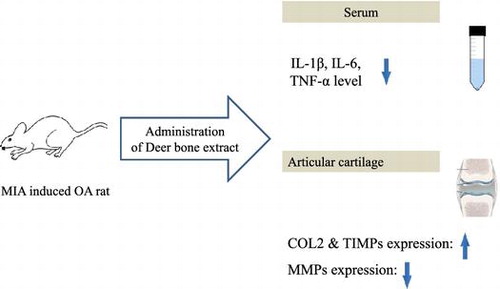
Table 1. Contents of components in deer bone extract.

Table 2. Body and organ weights of the MIA-induced OA rats treated with deer bone extract for 50 days.

Fig. 1. IL-1β (A) and IL-6 (B) levels in serum of the MIA-induced OA rats treated with deer bone extract for 50 days.

Note: Values are mean ± SD. Differences between groups (10 rats/group) were analyzed using one-way ANOVA by Tukey’s multiple range tests. Means with different superscript letters are significantly different at p < 0.05. Each group was assigned as follows: SC (PBS injection + non-treatment); NC (MIA injection + non-treatment); PC (MIA injection + 125 mg/kg glucosamine sulfate + 125 mg/kg chondroitin sulfate); LDB (MIA injection + 250 mg/kg deer bone extract); HDB (MIA injection + 500 mg/kg deer bone extract).

Fig. 1. IL-1β (A) and IL-6 (B) levels in serum of the MIA-induced OA rats treated with deer bone extract for 50 days.Note: Values are mean ± SD. Differences between groups (10 rats/group) were analyzed using one-way ANOVA by Tukey’s multiple range tests. Means with different superscript letters are significantly different at p < 0.05. Each group was assigned as follows: SC (PBS injection + non-treatment); NC (MIA injection + non-treatment); PC (MIA injection + 125 mg/kg glucosamine sulfate + 125 mg/kg chondroitin sulfate); LDB (MIA injection + 250 mg/kg deer bone extract); HDB (MIA injection + 500 mg/kg deer bone extract).

Fig. 2. TNF-α level in serum of the MIA-induced OA rats treated with deer bone extract for 50 days.

Note: Values are mean ± SD. Differences between groups (10 rats/group) were analyzed using one-way ANOVA by Tukey’s multiple range tests. Means with different superscript letters are significantly different at p < 0.05. Each group was assigned as follows: SC (PBS injection + non-treatment); NC (MIA injection + non-treatment); PC (MIA injection + 125 mg/kg glucosamine sulfate + 125 mg/kg chondroitin sulfate); LDB (MIA injection + 250 mg/kg deer bone extract); HDB (MIA injection + 500 mg/kg deer bone extract).

Fig. 2. TNF-α level in serum of the MIA-induced OA rats treated with deer bone extract for 50 days.Note: Values are mean ± SD. Differences between groups (10 rats/group) were analyzed using one-way ANOVA by Tukey’s multiple range tests. Means with different superscript letters are significantly different at p < 0.05. Each group was assigned as follows: SC (PBS injection + non-treatment); NC (MIA injection + non-treatment); PC (MIA injection + 125 mg/kg glucosamine sulfate + 125 mg/kg chondroitin sulfate); LDB (MIA injection + 250 mg/kg deer bone extract); HDB (MIA injection + 500 mg/kg deer bone extract).

Fig. 3. COL2 mRNA expression in articular cartilage of the MIA-induced OA rats treated with deer bone extract for 50 days.

Note: Values are mean ± SD. Differences between groups (10 rats/group) were analyzed using one-way ANOVA by Tukey’s multiple range tests. Means with different superscript letters are significantly different at p < 0.05. Each group was assigned as follows: SC (PBS injection + non-treatment); NC (MIA injection + non-treatment); PC (MIA injection + 125 mg/kg glucosamine sulfate + 125 mg/kg chondroitin sulfate); LDB (MIA injection + 250 mg/kg deer bone extract); HDB (MIA injection + 500 mg/kg deer bone extract).

Fig. 3. COL2 mRNA expression in articular cartilage of the MIA-induced OA rats treated with deer bone extract for 50 days.Note: Values are mean ± SD. Differences between groups (10 rats/group) were analyzed using one-way ANOVA by Tukey’s multiple range tests. Means with different superscript letters are significantly different at p < 0.05. Each group was assigned as follows: SC (PBS injection + non-treatment); NC (MIA injection + non-treatment); PC (MIA injection + 125 mg/kg glucosamine sulfate + 125 mg/kg chondroitin sulfate); LDB (MIA injection + 250 mg/kg deer bone extract); HDB (MIA injection + 500 mg/kg deer bone extract).

Fig. 4. COL2 mRNA expression in articular cartilage of the MIA-induced OA rats treated with deer bone extract for 50 days.

Note: Values are mean ± SD. Differences between groups (10 rats/group) were analyzed using one-way ANOVA by Tukey’s multiple range tests. Means with different superscript letters are significantly different at p < 0.05. Each group was assigned as follows: SC (PBS injection + non-treatment); NC (MIA injection + non-treatment); PC (MIA injection + 125 mg/kg glucosamine sulfate + 125 mg/kg chondroitin sulfate); LDB (MIA injection + 250 mg/kg deer bone extract); HDB (MIA injection + 500 mg/kg deer bone extract).

Fig. 4. COL2 mRNA expression in articular cartilage of the MIA-induced OA rats treated with deer bone extract for 50 days.Note: Values are mean ± SD. Differences between groups (10 rats/group) were analyzed using one-way ANOVA by Tukey’s multiple range tests. Means with different superscript letters are significantly different at p < 0.05. Each group was assigned as follows: SC (PBS injection + non-treatment); NC (MIA injection + non-treatment); PC (MIA injection + 125 mg/kg glucosamine sulfate + 125 mg/kg chondroitin sulfate); LDB (MIA injection + 250 mg/kg deer bone extract); HDB (MIA injection + 500 mg/kg deer bone extract).

Fig. 5. TIMPs mRNA expression in articular cartilage of the MIA-induced OA rats treated with deer bone extract for 50 days.

Note: Values are mean ± SD. Differences between groups (10 rats/group) were analyzed using one-way ANOVA by Tukey’s multiple range tests. Means with different superscript letters are significantly different at p < 0.05. Each group was assigned as follows: SC (PBS injection + non-treatment); NC (MIA injection + non-treatment); PC (MIA injection + 125 mg/kg glucosamine sulfate + 125 mg/kg chondroitin sulfate); LDB (MIA injection + 250 mg/kg deer bone extract); HDB (MIA injection + 500 mg/kg deer bone extract).

Fig. 5. TIMPs mRNA expression in articular cartilage of the MIA-induced OA rats treated with deer bone extract for 50 days.Note: Values are mean ± SD. Differences between groups (10 rats/group) were analyzed using one-way ANOVA by Tukey’s multiple range tests. Means with different superscript letters are significantly different at p < 0.05. Each group was assigned as follows: SC (PBS injection + non-treatment); NC (MIA injection + non-treatment); PC (MIA injection + 125 mg/kg glucosamine sulfate + 125 mg/kg chondroitin sulfate); LDB (MIA injection + 250 mg/kg deer bone extract); HDB (MIA injection + 500 mg/kg deer bone extract).

Reprints and Corporate Permissions

Please note: Selecting permissions does not provide access to the full text of the article, please see our help page How do I view content?

To request a reprint or corporate permissions for this article, please click on the relevant link below:

Academic Permissions

Please note: Selecting permissions does not provide access to the full text of the article, please see our help page How do I view content?

Obtain permissions instantly via Rightslink by clicking on the button below:

If you are unable to obtain permissions via Rightslink, please complete and submit this Permissions form. For more information, please visit our Permissions help page.