Figures & data
Figure 1. Relationship of platelet count with (a) CK.MA, (b) CKH.MA, and (c) CRT.MA. Reference ranges for the TEG® parameters are shown in green. Gray lines represent the point of statistical difference from the lower and upper bounds of the reference range; Brown line represents the point of saturation. Abbreviations: CK, citrated kaolin; CKH, citrated kaolin with heparin; CRT, citrated RapidTEG®; MA, maximum amplitude.
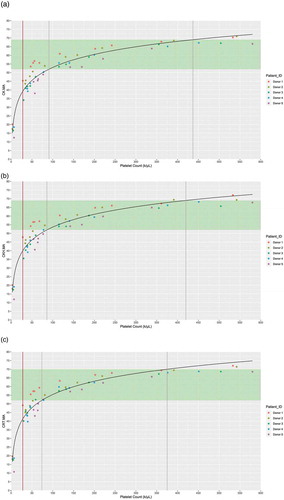
Figure 2. Relationship of abciximab concentration with (a) CK.MA, (b) CKH.MA, and (c) CRT.MA as correlated with LTA. The individual donor model is provided in colored dashed lines, with the overall model in black. Brown line represents the point of difference from baseline. Vertical dashed black line indicates the point of significant difference from the TEG® reference range.
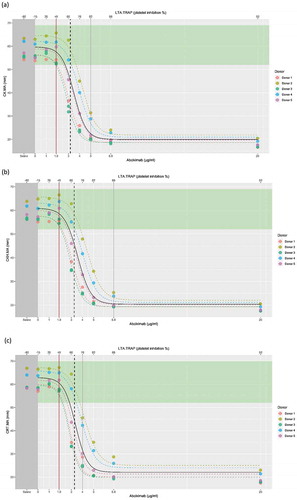
Figure 3. Linear mixed-effects model of (a) CK.R, (b) CKH.R, and (c) CRT.ACT in relation to the platelet count (k/μL), with the donor as a random effect. Individual donor model is provided in colored dashed lines, with the overall model in black. Reference range limits are shown in green. Abbreviations: ACT, activated clotting time; CK, citrated kaolin; CKH, citrated kaolin with heparinase; CRT, citrated RapidTEG®; R, reaction time.
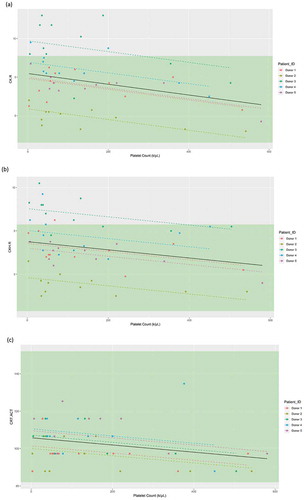
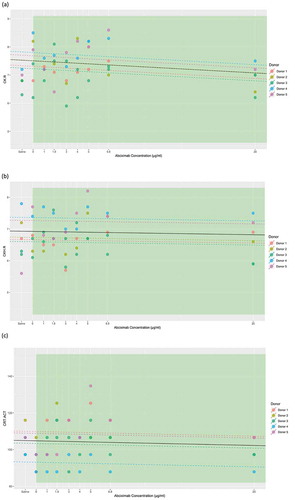
Figure 4. Linear mixed-effects model of (a) CK.R, (b) CKH.R, and (c) CRT.ACT in relation to the abciximab concentration with the donor as the random effect. The individual donor model is provided in colored dashed lines, with the overall model in black. Parameter reference range limits are shown in green. Abbreviations: CK, citrated kaolin; CKH, citrated kaolin with heparinase; CRT, citrated RapidTEG®; MA, maximum amplitude.