Figures & data
Figure 1. Schematic diagram of the IFE-IA.
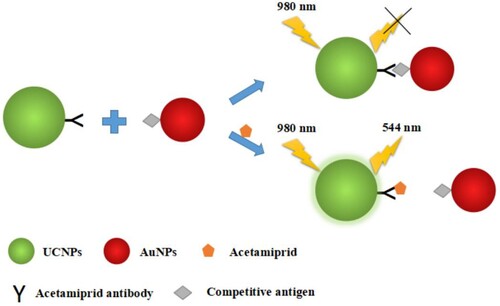
Figure 2. TEM images of amino-modified NaYF4:Yb,Er UCNPs (A), AuNPs (B) and the complex of UCNPs and AuNPs (C). The emission spectrum of UCNPs at the excitation of 980 nm and the absorption spectrum of AuNPs (C). Effect of fluorescence quenching for mAb-conjugated UCNPs by different concentrations of antigen-coupled AuNPs (0, 0.2, 0.4, 0.6, 0.8, 1.0, 1.2, 1.4, 1.6 nmol/L) (D).
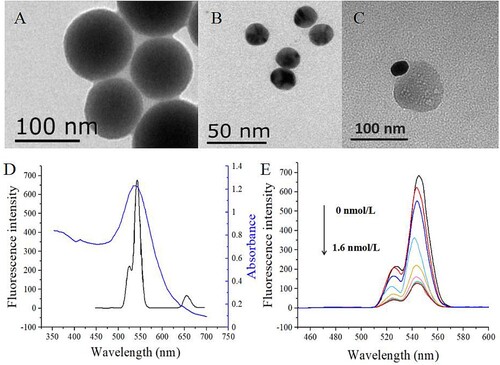
Figure 3. The changes of fluorescence intensity with different concentrations of acetamiprid (A) and the calibration curve of the IFE-IA for acetamiprid (B).
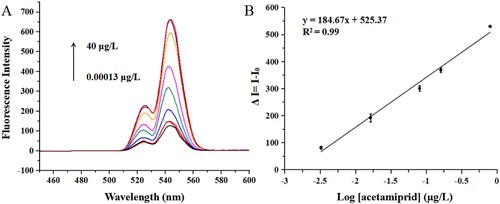
Table 1. The comparison of different immunoassays for acetamiprid.
Table 2. Cross-reactivity of acetamiprid toward its analogues.
Table 3. Average recoveries of samples spiked with acetamiprid.
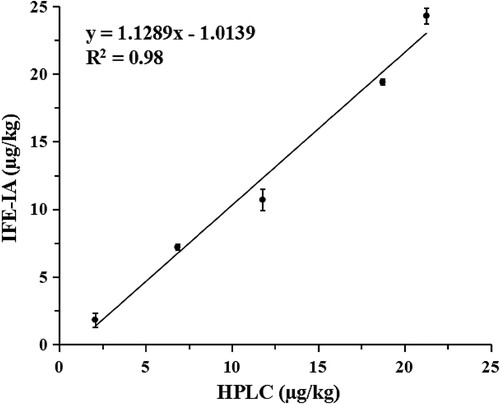
Figure 4. Correlation between the IFE-IA and HPLC for the detection of pear samples spiked with unknown concentration of acetamiprid.