
Figures & data
Figure 1. sample collection protocol.
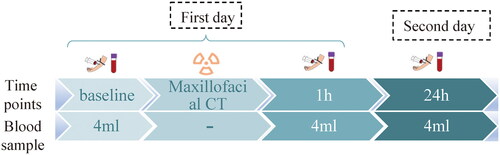
Table 1. The minimum, maximum and average CTDLvol, DLP and blood absorbed doses.
Figure 2. Number of γ-H2AX foci per cell at different time points. (a) and (b) are Plots illustrating the number of foci per cell at three time points; (c) bar plot showing number of foci per cell at 1h and 24h minus number of foci per cell at 0h (participants with missing value were excluded in (a) and (C)).
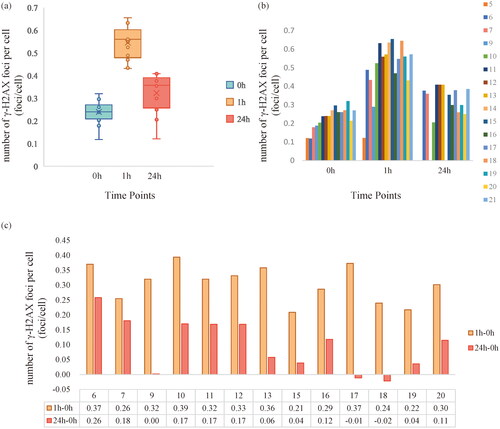
Figure 3. Linear relationship between the increased number of γ-H2AX foci per cell and doses represented by (3a) CT dose index Volume (CTDIvol), (3d) dose length-product (DLP) and (3c) blood absorbed dose at 1h. Each blue dot represents a participant’s dose-focus counterpart, and the dotted lines are linear tend lines. The dotted line represents linear trends. R2 is regression coefficient, y is linear regression expression.
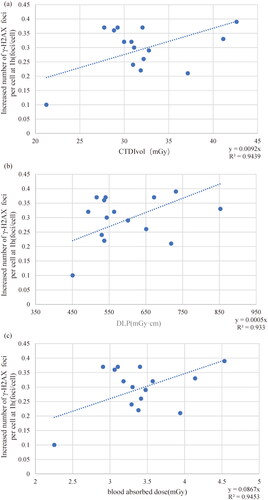
Figure 4. Box plot of different leukocyte cells. Abbreviations: CD8 + T: CD8+ T lymphocytes; CD4 + T: CD4 + T lymphocytes; NK: natural killer cells.
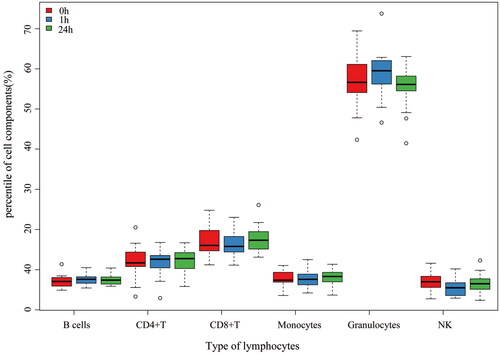
Table 2. Comparisons of different leukocyte cells at three time points.
Figure 5. Beta-value of cg 14283649.
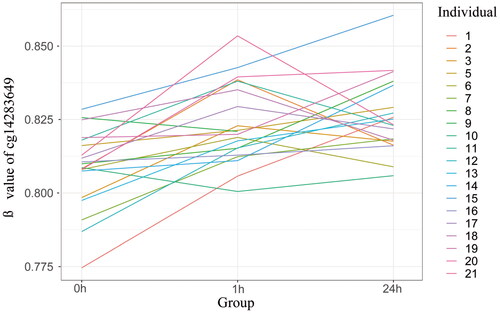
Table 3. FDR and the number of differentially methylated Positions with doses represented by different parameters.